Comparing the CASI-4R and the PGBI-10M for Differentiating
Bipolar Spectrum Disorders from Other Outpatient Diagnoses in
Youth
Mian-Li Ong1, Eric A. Youngstrom1, Jesselyn Jia-Xin Chua2, Tate F. Halverson1, Sarah M. Horwitz3, Amy Storfer-Isser4, Thomas W. Frazier5, Mary A. Fristad6, L. Eugene Arnold6, Mary L. Phillips7, Boris Birmaher7, Robert A. Kowatch8, Robert L. Findling9, and the LAMS Group
1University of North Carolina, Chapel Hill
2National University of Singapore
3New York University
4Statistical Research Consultants, LLC
5Cleveland Clinic Foundation
6Ohio State University
Correspondence concerning this article should be addressed to Eric A. Youngstrom, Department of Psychology, University of North Carolina at Chapel Hill, CB #3270, Davie Hall, Chapel Hill, NC 27599-3270. [email protected].
Mian-Li Ong, Department of Psychology and Neuroscience, University of North Carolina at Chapel Hill; Eric A. Youngstrom, Department of Psychology and Neuroscience, University of North Carolina at Chapel Hill; Jesselyn Jia-Xin Chua, Department of Psychology, National University of Singapore; Tate F. Halverson, Department of Psychology and Neuroscience, University of North Carolina at Chapel Hill; Sarah M. Horwitz, Department of Child and Adolescent Psychiatry; Amy Storfer-Isser, Statistical Research Consultants, LLC; Thomas W. Frazier, Cleveland Clinic Foundation; Mary A. Fristad, Department of Psychology, Ohio State University; L. Eugene Arnold, Research Unit on Pediatric Psychopharmacology, Ohio State University; Mary L. Phillips, Department of Psychiatry, University of Pittsburgh; Boris Birmaher, Department of Psychiatry, University of Pittsburgh; Robert A. Kowatch, Cincinnati Children’s Hospital Medical Center, Robert L. Findling, Department of Psychiatry, Johns Hopkins University.
Conflict of Interest: Mian-Li Ong declares that he has no conflict of interest. Eric Youngstrom has consulted with Pearson, Western Psychological Services, Johnson & Johnson, Lundbeck and Otsuka about psychological assessment. Jesselyn Jia-Xin Chua declares that she has no conflict of interest. Tate Halverson declares that she has no conflict of interest. Sarah Horwitz declares that she has no conflict of interest. Amy Storfer-Isser declares that she has no conflict of interest. Thomas Frazier has received federal funding or research support from, acted as a consultant to, received travel support from, and/or received a speaker’s honorarium from the Cole Family Research Fund, Simons Foundation, Ingalls Foundation, Forest Laboratories, Ecoeos, IntegraGen, Kugona LLC, Shire Development, Bristol-Myers Squibb, National Institutes of Health, and the Brain and Behavior Research Foundation. Mary Fristad receives royalties from American Psychiatric Press, CFPSI and Guilford Press and honoraria from American Occupational Therapy Association and Physicians’ Post-Graduate Press. Eugene Arnold has received research funding from Curemark, Forest, Lilly, Neuropharm, Novartis, Noven, Shire, and YoungLiving (as well as NIH and Autism Speaks) and has consulted with or been on advisory boards for Arbor, Gowlings, Neuropharm, Novartis, Noven, Organon, Otsuka, Pfizer, Roche, Seaside Therapeutics, Sigma Tau, Shire, Tris Pharma, and Waypoint and received travel support from Noven. Mary Phillips is a consultant for Roche
Pharmaceuticals. Robert Kowatch declares that he has no conflict of interest. Robert Findling receives or has received research support, acted as a consultant and/or served on a speaker’s bureau for Alcobra, American Academy of Child & Adolescent Psychiatry, American Physician Institute, American Psychiatric Press, AstraZeneca, Bracket, Bristol-Myers Squibb, CogCubed, Cognition Group, Coronado Biosciences, Dana Foundation, Elsevier, Forest, GlaxoSmithKline, Guilford Press, Johns Hopkins University Press, Johnson and Johnson, Jubilant Clinsys, KemPharm, Lilly, Lundbeck, Merck, NIH, Neurim, Novartis, Noven, Otsuka, Oxford University Press, Pfizer, Physicians Postgraduate Press, Purdue, Rhodes Pharmaceuticals, Roche, Sage, Shire, Sunovion, Supernus Pharmaceuticals, Transcept Pharmaceuticals, Validus, and WebMD.
Compliance with Ethical Standards
Ethical approval: All procedures performed in studies involving human participants were in accordance with the ethical standards of the institutional and/or national research committee and with the 1964 Helsinki declaration and its later amendments or comparable
HHS Public Access
Author manuscript
J Abnorm Child Psychol
. Author manuscript; available in PMC 2017 November 14.Published in final edited form as:
J Abnorm Child Psychol. 2017 April ; 45(3): 611–623. doi:10.1007/s10802-016-0182-4.
A
uthor Man
uscr
ipt
A
uthor Man
uscr
ipt
A
uthor Man
uscr
ipt
A
uthor Man
uscr
7University of Pittsburgh
8Cincinnati Children’s Hospital Medical Center
9John Hopkins University/Kennedy Krieger Institute
Abstract
We compared 2 rating scales with different manic symptom items on diagnostic accuracy for detecting pediatric bipolar spectrum disorder (BPSDs) in outpatient mental health clinics. Participants were 681 parents/guardians of eligible children (465 male, mean age = 9.34) who completed the Parent General Behavior Inventory-10-item Mania (PGBI-10M) and mania subscale of the Child and Adolescent Symptom Inventory-Revised (CASI-4R). Diagnoses were based on KSADS interviews with parent and youth. Receiver operating characteristic (ROC) analyses and diagnostic likelihood ratios (DLRs) determined discriminative validity and provided clinical utility, respectively. Logistic regressions tested for incremental validity in the CASI-4R mania subscale and PGBI-10M in predicting youth BPSD status above and beyond demographic and common diagnostic comorbidities. Both CASI-4R and PGBI-10M scales significantly
distinguished BPSD (N=160) from other disorders (CASI-4R: Area under curve (AUC) = .80, p < .0005; PGBI-10M: AUC = .79, p < .0005) even though scale items differed. Both scales
performed equally well in differentiating BPSDs (Venkatraman test p > .05). Diagnostic likelihood ratios indicated low scores on either scale (CASI: 0–5; PGBI-10M: 0–6) cut BPSD odds to 1/5 of those with high scores (CASI DLR− = 0.17; PGBI-10M DLR− = 0.18). High scores on either scale (CASI: 14+; PGBI-10M: 20+) increased BPSD odds about fourfold (CASI DLR+ = 4.53; PGBI-10M DLR+ = 3.97). Logistic regressions indicated the CASI-4R mania subscale and PGBI-10M each provided incremental validity in predicting youth BPSD status. The CASI-4R is at least as valid as the PGBI-10M to help identify BPSDs, and can be considered as part of an assessment battery to screen for pediatric BPSDs.
Keywords
bipolar disorder; adolescents; assessment; receiver operating characteristic; diagnostic likelihood ratio; CASI; PGBI-10M
Bipolar Spectrum Disorders (BPSDs) are characterized by abnormal and recurrent dysregulation of mood and energy (Goodwin & Jamison, 2007) and affect approximately 1.8% of youth in the United States (Van Meter, Moreira, & Youngstrom, 2011). The term BPSDs includes several diagnoses that differ according to duration and severity of manic symptoms, (i.e., Bipolar I Disorder (BP-I), Bipolar II Disorder (BP-II), cyclothymic disorder, and Other Specified Bipolar and Related Disorders--known as Bipolar Disorder-Not Otherwise Specified (BP-NOS) in DSM-IV-TR). BPSDs are correlated with a host of adverse outcomes in youth, including high rates of suicide attempts (Goldstein et al., 2012; Hauser, Galling, & Correll, 2013), alcohol and substance use (Stewart et al., 2012) and incarceration (Pliszka, Sherman, Barrow, & Irick, 2000). Despite severity of symptoms and adverse outcomes, diagnosing BPSDs continues to be challenging for clinicians (Miller, Johnson, Kwapil, & Carver, 2011). Individuals often remain in the mental health services system 5 to 15 years before an accurate diagnosis of a BPSD is made (Ghaemi, Boiman, &
A
uthor Man
uscr
ipt
A
uthor Man
uscr
ipt
A
uthor Man
uscr
ipt
A
uthor Man
uscr
Goodwin, 1999; Hirschfeld et al., 2003; Marchand, Wirth, & Simon, 2006), leading to inappropriate treatment and poorer outcomes. There is a crucial need for accurate screening tools that can be administered quickly to identify individuals at risk for BPSDs.
The diagnosis of BPSDs is particularly challenging in youth due to high comorbidity with disruptive behavior disorders and ADHD, which share symptoms with BPSDs (such as difficulty concentrating, impulsivity, and irritability). Consequently, these symptoms become a source of confusion when evaluating a child or adolescent using a single time point (Geller et al., 2002). Additionally, youth with BPSDs are often misdiagnosed with major depression (Chilakamarri, Filkowski, & Ghaemi, 2011; c.f. Pacchiarotti et al., 2013).
Many youth with BPSDs have a history of a depressive episode, and the onset of hypomanic symptoms following a depressive episode is likely to go unnoticed when a diagnosis of major depressive disorder is already present. This increases the likelihood that a more accurate diagnosis of BP-II disorder will not be made. Treatment of BPSDs with
antidepressants has been found to be ineffective for ameliorating mixed states (Pacchiarotti et al., 2013). Treating BPSDs with antidepressants may exacerbate hypomanic/manic symptoms or cycling (Chilakamarri et al., 2011; cf. Joseph, Youngstrom, & Soares, 2009) or result in delays in receiving efficacious treatment. Considering that youth with BPSDs often present in a depressive episode, accurate screening tools for BPSDs can be useful in helping to identify such youth more quickly at the point of screening, as compared to only starting to identify them during more extensive diagnostic assessments.
However, diagnosing a patient who possibly has pediatric BPSD remains a challenging endeavor. Multiple screening tools are available to assess BPSD symptoms that could signal the need for more thorough evaluation (Youngstrom, Genzlinger, Egerton, & Van Meter, 2015). Yet, little is known about how scores on these screening tools may change the probability of a BPSD diagnosis in youth. While an evidence-based approach to assessment (Straus, Glasziou, Richardson, & Haynes, 2011) improves accuracy of the estimated likelihood of a BPSD diagnosis, the information needed to take advantage of this approach is often unavailable. Providing diagnostic likelihood ratios (DLRs) for commonly used clinical tools and demonstrating how to integrate them into an evidence-based approach to assessment can potentially improve the assessment, diagnosis and treatment of BPSDs in youth.
Several well-established measures may possibly increase the likelihood of accurate assessment of BPSDs in children and adolescents, such as the parent-reported General Behavior Inventory (P-GBI; Youngstrom, Findling, Danielson, & Calabrese, 2001), its 10-item version (PGBI-10M; Youngstrom, Frazier, Demeter, Calabrese, & Findling, 2008), a brief version of the Child Mania Rating Scale-Parent version (CMRS-P; Henry et al., 2008) and the parent-reported Mood Disorder Questionnaire (P-MDQ; Wagner et al., 2006). A recent meta-analysis by Youngstrom et al. (2015) established the status of these three assessments as top tier measures in terms of discriminative validity for pediatric BPSD. The PGBI-10M abbreviated the P-GBI by focusing on the 10 items that best discriminated BPSDs from other outpatient diagnoses, hence optimizing its value as a screening tool for detecting BPSDs.
A
uthor Man
uscr
ipt
A
uthor Man
uscr
ipt
A
uthor Man
uscr
ipt
A
uthor Man
uscr
Each of these three measures possesses different advantages. For instance, the P-GBI demonstrates exceptionally high internal consistency and reliability, high diagnostic efficiency and an ability to differentiate accurately between BPSDs and ADHD, arguably one of the most difficult differential diagnoses to make (Galanter & Leibenluft, 2008; Geller et al., 2002). Such measures with mania-specific items have performed significantly better (Youngstrom et al., 2004) than established and commonly-used broad-coverage measures that do not include scales that specifically screen for mania, such as the Child Behavior Checklist (CBCL; Achenbach & Rescorla, 2001), though the latter has been widely researched for assessment of multiple disorders. However, since evidence-based assessment approaches do not recommend specific screening for a particular disorder, but rather leading with a broad test that assesses more common diagnostic issues (Jenkins, Youngstrom, Washburn, & Youngstrom, 2011; Youngstrom, Choukas-Bradley, Calhoun, & Jensen-Doss, 2014), there is a need to embed a mania scale in broad, frontline assessments.
The CASI-4R Mania Subscale
The Child and Adolescent Symptom Inventory-Revised (CASI-4R; (Gadow & Sprafkin, 2005) is a broad assessment tool that may fill a gap in the current evidence-based toolkit. First, the CASI-4R consists of symptom modules that can be scored to derive symptom counts that map to a DSM-IV-TR (American Psychiatric Association, 2000) diagnosis, giving the CASI-4R high content validity (Sprafkin, Steinberg, Gadow, & Drabick, 2013). Second, the CASI-4R combines items from both the Child Symptom Inventory-4 (CSI-4) and the Adolescent Symptom Inventory (ASI-4; Gadow & Sprafkin, 2005), making it useful as a developmentally appropriate screening tool for both children and adolescents. Third, the CASI-4R also provides a dimensional perspective via severity scores (Sprafkin et al., 2013). Fourth, akin to current frontrunners of BPSD assessment, such as the PGBI-10M, the CASI-4R mania subscale (which is derived from the CASI-4R questionnaire) is efficient to administer, with only nine questions on the subscale. Fifth, the CASI-4R mania subscale complements the PGBI-10M by having different items. Finally, because other broad assessment packages such as the Child Behavior Checklist (CBCL; Achenbach & Rescorla, 2001) and Strengths and Difficulties Questionnaire (SDQ; Goodman, 1997) do not have mania-specific scales, the CASI-4R potentially fills a niche by integrating a mania scale into a tool that simultaneously assesses more common issues such as ADHD, anxiety, and disruptive behavior disorders. Taken together, characteristics of the CASI-4R suggest that the CASI-4R mania subscale may have clinical utility in reliably and quickly providing information about manic symptoms before a more structured diagnostic evaluation for those at risk for BPSDs is administered. Because established measures already exist, it is
important to benchmark the CASI-4R mania subscale against one of the top-tier tools. If it performs comparably, the advantage of having a mania measure embedded in a general, broad assessment would give the CASI-4R mania subscale an advantage as a screener to assess for specific symptoms that may better discriminate BPSDs. If it performs
substantially less well, then evaluating a two-stage assessment process, where a suggestive score on the CASI-4R mania subscale gets followed by a more focused evaluation could be considered (Youngstrom, Jenkins, Jensen-Doss, & Youngstrom, 2012).
A
uthor Man
uscr
ipt
A
uthor Man
uscr
ipt
A
uthor Man
uscr
ipt
A
uthor Man
uscr
The present study examined discriminative and diagnostic validity of the CASI-4R mania subscale in differentiating youth with BPSDs from those with non-BPSD diagnoses in an outpatient setting. All youth in the sample were evaluated using a gold standard diagnostic assessment, the Schedule of Affective Disorders and Schizophrenia for Children (KSADS-PL-W; Findling et al., 2010), providing the opportunity to compare discriminative ability of the CASI-4R mania subscale with the PGBI-10M against DSM-IV-TR diagnoses. We also estimated multi-level diagnostic likelihood ratios (DLRs) to facilitate clinicians’ use of the mania subscale in the assessment of pediatric BPSDs (Straus et al., 2011). Finally, in keeping with teacher report as a possible accurate indicator of pediatric BPSD (Carlson & Klein, 2014), we also explored the teacher report of the CASI-4R mania subscale by running discriminative and incremental validity analyses. Due to its psychometric properties and clear mapping of DSM-IV-TR BPSD diagnoses (American Psychiatric Association, 2000; Sprafkin, Gadow, Salisbury, Schneider, & Loney, 2002), we hypothesized the CASI-4R mania subscale would discriminate pediatric BPSDs with accuracy similar to well-established scales such as the PGBI-10M (Youngstrom et al., 2005).
Method
Participants and procedures
This study is a secondary analysis of baseline assessment data from the Longitudinal Assessment of Manic Symptoms (LAMS) study, a NIMH-supported prospective cohort study examining children with elevated symptoms of mania (ESM). Participants were 707 youth (465 male, mean age = 9.34) and their caregivers recruited from December 2005 to December 2008 (Horwitz et al., 2010). The present study includes 681 caregivers who completed both the PGBI-10M and CASI-4R mania subscale at baseline. Nine child outpatient mental health clinics in four university-affiliated LAMS sites recruited participants (Case Western Reserve University, Cincinnati Children’s Medical Center, the Ohio State University and the University of Pittsburgh Medical Center/Western Psychiatric Institute and Clinic). Parents/guardians of all eligible children between age 6 and 12 completed the Parent General Behavior Inventory-10 Item Mania Scale (PGBI-10M) to screen for elevated symptoms of mania (ESM+). All youth who scored more than 12 on the PGBI-10M were invited to participate in the study. For those who scored 11 or less, a matched group (approximately one-fifth of the ESM- sample) of children (similar in age, sex, race/ethnicity and insurance status) were recruited. Horwitz et al. (2010) provides details about subject ascertainment and the rationale for the cut score of 12 on the
PGBI-10M. Exclusion criteria were: (a) if youth or caregiver did not speak English; or (b) if there was evidence that manic symptoms were due to a general medical condition. Data collection was planned before gathering the index tests (i.e., parent-report measures) and reference standard (i.e., diagnostic interview). Caregivers provided written consent, and youth provided assent. Caregivers provided demographic information, including age, sex, race, ethnicity, and health insurance status (Findling et al., 2010). Bachelors, masters and doctoral level interviewers trained by rating taped interviews and then leading
administrations with experienced interviewers concurrently serving as raters.
A
uthor Man
uscr
ipt
A
uthor Man
uscr
ipt
A
uthor Man
uscr
ipt
A
uthor Man
uscr
Measures
Index Tests
Child and Adolescent Symptom Inventory-Revised (CASI-4R) Mania Subscale: The
CASI-4R is a 163-item caregiver-completed pencil-and-paper rating scale for evaluating youth five to 18 years old. The CASI-4R combines symptom modules from the Child Symptom Inventory-4 (CSI-4) and Adolescent Symptom Inventory-4 (ASI-4) (Gadow & Sprafkin, 2005), and sums to generate a global severity score for each disorder using symptom counts. Nine items measure manic symptoms (questions L98–L106), addressing DSM mania criteria using queries about cheerful and irritable mood, activity level, sleep need, talkativeness, distractibility, and items that try to address flight of ideas, grandiosity and severe impulsivity. Item severity scores range from 0 (never) to 3 (very often). A specific symptom is considered to be clinically relevant if it is rated by the clinician to be either happening often or very often. When the total symptom count is equal or exceeds the number of symptoms required to meet a DSM-IV-TR bipolar disorder diagnosis, the child then screens positive for the disorder. The CSI-4 and ASI-4, from which the CASI-4R was derived, have shown satisfactory internal consistency, test-retest reliability and convergent validity compared to corresponding scales of the Child Behavior Checklist (Achenbach & Rescorla, 2001) and the Conner’s Parent Rating Scale (Conners, 1997). The parent-report CASI-4R mania subscale has demonstrated adequate psychometric properties, with Cronbach’s alphas of .86 – .89 (Gadow & Drabick, 2012; Gadow & Sprafkin, 2008).
Parent General Behavior Inventory (PGBI-10M): The PGBI-10M (Youngstrom, Frazier,
et al., 2008) is a 10-item parent-report instrument derived from the parent version (Youngstrom et al., 2001) of the General Behavior Inventory (GBI; Depue et al., 1981); it collects hypomanic, manic and biphasic symptoms. The PGBI-10M kept the 10 items best at discriminating bipolar disorder from other diagnoses (Youngstrom, Frazier, et al., 2008). Item scores range from 0 (never or hardly ever) to 3 (very often or almost constantly). Total scores range from 0 to 30, with higher scores indicating greater severity. In the present study, internal consistency for the PGBI-10M (Cronbach’s alpha = .87) was good.
Reference Standard: Semi-structured diagnostic interview using the Schedule of Affective Disorders and Schizophrenia for Children (KSADSPL-W): All participants
and their families completed a semi-structured diagnostic interview, the KSADSPL-W, which combined the KSADS-Present and Lifetime Episode (K-SADS-PL; Kaufman et al., 1997) and the mood disorders module from the Washington University KSADS (WASH-U-KSADS; Geller, Warner, Williams, & Zimerman, 1998; Geller et al., 2001). The mood disorders module of the WASH-U-KSADS includes additional symptoms and associated features of bipolar spectrum disorders as per DSM-IV-TR. The LAMS study used the Course of Bipolar Youth (COBY) criteria for BP-NOS: (1) elated mood and at least two associated symptoms of mania (such as racing thoughts, pressured speech, thoughts of grandiosity, decreased need for sleep), or irritable mood with at least three associated symptoms of mania; (2) an associated change in functioning; (3) symptoms needed to be present for at least four hours within a 24-hour period; and (4) the participant must have had at least four episodes of four-hour duration or a total of four days meeting the above criteria (Axelson et al., 2006). A highly trained research assistant administered the interview
A
uthor Man
uscr
ipt
A
uthor Man
uscr
ipt
A
uthor Man
uscr
ipt
A
uthor Man
uscr
(training included watching previously taped administrations of the WASH-U-KSADS). Inter-rater reliabilities were strong, with kappas of .82 for WASH-U-KSADS diagnoses and . 93 for BPSD diagnoses. A licensed child psychiatrist or psychologist confirmed all
diagnoses. The child psychiatrist or psychologist were blind to scores on the PGBI-10M and the CASI-4R.
Data Analytic Plan
Preliminary analyses. Because the sampling plan followed an a priori design, we weighted primary analyses by site to adjust for the sampling by ESM status (Van Meter et al., in press). Descriptive statistics summarized clinical and demographic characteristics of the sample, while t-tests and chi-square analyses tested for significant differences between youth with BPSD and other youth in the sample. Although the primary analyses used
nonparametric methods, it is still important to examine score distributions for evidence of degeneracy (Youngstrom, 2014; Zhou, Obuchowski, & McClish, 2011). Degeneracy refers to distributions that either (a) have a bimodal score distribution; (b) have regions where score frequencies fail to progress monotonically (Zhou et al., 2011); or (c) the comparison group has a subset of cases with scores more extreme than the BPSD group on otherwise valid indicators. When degeneracy occurs, it can result in inaccurate estimates of test accuracy (Zhou et al., 2011). Low scoring cases were undersampled by design, so all subsequent analyses weighted the ESM- cases to adjust for the sampling to produce unbiased results (Van Meter et al., in press). Youngstrom (2014) makes a strong case for representative samples when calculating DLRs to avoid inaccuracies that may result from a biased sample. All results are based on the weighted analyses unless otherwise stated. Analyses were done using SPSS-Version 22.0 and the pROC package in R (R Development Core Team, 2014; Robin et al., 2011).
Receiver operating characteristic (ROC) analysis: ROC curves depict the balance
between the probability of a true positive test result for those who have the target condition (known as sensitivity) and the probability of a true negative test result for those who do not have the condition (known as specificity). In this study, ROC analyses quantified the ability of each scale to distinguish cases with BPSD (which included BP-I, BP-II, cyclothymic disorder and BP-NOS) from all other cases (e.g., individuals with ADHD or anxiety disorders).
The area under the curve (AUC) is an effect size quantifying diagnostic accuracy of test scores. An AUC of 1.0 would indicate that the test performed with perfect diagnostic accuracy, while an AUC of .50 would indicate chance performance (Obuchowski, 2003; Zhou et al., 2011). Standard guidelines for evaluating AUC values include: (a) < .70 = poor, . 70 – .79 = fair; .80 – .89 = good, and .90 – 1.00 = excellent (Swets, Dawes, & Monahan, 2000). Values higher than .90 in mental healthcare contexts are often the result of design flaws, such as comparing clinical cases to healthy controls (Youngstrom et al., 2015; Youngstrom, Meyers, Youngstrom, Calabrese, & Findling, 2006). Asymmetric 95%
confidence intervals quantified uncertainty around the AUCs. Furthermore, the Venkatraman test (2000), computed in R version 3.2.2, compared the AUCs for each subscale to see if any subscale performed significantly better than others in discriminating youth with BPSD and
A
uthor Man
uscr
ipt
A
uthor Man
uscr
ipt
A
uthor Man
uscr
ipt
A
uthor Man
uscr
without BPSD. The Venkatraman test has an added advantage over confidence intervals in that it permits distinguishing between two ROC curves that have similar overall point estimates of areas but do not cross (Venkatraman, 2000). The Venkatraman test uses bootstrapping to repeatedly sample areas under each curve and compare ROC curves based on shape rather than numerical value alone.
Diagnostic Likelihood Ratios (DLRs): DLRs refer to the change in odds of the diagnosis
based on assessment results. DLRs capture more detailed diagnostic information for decision making about individual cases. They repackage diagnostic sensitivity and specificity to help estimate posterior predictive values (Straus et al., 2011). Clinicians can combine DLRs with prior probability of the diagnosis (often the base rate of the diagnosis) by means of a probability nomogram, online calculators, or Bayes’ Theorem (Jaeschke, Guyatt, & Sackett, 1994; Youngstrom et al., 2014) to obtain an updated risk of the individual having the disorder. We estimated likelihood ratios for tertiles of score ranges (Jaeschke et al., 1994; Straus et al., 2011). This (a) preserved more diagnostic information from test results; (b) ensured that scales behaved monotonically (Guyatt & Rennie, 2002; Zhou et al., 2011); and (c) reduced ambiguity for high-stakes clinical decision making. DLRs of .5 to 2 alter probability to a small (and rarely important) degree; DLRs between 2 and 5 (or, conversely, 0.5–0.2) generate small (but sometimes important) changes in clinical probability; DLRs between 5.0 and 10.0 (or 0.1–0.2) reflect moderate shifts in pre- to posttest probability, and DLRs greater than 10 (or smaller than 0.1) are often clinically decisive (Straus et al., 2011).
Positive and negative predictive values: Positive predictive power describes the percentage
of cases testing positive that have the diagnosis, while negative predictive power refers to the accuracy of negative test results. While these concepts are clinically helpful for clinicians, they change as a function of base rate, and are less preferred over DLRs. This is because DLRs use the concepts of sensitivity and specificity, which are not affected by the base rate and can be used in multiple clinical settings.
Logistic regressions: Hierarchical logistic regressions evaluated the strength of the
CASI-4R mania subscale and PGBI-10M in predicting BPSD diagnosis in youth after adjusting for sex, age of child at baseline assessment, race (white versus nonwhite), any anxiety disorder, attention-deficit hyperactivity disorder, any disruptive behavior disorder diagnosis (conduct disorder, oppositional defiant disorder, disruptive behavior disorder NOS, intermittent explosive disorder, impulse-control disorder NOS, adjustment disorder with disturbance of conduct). Model 1 entered demographic variables, and Model 2 controlled for both demographic and diagnostic covariates. Finally, Model 3 entered the CASI-4R mania subscale variable and PGBI-10M scale separately in the last block. We reported the Nagelkerke R2 and the log-likelihood ratios as the main ways of describing fit and
significance; we also reported classification accuracy for descriptive purposes, even though it is not a strong measure of model fit (Hosmer & Lemeshow, 2000).
A
uthor Man
uscr
ipt
A
uthor Man
uscr
ipt
A
uthor Man
uscr
ipt
A
uthor Man
uscr
Results
Descriptive Statistics
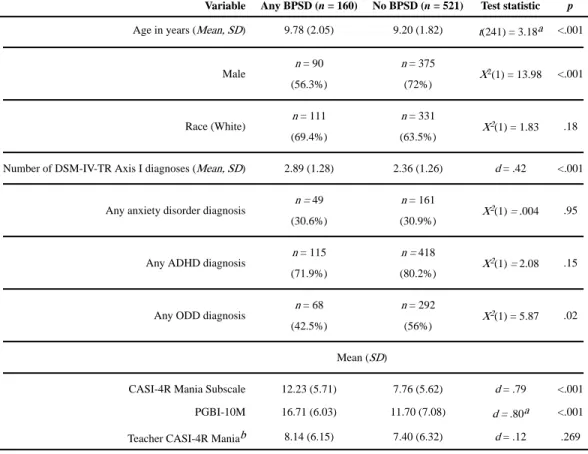
Table 1 presents group differences between youth with BPSD and youth without BPSD by (a) sex; (b) race; (c) age; (d) CASI-4R and baseline PGBI-10M total scores; and (e) number of DSM-IV-TR Axis I diagnoses. The BPSD group had a significantly higher proportion of females and older youth. There were no significant differences in race (white vs nonwhite) by diagnostic group. The BPSD group scored higher on the CASI-4R and the baseline PGBI-10M, offering preliminary evidence of discriminative validity.
Diagnostic Efficiency Statistics
Table 2 presents findings from ROC analyses. Back-to-back histograms for all distributions did not indicate degenerate distributions or outliers (Youngstrom, 2014). AUC values quantified performance of the CASI-4R mania subscale for distinguishing between youth with BPSD from other youth. Both the CASI-4R mania subscale and the PGBI-10M scale attained medium-large effect sizes for validity at distinguishing BPSD-positive youth from BPSD-negative youth (CASI-4R mania subscale: AUC = .80, PGBI-10M: AUC = .79; p < . 0005). The Venkatraman test indicated that the two scales did not perform significantly differently, consistent with their close point estimates for AUC, p > .05.
Diagnostic Likelihood Ratios (DLRs)
To estimate DLRs, we divided scores on each subscale into three tertiles (low, indeterminate, high). We also reported sensitivity and specificity for the lower tertile and the higher tertile, and provided the relevant positive predictive value and negative predictive value. Table 2 reports DLRs for the CASI-4R mania subscale and the PGBI-10M, and Table 4 provides optimal thresholds for P-GBI and CASI-4R mania scale scores. On the CASI-4R mania subscale, BPSD-positive youth were over four times as likely to score more than 14 than those who did not receive a BPSD diagnosis (DLR = 4.53). This cutoff score correctly classified about 37% (sensitivity) of youth with BPSD and 91% of youth without BPSD (specificity). Conversely, youth with BPSD were about 1/5 as likely to score 5 or below as those who were youth without BPSD (DLR =0.17). This cutoff range correctly classified about 90% (sensitivity) of youth with BPSD and 37% of youth without BPSD (specificity). On the PGBI-10M scale, youth with BPSD were about four times as likely to score 20 or above as youth without BPSD (DLR = 3.97). This cutoff score correctly classified about 34% (sensitivity) of youth with BPSD and 93% of youth without BPSD (specificity). Conversely, youth with BPSD were also less than 1/5 as likely to score 6 or below as those who were youth without BPSD (DLR = 0.18). This cutoff range correctly classified about 94% of youth with BPSD diagnoses (sensitivity) and 28% of youth without BPSD (specificity).
Incremental Validity of CASI-4R and PGBI-10M
Logistic regressions clarified the robustness of the CASI-4R mania subscale and PGBI-10M in predicting BPSD status, after controlling for demographic and common diagnostic comorbidities (Table 1). Model 1 controlled for demographic variables. The overall model
A
uthor Man
uscr
ipt
A
uthor Man
uscr
ipt
A
uthor Man
uscr
ipt
A
uthor Man
uscr
explained 16% of variance in BPSD status (Nagelkerke R2 = .16, p < .0005), and predicted BPSD status with 87% accuracy. BPSD status was associated with being female and increased age (ps < .0005). Being white did not predict BPSD status (p = 0.52). Model 2 added diagnostic variables to determine if they predicted BPSD status above and beyond the variables in Model 1. Model 2 explained an additional 1.3% of the variance in BPSD status (p <.0005), and predicted BPSD status accurately 86% of the time. Of note, the
improvement in R-squared and log-likelihood (or chi-squared) combined with no change in classification accuracy (or even slight decrease in accuracy) is an unusual, but known feature of logistic regression. ADHD (p = .09), anxiety disorder (p = .26) and oppositional defiant disorder (p = .05) did not predict BPSD status when controlling for demographic variables. Finally, Model 3 was analyzed twice separately, with the CASI-4R mania subscale and PGBI-10M, to determine if higher scores were more likely to predict BPSD status. First, higher CASI-4R mania scores predicted BPSD status (Wald = 134.34, p < .0005). The overall model with the CASI-4R mania subscale was significant (X2 = 288.54, p < .0005), explaining an additional 22% of the variance (ΔNagelkerke R2 = .22, total R2 = .38), and predicted BPSD status accurately 87% of the time. Second, higher PGBI-10M scores predicted BPSD status (Wald = 129.47, p < .0005). The overall model with the PGBI-10M scale was significant (X2 = 274.58, p < .0005), explained an additional 20% of the variance in BPSD status (ΔNagelkerke R2 = .20, total R2 = .37), and predicted BPSD status
accurately 86.4% of the time. Third, higher PGBI-10M and P-GBI scores predicted BPSD status when entered into the model simultaneously: Wald (CASI mania) = 20.30, p < .0005; Wald (PGBI-10M) = 8.90, p < .01. The overall model with both scales was significant (X2 = 113.61, p < .0005), explained an additional 23% of the variance in BPSD status
(ΔNagelkerke R2 = .17, total R2 = .23), and predicted BPSD status accurately 77% of the time.
Sensitivity Analyses: Teacher report
The CASI-4R teacher report failed to show good validity for identifying cases with bipolar disorder, with an AUC of .54 (indicating that teacher report on the CASI-4R performed at about chance level when identifying youth with and without BPSDs). Teacher report scores on the CASI-4R were consistently lower than parent report when comparing the bipolar with ADHD group, as well as the bipolar without ADHD group, although teachers endorsed a moderate amount of CASI-4R items across all diagnostic groups (see Table 3). Both the caregiver CASI-4R mania scale and PGBI-0010M outperformed the teacher-reported CASI-4R mania subscale considerably, p < .001 (Venkatraman, 2000). Logistic regressions found no incremental value in combining teacher and caregiver report, before or after adjusting for age and sex.
Discussion
The present study evaluated diagnostic efficiency of the CASI-4R mania scale for detecting BPSD in youth aged 6–12 years seeking outpatient mental health services. The CASI-4R mania scale performed at a similar level as the P-GBI, a top-tier measure for discriminating cases with bipolar disorder. Clinicians should use the high risk range of 14+ on the CASI-4R mania scale (DLR = 4.53) as a reference point to be watchful for bipolar spectrum disorders.
A
uthor Man
uscr
ipt
A
uthor Man
uscr
ipt
A
uthor Man
uscr
ipt
A
uthor Man
uscr
Conversely, scores in the low-risk range (5 or lower) decrease the odds of a bipolar spectrum disorder (DLR = 0.17). A trained clinician should clarify the diagnosis by integrating collateral information (family history, environmental stressors, parent and peer report) or by administering a semi-structured diagnostic interview focused on mood episodes.
Although there are now a variety of rating scales with statistically significant discriminative validity for BPSD (Youngstrom et al., 2015), the CASI-4R could fill an important need in clinical practice. The CASI-4R content covers a broad range of DSM disorders, and it also contains a mania scale. Other instruments with broad content coverage, such as the ASEBA (Achenbach & Rescorla, 2001) and the SDQ (Goodman, 1997) do not include mania scales. Efforts to rationally or empirically build mania scales or composites post-hoc from these general psychopathology item sets produce results that perform similarly to using the Externalizing score to predict bipolar status (Diler et al., 2009; Kahana, Youngstrom, Findling, & Calabrese, 2003) and significantly less strong than performance of several scales that focus on symptoms specific to mania. Conversely, the best performing mania scales are stand alone tools that do not assess other common disorders or dimensions of functioning. The present study kept the CASI-4R mania subscale embedded in the regular, full length version, mimicking how clinicians might use it to obtain information about manic symptoms as part of an initial general intake. Analyses evaluated scale performance under clinically realistic conditions, directly comparing discriminative validity to one of the incumbent, best performing measures, the PGBI-10M.
Both the CASI-4R mania subscale and the PGBI-10M discriminate youth with BPSD from treatment-seeking youth with related and comorbid disorders equally well. DLRs for the CASI-4R mania subscale were similar to the PGBI-10M. Incorporating Bayesian methods as part of the assessment process enables clinicians to integrate multiple sources of data, improving predictions made about diagnosis and prognosis (Jenkins et al., 2011; Jensen-Doss, Youngstrom, Youngstrom, Feeny, & Findling, 2014). DLRs can be integrated easily with local BPSD base rates to give clinicians a sense of how much an individual’s diagnostic picture changes for a given score. Other psychometric data (such as factor analysis results and AUCs) are helpful for evaluating whether or not to use a measure, while DLRs help the clinician apply results to an individual case: an increase or decrease in risk in an individual depends on test scores. Using DLRs also reduces the effects of cognitive biases and heuristics (Jenkins et al., 2011).
Discriminative accuracy of the CASI-4R mania scale changed substantially depending on informant. Teachers do not appear to have the same opportunity to observe manic symptoms, or at least to judge them accurately as parents do. The teacher mania scores showed similar moderate elevations across the different diagnostic groups. This is in marked contrast to the greater accuracy of teachers in noting symptoms of ADHD, which the school situation usually tends to elicit more dramatically than the less demanding home situation. Perhaps, similar to Tourette’s Disorder, the school situation has a suppressing effect on manic symptoms that are more unrestrained at home. The poor discriminative performance of teacher report about manic symptoms has been a consistent finding across multiple measures and samples (Youngstrom et al., 2015; Youngstrom, Joseph, & Greene, 2008). At the same time, it is worthwhile for the clinician to inquire in cases where the parent and teacher report
A
uthor Man
uscr
ipt
A
uthor Man
uscr
ipt
A
uthor Man
uscr
ipt
A
uthor Man
uscr
diverge extemely: Disagreement can signal situationally specific problems, and cases where parent and teacher agree about the presence of manic symptoms tend to be substantially more impaired (Carlson & Youngstrom, 2003).
Clinical Application and Vignette
Because base rates of pediatric BPSD differ across clinical settings (Youngstrom, Freeman, & Jenkins, 2009), test results can contribute to accurate diagnosis by systematically assessing symptoms in a standardized fashion. DLRs help decrease false-positive diagnoses (Harrell, Califf, Pryor, Lee, & Rosati, 1982). Decreasing false-positive diagnoses is especially important in settings where BPSDs are uncommon (Jenkins et al., 2011). Taken together, the presentation of ROC analysis and DLRs make it easier for clinicians to use Bayesian methods to integrate test results with other risk factors, generating posterior probabilities (Jenkins et al., 2011; Straus et al., 2011). A clinical vignette illustrates this process:
Timothy, a 12 year-old Caucasian boy, was referred to a mood disorders clinic by his middle school counselor. The referring counselor describes Timothy as high energy and ready to go. His teachers describe him as always out of his seat, wandering the room, and talking extremely fast. His mother, Emily, describes Timothy at home as being increasingly restless. Emily is worried about her son because his father is diagnosed with bipolar I disorder. Timothy’s father takes lithium and he has responded well when adherent to medication. Emily completed the CASI-4R as part of Timothy’s intake battery; the mania scale raw score was 16.
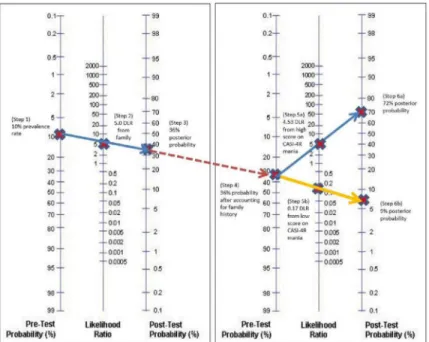
Probability nomograms can be used to estimate the likelihood an individual has a particular diagnosis, by combining information such as base rates, risk factors and test scores, through drawing lines across the nomogram. Using a probability nomogram (see Figure 2), we begin with a base rate for pediatric BPSD of 10%, which is consistent with the referral pattern at outpatient mood clinics (DelBello & Geller, 2001; Weintraub et al., 2014). Next, we incorporate the knowledge that Timothy’s father has a diagnosis of bipolar disorder, which increases Timothy’s risk of BPSD by about 5 times (Youngstrom et al., 2009). Drawing a straight line from the base rate through the number 5 gives us a posterior probability risk for BPSD of 35.7%. Next, we mark the new probability of 36% on the nomogram, and
incorporate the DLR of 4.53 associated with Timothy’s score of 16 on the CASI-4R mania subscale. Drawing a straight line from the base rate through the number 4.53 gives us a posterior probability risk of 71.6% of Timothy having a BPSD. Additional information sources would refine the posterior probability of a BPSD diagnosis. Our next step will be to confirm the diagnosis of a BPSD through a structured or semi-structured diagnostic interview, or adding prospective tracking of his mood and energy (Denicoff et al., 1997). Conversely, if Timothy had scored 4 on the CASI-4R mania subscale, it would offset the risk conferred by his family history. The posterior probability risk for BPSD given Timothy’s family history would still be 36%. When we apply Timothy’s low score of 4 with a corresponding DLR of 0.17, the risk is changed to a negligible 8.6%. If Timothy had a low score combined with a negative family history, he would have a revised probability of < 2%,
A
uthor Man
uscr
ipt
A
uthor Man
uscr
ipt
A
uthor Man
uscr
ipt
A
uthor Man
uscr
indicating that a diagnosis of pediatric BPSD is unlikely, and that other diagnostic hypotheses deserve greater consideration.
DLRs are not intended to be used in isolation to make a diagnosis, but they provide a signpost that clinicians can use to combat cognitive biases and heuristics. In a typical clinical scenario, in which a caregiver (parent or otherwise) brings a child in for assessment and treatment, the CASI-4R mania subscale will help the clinician to quickly estimate the likelihood of a BPSD versus the symptoms being due to ADHD or another disorder after inquiring for lifetime symptoms.
Though the CASI-4R mania subscale was found to have clinical utility in the current study, we note that the CASI-4R questionnaire is based on DSM-IV-TR criteria. The changes to the DSM-5 mania criteria (American Psychiatric Association, 2013) were minor in terms of impact on scale composition. The new criteria focus on disturbance of mood and energy, which does not require a new item, but rather a tweak of the interpretive algorithm to make energy change a required element. DSM-5 also dropped the word pleasurable from criterion B.7, “Excessive involvement in activities that have a high potential for painful
consequences.” Other than these minor changes, other symptom criteria remain the same. Therefore, it is unlikely that the statistical performance of the scale would change substantially.
We also note that the CASI-4R questionnaire does not include a specific time frame in the instructions (Circle which rating best describes your child’s overall behavior). While the time frame being lifetime and/or worst episode helps increase its sensitivity to screening for manic symptoms, it results in poorer specificity about the length and history of manic symptoms in youth. When following up after using the CASI-4R mania scale, clinicians should first inquire for lifetime symptoms (crucial to establishing a DSM diagnosis) and proceed to inquire about current manic symptoms (crucial to guiding acute intervention).
Strengths & Limitations
The LAMS sample is reasonably large and enriched for youth with manic symptoms although the majority do not have a bipolar spectrum diagnosis. Children frequently met criteria for multiple disorders, which makes the study more clinically generalizable. Initial sample selection based on a GBI-10M threshold entailed the use of weighting to ensure that results were not biased. With more resources, it would have been valuable to interview all low scorers rather than only following a subset. Second, the LAMS sample only included outpatient mental health centers that were associated with university partners. As such, the sample did not include children whose parents may have sought mental care from other types of settings, such as inpatient settings or private practices. Third, the LAMS sample had parent report as one of the main sources of information in the diagnostic interview. A recent meta-analysis (Youngstrom, Genzlinger, et al., 2015) suggested that interviews relying solely on caregivers produce artificially higher agreement with caregiver report on checklists (the Hedge’s g inflates by .6). While the LAMS protocol includes direct observation of youth, the results are still likely to be closer to parent-only results than to what we would find with adolescents. This limitation also generalizes to clinical practice, where diagnoses
A
uthor Man
uscr
ipt
A
uthor Man
uscr
ipt
A
uthor Man
uscr
ipt
A
uthor Man
uscr
are likely to be heavily informed by caregiver report. Last, the bulk of the sample was collected from the Midwest, which may make it less generalizable to the population at large.
Conclusion
This study investigated discriminative validity of the CASI-4R mania subscale for detecting BPSDs in youth and compared it against the PGBI-10M, an established screening tool for pediatric BPSDs. The CASI-4R is a broad assessment tool covering a range of diagnoses common in an outpatient setting. The broad nature of the CASI-4R makes it an appealing screening tool and inclusion of a mania subscale makes a strong case for including this instrument in an assessment battery rather than diagnosis-specific self-report scales.
Elevated scores on the CASI-4R mania subscale predict a higher posterior probability of pediatric BPSD and help clarify case conceptualization, particularly when integrated with other sources of information (such as base rate and family history). Similarly, low scores are helpful in predicting a decreased posterior probability of pediatric BPSD. Present results should encourage clinical practitioners to: (1) track local base rates of diagnoses and common presenting problems, as they could be combined with DLRs to generate a posterior probability estimate of the disorder for cases; (2) select assessment tools with demonstrated discriminative validity based on statistical tools such as ROC analyses and DLRs, and (3) have DLRs available along with interpretive tools, such as the probability nomogram (Youngstrom, 2014), probability calculator websites or apps. Taken together, these steps help clinicians reduce potential cognitive biases arising from deciding on a diagnosis based on clinical impressions (Jenkins et al., 2011).
Finally, when using a clinically meaningful comparison group, the CASI-4R mania subscale demonstrates good diagnostic accuracy, with an effect size similar to the best available established measure, the PGBI-10M. Given its combination of similar performance with simultaneous coverage of a broad range of other disorders, the CASI-4R appears to be a good alternative to the strategy of pairing another broad measure, such as the CBCL (Achenbach & Rescorla, 2001) or the SDQ with a mania measure such as the PGBI-10M (Youngstrom, Frazier, et al., 2008) after the clinician has ascertained the presence of lifetime symptoms0.
Acknowledgments
Funding: This study was funded in part by National Institutes of Health (grant number NIH R01 MH073967; PI: R.L. Findling).
This research was supported in part by NIH R01 MH073967 (Coordinating PI: R.L. Findling).
References
Achenbach, TM., Rescorla, LA. Manual for the ASEBA School-Age Forms & Profiles. Burlington, VT: University of Vermont; 2001.
American Psychiatric Association. Diagnostic and statistical manual of mental disorders. 4. 2000. text rev
American Psychiatric Association. Diagnostic and statistical manual of mental disorders: DSM-5. 5. Arlington, VA: American Psychiatric Publishing; 2013.
A
uthor Man
uscr
ipt
A
uthor Man
uscr
ipt
A
uthor Man
uscr
ipt
A
uthor Man
uscr
Axelson D, Birmaher B, Strober M, Gill MK, Valeri S, Chiappetta L, … Keller M. Phenomenology of children and adolescents with bipolar spectrum disorders. Archives of General Psychiatry. 2006; 63(10):1139. [PubMed: 17015816]
Carlson GA, Klein DN. How to understand divergent views on bipolar disorder in youth. Annual Review of Clinical Psychology. 2014; 10:529–551. DOI: 10.1146/annurev-clinpsy-032813-153702 Carlson GA, Youngstrom EA. Clinical implications of pervasive manic symptoms in children.
Biological Psychiatry. 2003; 53:1050–1058. [PubMed: 12788250]
Chilakamarri JK, Filkowski MM, Ghaemi SN. Misdiagnosis of bipolar disorder in children and adolescents: A comparison with ADHD and major depressive disorder. Annals of Clinical Psychiatry. 2011; 23:25–29. [PubMed: 21318193]
Conners, CK. Conners’ Rating Scales - Revised: Short Form. North Tonawanda, NY: Multi-Heath Systems; 1997.
DelBello MP, Geller B. Review of studies of child and adolescent offspring of bipolar parents. Bipolar Disorders. 2001; 3:325–334. DOI: 10.1034/j.1399-5618.2001.30607.x [PubMed: 11843782] Denicoff KD, Smith-Jackson EE, Disney ER, Suddath RL, Leverich GS, Post RM. Preliminary
evidence of the reliability and validity of the prospective life-chart methodology (LCM-p). Journal of Psychiatric Research. 1997; 31:593–603. [PubMed: 9368200]
Depue RA, Slater JF, Wolfstetter-Kausch H, Klein D, Goplerud E, Farr D. A behavioral paradigm for identifying persons at risk for bipolar depressive disorder: A conceptual framework and five validation studies. Journal of Abnormal Psychology. 1981; 90:381–437. DOI:
10.1037//0021-843X.90.5.381 [PubMed: 7298991]
Diler RS, Birmaher B, Axelson D, Goldstein B, Gill M, Strober M, … Keller MB. The Child Behavior Checklist (CBCL) and the CBCL-bipolar phenotype are not useful in diagnosing pediatric bipolar disorder. Journal of Child and Adolescent Psychopharmacology. 2009; 19:23–30. DOI: 10.1089/ cap.2008.067 [PubMed: 19232020]
Findling RL, Youngstrom EA, Fristad MA, Birmaher B, Kowatch RA, Arnold LE, … Horwitz SM. Characteristics of children with elevated symptoms of mania: the Longitudinal Assessment of Manic Symptoms (LAMS) study. Journal of Clinical Psychiatry. 2010; 71(12):1664–1672. DOI: 10.4088/JCP.09m05859yel [PubMed: 21034685]
Gadow KD, Drabick DA. Anger and irritability symptoms among youth with ODD: cross-informant versus source-exclusive syndromes. Journal of Abnormal Child Psychology. 2012; 40(7):1073– 1085. DOI: 10.1007/s10802-012-9637-4 [PubMed: 22581374]
Gadow, KD., Sprafkin, J. Child and Adolescent Symptom Inventory-4R. Stony Brook, NY: Checkmate Plus; 2005.
Gadow, KD., Sprafkin, J. Adolescent Symptom Inventory-4 screening and norms manual. Stony Brook, NY: Checkmate Plus; 2008.
Galanter CA, Leibenluft E. Frontiers between attention deficit hyperactivity disorder and bipolar disorder. Child and Adolescent Psychiatric Clinics of North America. 2008; 17:325–346. viii–ix. DOI: 10.1016/j.chc.2007.11.001 [PubMed: 18295149]
Geller B, Warner K, Williams M, Zimerman B. Prepubertal and young adolescent bipolarity versus ADHD: Assessment and validity using the WASH-U-KSADS, CBCL and TRF. Journal of Affective Disorders. 1998; 51:93–100. doi: dx.doi.org/10.1016/S0165. [PubMed: 10743842] Geller B, Zimerman B, Williams M, Bolhofner K, Craney JL, DelBello MP, Soutullo C. Reliability of
the Washington University in St. Louis Kiddie Schedule for Affective Disorders and Schizophrenia (WASH-U-KSADS) mania and rapid cycling sections. Journal of the American Academy of Child and Adolescent Psychiatry. 2001; 40(4):450–455. DOI: 10.1097/00004583-200104000-00014 [PubMed: 11314571]
Geller B, Zimerman B, Williams M, Delbello MP, Bolhofner K, Craney JL, … Nickelsburg MJ. DSM-IV mania symptoms in a prepubertal and early adolescent bipolar disorder phenotype compared to attention-deficit hyperactive and normal controls. Journal of Child and Adolescent
Psychopharmacology. 2002; 12:11–25. [PubMed: 12014591]
Ghaemi SN, Boiman EE, Goodwin FK. Kindling and second messengers: An approach to the neurobiology of recurrence in bipolar disorder. Biological Psychiatry. 1999; 45(2):137–144. doi:
dx.doi.org/10.1016/S0006-3223(98)00256-X. [PubMed: 9951560]
A
uthor Man
uscr
ipt
A
uthor Man
uscr
ipt
A
uthor Man
uscr
ipt
A
uthor Man
uscr
Goldstein TR, Ha W, Axelson DA, Goldstein BI, Liao F, Gill MK, … Birmaher B. Predictors of prospectively examined suicide attempts among youth with bipolar disorder. Archives of General Psychiatry. 2012; 69(11):1113–1122. DOI: 10.1001/archgenpsychiatry.2012.650 [PubMed: 22752079]
Goodman R. The Strengths and Difficulties Questionnaire: a research note. Journal of Child Psychology and Psychiatry. 1997; 38(5):581–586. [PubMed: 9255702]
Goodwin, FK., Jamison, KR. Manic-depressive illness: Bipolar disorders and recurrent depression. New York, NY: Oxford University Press; 2007.
Guyatt, GH., Rennie, D. Users’ guides to the medical literature. Chicago, IL: AMA Press; 2002. Harrell FE, Califf RM, Pryor DB, Lee KL, Rosati RA. Evaluating the yield of medical tests. JAMA.
1982; 247(18):2543–2546. DOI: 10.1001/jama.1982.03320430047030 [PubMed: 7069920] Henry DB, Pavuluri MN, Youngstrom EA, Birmaher B. Accuracy of brief and full forms of the Child
Mania Rating Scale. Journal of Clinical Psychology. 2008; 64(4):368–381. DOI: 10.1002/jclp. 20464 [PubMed: 18302291]
Hauser M, Galling B, Correll CU. Suicidal ideation and suicide attempts in children and adolescents with bipolar disorder: A systematic review of prevalence and incidence rates, correlates, and targeted interventions. Bipolar Disorders. 2013; 15:507–523. DOI: 10.1111/bdi.12094 [PubMed: 23829436]
Hirschfeld RM, Calabrese JR, Weissman MM, Reed M, Davies MA, Frye MA, … Wagner KD. Screening for bipolar disorder in the community. Journal of Clinical Psychiatry. 2003; 64(1):53– 59. DOI: 10.4088/JCP.v64n0111
Horwitz SM, Demeter CA, Pagano ME, Youngstrom EA, Fristad MA, Arnold LE, … Findling RL. Longitudinal Assessment of Manic Symptoms (LAMS) study: background, design, and initial screening results. Journal of Clinical Psychiatry. 2010; 71(11):1511–1517. DOI: 10.4088/JCP. 09m05835yel [PubMed: 21034684]
Hosmer, DW., Lemeshow, S. Applied logistic regression. New York: Wiley; 2000.
Jaeschke R, Guyatt GH, Sackett DL. Users’ guides to the medical literature. III. How to use an article about a diagnostic test. B. What are the results and will they help me in caring for my patients? JAMA. 1994; 271(9):703–707. DOI: 10.1001/jama.1994.03510290 [PubMed: 8309035] Jenkins MM, Youngstrom EA, Washburn JJ, Youngstrom JK. Evidence-based strategies improve
assessment of pediatric bipolar disorder by community practitioners. Professional Psychology: Research and Practice. 2011; 42:121–129.
Jensen-Doss A, Youngstrom EA, Youngstrom JK, Feeny NC, Findling RL. Predictors and moderators of agreement between clinical and research diagnoses for children and adolescents. Journal of Consulting and Clinical Psychology. 2014; 82(6):1151–1162. DOI: 10.1037/a0036657 [PubMed: 24773574]
Joseph M, Youngstrom EA, Soares JC. Antidepressant-coincident mania in children and adolescents treated with selective serotonin reuptake inhibitors. Future Neurology. 2009; 4(1):87–102. DOI: 10.2217/14796708.4.1.87 [PubMed: 19884978]
Kahana SY, Youngstrom EA, Findling RL, Calabrese JR. Employing parent, teacher, and youth self-report checklists in identifying pediatric bipolar spectrum disorders: An examination of diagnostic accuracy and clinical utility. Journal of Child and Adolescent Psychopharmacology. 2003; 13:471– 488. DOI: 10.1089/104454603322724869 [PubMed: 14977460]
Kaufman J, Birmaher B, Brent D, Rao U, Flynn C, Moreci P, … Ryan N. Schedule for Affective Disorders and Schizophrenia for School-Age Children-Present and Lifetime Version (K-SADS-PL): Initial reliability and validity data. Journal of the American Academy of Child and Adolescent Psychiatry. 1997; 36(7):980–988. DOI: 10.1097/00004583-199707000-00021 [PubMed: 9204677]
Marchand WR, Wirth L, Simon C. Delayed diagnosis of pediatric bipolar disorder in a community mental health setting. Journal of Psychiatric Practice. 2006; 12(2):128–133. DOI:
10.1097/00131746-200603000-00011 [PubMed: 16728912]
Miller CJ, Johnson SL, Kwapil TR, Carver CS. Three studies on self-report scales to detect bipolar disorder. Journal of Affective Disorders. 2011; 128(3):199–210. DOI: 10.1016/j.jad.2010.07.012 [PubMed: 20696479]
A
uthor Man
uscr
ipt
A
uthor Man
uscr
ipt
A
uthor Man
uscr
ipt
A
uthor Man
uscr
Obuchowski NA. Receiver operating characteristic curves and their use in radiology. Radiology. 2003; 229:3–8. doi: dx.doi.org/10.1148/radiol.2291010898. [PubMed: 14519861]
Pacchiarotti I, Bond DJ, Baldessarini RJ, Nolen WA, Grunze H, Licht RW, … Vieta E. The International Society for Bipolar Disorders (ISBD) Task Force Report on Antidepressant Use in Bipolar Disorders. American Journal of Psychiatry. 2013; 170(11):1249–1262. DOI: 10.1176/ appi.ajp.2013.13020185 [PubMed: 24030475]
Pliszka SR, Sherman JO, Barrow MV, Irick S. Affective disorder in juvenile offenders: A preliminary study. The American Journal of Psychiatry. 2000; 157(1):130–132. doi: http://dx.doi.org/10.1176/ ajp.157.1.130. [PubMed: 10618028]
R Development Core Team. A language and environment for statistical computing. Vienna, Austria: R Foundation for Statistical Computing; 2014. Retrieved from http://www.R-project.org
Robin X, Turck N, Hainard A, Tiberti N, Lisacek F, Sanchez JC, Muller M. pROC: An open-source package for R and S+ to analyze and compare ROC curves. BMC Bioinformatics. 2011; 12:77.doi: 10.1186/1471-2105-12-77 [PubMed: 21414208]
Sprafkin J, Gadow KD, Salisbury H, Schneider J, Loney J. Further evidence of reliability and validity of the Child Symptom Inventory-4: parent checklist in clinically referred boys. Journal of Clinical Child and Adolescent Psychology. 2002; 31(4):513–524. [PubMed: 12402570]
Sprafkin J, Steinberg E, Gadow KD, Drabick DA. Agreement among categorical, dimensional, and impairment criteria for ADHD and common comorbidities. Journal of Attention Disorders. 2013; : 1–13. DOI: 10.1177/1087054712475083
Stewart AJ, Theodore-Oklota C, Hadley W, Brown LK, Donenberg G, DiClemente R, Project SSG. Mania symptoms and HIV-risk behavior among adolescents in mental health treatment. Journal of Clinical Child and Adolescent Psychology. 2012; 41(6):803–810. DOI:
10.1080/15374416.2012.675569 [PubMed: 22540428]
Straus, SE., Glasziou, P., Richardson, WS., Haynes, RB. Evidence-based medicine: How to practice and teach evidence-based medicine. Edinburgh: Elsevier; 2011.
Swets JA, Dawes RM, Monahan J. Better decisions through science. Scientific American. 2000; 283(4):82–87. DOI: 10.1038/scientificamerican1000-82
Van Meter A, You DS, Halverson T, Youngstrom EA, Birmaher B, Fristad MA, Kowatch RA, Horwitz SM, Frazier TW, Arnold LE, Findling RL. the LAMS Group. Diagnostic efficiency of caregiver report on the SCARED for identifying youth anxiety disorders in outpatient settings. Journal of Clinical Child and Adolescent Psychology. (in press).
Van Meter AR, Moreira AL, Youngstrom EA. Meta-analysis of epidemiologic studies of pediatric bipolar disorder. Journal of Clinical Psychiatry. 2011; 72(9):1250–1256. DOI: 10.4088/JCP. 10m06290 [PubMed: 21672501]
Venkatraman ES. A permutation test to compare receiver operating characteristic curves. Biometrics. 2000; 56(4):1134–1138. DOI: 10.1111/j.0006-341X.2000.01134.x [PubMed: 11129471]
Wagner KD, Hirschfeld RM, Emslie GJ, Findling RL, Gracious BL, Reed ML. Validation of the Mood Disorder Questionnaire for bipolar disorders in adolescents. Journal of Clinical Psychiatry. 2006; 67(5):827–830. DOI: 10.4088/JCP.v67n0518 [PubMed: 16841633]
Weintraub M, Youngstrom EA, Marvin SE, Podell JL, Walshaw PD, Kim EY, … Miklowitz DJ. Diagnostic profiles and clinical characteristics of youth referred to a pediatric mood disorders clinic. Journal of Psychiatric Practice. 2014; 20(2):154–162. DOI: 10.1097/01.pra.
0000445251.20875.47 [PubMed: 24638051]
Youngstrom EA. A primer on receiver operating characteristic analysis and diagnostic efficiency statistics for pediatric psychology: We are ready to ROC. Journal of Pediatric Psychology. 2014; doi: 10.1093/jpepsy/jst062
Youngstrom, EA., Choukas-Bradley, S., Calhoun, CD., Jensen-Doss, A. Clinical guide to the evidence-based assessment approach to diagnosis and treatment. Cognitive and Behavioral Practice. 2014. doi: http://dx.doi.org/10.1016/j.cbpra.2013.12.005
Youngstrom EA, Findling RL, Calabrese JR, Gracious BL, Demeter C, Bedoya DD, Price M. Comparing the diagnostic accuracy of six potential screening instruments for bipolar disorder in youths aged 5 to 17 years. Journal of the American Academy of Child and Adolescent Psychiatry.
A
uthor Man
uscr
ipt
A
uthor Man
uscr
ipt
A
uthor Man
uscr
ipt
A
uthor Man
uscr
2004; 43(7):847–858. doi: http://dx.doi.org/10.1097/01.chi.0000125091.35109.1e. [PubMed: 15213586]
Youngstrom EA, Findling RL, Danielson CK, Calabrese JR. Discriminative validity of parent report of hypomanic and depressive symptoms on the General Behavior Inventory. Psychological
Assessment. 2001; 13(2):267–276. doi: http://psycnet.apa.org/doi/10.1037/1040-3590.13.2.267. [PubMed: 11433802]
Youngstrom EA, Frazier TW, Demeter C, Calabrese JR, Findling RL. Developing a 10-item mania scale from the Parent General Behavior Inventory for children and adolescents. Journal of Clinical Psychiatry. 2008; 69(5):831–839. DOI: 10.4088/JCP.v69n0517 [PubMed: 18452343]
Youngstrom EA, Freeman AJ, Jenkins MM. The assessment of children and adolescents with bipolar disorder. Child & Adolescent Psychiatric Clinics of North America. 2009; 18(2):353–390. viii–ix. DOI: 10.1016/j.chc.2008.12.002 [PubMed: 19264268]
Youngstrom EA, Genzlinger J, Egerton G, Van Meter AR. Multivariate meta-analysis of the discriminative validity of caregiver, youth and teacher rating scales for pediatric bipolar disorder: Mother knows best about mania. Archives of Scientific Psychology. 2015; 3(1):112–137. http:// dx.doi.org/10.1037/arc0000024.
Youngstrom EA, Jenkins MM, Jensen-Doss A, Youngstrom JK. Evidence-based assessment strategies for pediatric bipolar disorder. Israel Journal of Psychiatry & Related Sciences. 2012; 49:15–27. [PubMed: 22652926]
Youngstrom EA, Joseph MF, Greene J. Comparing the psychometric properties of multiple teacher report instruments as predictors of bipolar disorder in children and adolescents. Journal of Clinical Psychology. 2008; 64:382–401. DOI: 10.1002/jclp.20462 [PubMed: 18300293]
Youngstrom EA, Meyers O, Demeter C, Youngstrom JK, Morello L, Piiparinen R, … Findling RL. Comparing diagnostic checklists for pediatric bipolar disorder in academic and community mental health settings. Bipolar Disorders. 2005; 7:507–517. DOI: 10.1111/j.1399-5618.2005.00269.x [PubMed: 16403176]
Youngstrom EA, Meyers O, Youngstrom JK, Calabrese JR, Findling RL. Comparing the effects of sampling designs on the diagnostic accuracy of eight promising screening algorithms for pediatric bipolar disorder. Biological Psychiatry. 2006; 60(9):1013–1019. DOI: 10.1016/j.biopsych. 2006.06.023 [PubMed: 17056395]
Zhou, X., Obuchowski, NA., McClish, DK. Statistical methods in diagnostic medicine. Hoboken, NJ: Wiley; 2011.
A
uthor Man
uscr
ipt
A
uthor Man
uscr
ipt
A
uthor Man
uscr
ipt
A
uthor Man
uscr
Figure 1.
Receiver operating characteristic analyses comparing baseline CASI-4R mania subscale parent report, CASI-4R mania subscale teacher report, and PGBI-10M.
A
uthor Man
uscr
ipt
A
uthor Man
uscr
ipt
A
uthor Man
uscr
ipt
A
uthor Man
uscr
Figure 2. Using a probability nomogram to interpret scores on the CASI-4R mania subscale
Note. Timothy is a 12 year-old Caucasian boy referred due to high energy, restlessness, irritable mood, and aggressive behavior. According to his mother, the biological father has bipolar I disorder. Mom completed the CASI-4R mania subscale, yielding score of 16, which is in the High Risk range.
Steps in using the nomogram (adapted from Strauss, Richardson, Glasziou & Haynes, 2011):
(1) Select the pre-test probability (usually base rate of disorder) and mark on the first vertical line from the left. In this example, assume that the base rate of pediatric bipolar disorder is 10%. To find base rates that correspond to your clinical setting, refer to online resources, such as an online assessment portfolio, found here.
(2) Find the diagnostic likelihood ratio (DLR) associated with the risk factor and plot on the second vertical line. In this example, bipolar disorder in a first degree relative (e.g. father, mother, or full sibling) has a DLR of 5.0 (Youngstrom, Freeman, & Jenkins, 2009).
(3) Connect the dots from (1) and (2), and extend across the third line to find a post-test probability estimate of 36%.
(4) To add new information, repeat the process by using information from step (3) as the new starting point (shown via dotted lines).
(5a) High risk scenario: A raw score of 16 on the CASI-4R mania subscale maps onto High Risk, which has a DLR of 4.53 (see Table 2).
(6a) Connect the dots from (4) and (5a) to find a post-test probability of 72%. You can also multiply the DLRs together and map them onto one nomogram (e.g. 4.53 * 5 referring to example above).
A
uthor Man
uscr
ipt
A
uthor Man
uscr
ipt
A
uthor Man
uscr
ipt
A
uthor Man
uscr
(5b) Alternate, low risk scenario: If the raw score on the CASI had be a 4 instead of a 16, that would be in the low-risk stratum, and the DLR would be 0.17. This would get plotted on the middle line of the nomogram.
(6b) Connecting the dots from (4) and (5b) would yield a post-test probability of 9%. This illustrates that the CASI is capable of moving cases with moderate risk, due to family history, back into low probabilities or up into moderately elevated ranges, but not high enough to initiate treatment for bipolar without additional clinical information.