Rho GTPase Dynamics in the Regulation of Cellular Signaling and Migration
Christopher M. Welch
A dissertation submitted to the faculty of the University of North Carolina at Chapel Hill in partial fulfillment of the requirements for the degree of Doctor of
Philosophy in the Department of Pharmacology
Chapel Hill 2011
©2011
ABSTRACT
CHRISTOPHER MICHAEL WELCH: Rho GTPase Dynamics in the Regulation of Cellular Signaling and Migration
(Under the direction of Dr. Klaus M. Hahn)
Cell migration is critical to the development and maintenance of higher
organisms, and is required for the patterning of the nervous system, for the development of organs, and for responses to wounds or sites of inflammation. Because cell migration is so widely utilized, it must be very tightly controlled, as is apparent when the process goes awry, such as in cancer cell metastasis or chronic inflammation.
Growth factors and other cues mediate the activation of a variety of pathways that induce cell migration. Despite these many pathways, a family of proteins called Rho GTPases are universally engaged to cause changes in the cellular cytoskeleton, leading to cell migration. Because Rho GTPases are so critical to cell migration, yet can be used to mediate many different types of cellular responses, they must be precisely controlled. In most cases, it is the timing and placement of Rho GTPase activity that defines cellular behaviors in response to specific signals. However, tools to investigate the
Cdc42 at the leading edge of migrating cells, and the role of RhoG in its ability to precisely position and activate Rac1 at the leading edge of cells. This work provides the first thorough characterization of the roles of these GTPases at the leading edge relative to one another and the mechanisms by which they are regulated. This work also
demonstrates preliminary studies on the roles of these GTPases during leukocyte transendothelial migration.
It is critical to gain an understanding of the mechanisms by which cells control cell migration via the Rho GTPases. Aberrant signaling through the GTPases leads to a variety of disease processes. Thus, a better understanding of normal Rho GTPase
ACKNOWLEDGEMENTS
Never in the work that I will describe in this thesis have I worked alone. Without those who have taught me, encouraged me, corrected me, and loved me, none of this work would have been possible. First, I would like to thank my advisor, Dr. Klaus Hahn. Dr. Hahn has graciously given me the support I needed to pursue my work and freedom to explore a variety of scientific questions, which have greatly improved my scientific abilities. His instruction and guidance have been vital in my development as an experimentalist and scientist, and for this I am thankful. Additionally, I would like to thank my co-mentor, Dr. Keith Burridge, for involving me in his laboratory. Through interactions with his group and him, I have gained invaluable biological perspectives, and a number of these projects in this dissertation have been the result of working directly with members of his laboratory.
I would also like to thank the advice and support from the rest of my thesis committee members, Drs. Adrienne Cox, David Siderovski, Ken Jacobson, and Terri Tarrant. Through their unique points-of-view, each of the members has taught me about the myriad ways to ask scientific questions, and they have all shown me where my weaknesses lie, helping me to address them and improve them, for which I am grateful.
training me when I joined the lab. I also want to thank Dr. Thomas Samson for working closely with me on many aspects of RhoG regulation over the past three years; I have learned much from him and feel that our work has been greatly enhanced by this relationship.
I would like to thank my family for their continued support, encouragement, and love that they have given me throughout my life, making me who I am today. I am so thankful for my wife, Erin, who loves and supports me unconditionally. Your love and encouragement mean more to me than I can ever express in simple words; thank you for sharing your life with me.
PREFACE
Parts of Chapters Three and Five of this dissertation have been previously published. Authorship rights to the following articles remain with the authors and thus these articles can be reproduced here in a modified format, as provided by Nature, the Journal of Cell Biology, and the American Society for Cell Biology:
Machacek, M.*, Hodgson, L.*, Welch, C.M.*, Elliott, H., Pertz, O., Shen, F., Abell, A., Johnson, G.L., Hahn, K.M., Danuser, G. (2009) Coordination of Rho GTPase activities during cell protrusion. Nature. 2009 Sep 3;461(7260):99-103.
Koivusalo M, Welch C, Hayashi H, Scott CC, Kim M, Alexander T, Touret N, Hahn KM, Grinstein S. Amiloride inhibits macropinocytosis by lowering
submembranous pH and preventing Rac1 and Cdc42 signaling. J Cell Biol. 2010 Feb 22;188(4):547-63.
TABLE OF CONTENTS
LIST OF TABLES ... xvii
LIST OF FIGURES ... xviii
LIST OF ABBREVIATIONS ... xxi
CHAPTER ONE: INTRODUCTION ... 1
1.1 Introduction to Cell Migration ... 1
A Historical Perspective: ... 1
The Role of Cell Migration in Development, Homeostasis, and Disease: ... 4
1.2 Overview of Signaling Pathways Involved in Regulating Cell Migration ... 8
Rho GTPases as Coordinators of Cell Migration: ... 8
Signaling Pathways Leading to Cellular Morphological Polarization: ... 10
Signaling Pathways Regulating Lamellipodium Formation:... 11
Signaling Pathways Involved in the Stabilization of Extended Lamellipodia: ... 13
Signaling Pathways Involved with Retraction of the Cell Tail with Body Translocation: ... 14
Specific Role of RhoG Signaling in Cell Migration: ... 15
Conclusion: ... 17
1.3 Introduction to Growth Factor Signaling and the Regulation of Cytoskeletal Dynamics: ... 19
A Broader Perspective: ... 19
EGF Signaling in the Regulation of Macropinocytosis: ... 21
1.4 Overview of Fluorescent Biosensors for Protein Activity ... 24
Introduction: ... 24
Development of Fluorescent Proteins and Chemical Dyes: ... 25
Biosensors for Monitoring Protein Movement and Translocation: ... 26
FRET-Based Biosensor Design and Usage: ... 27
FRET-Based Biosensors for the Rho GTPases: ... 30
Selection of Fluorescent Proteins for Optimal FRET: ... 30
Current Approaches and Challenges to Studying Intracellular Signaling by Imaging: ... 34
Appropriate Probe Use and the Potential for Perturbation of Signaling Dynamics: ... 37
1.5 An Introduction to Leukocyte Transendothelial Migration ... 40
Inflammation and Endothelial Adhesion Molecules in the Pathogenesis of Disease: ... 40
Adhesion Molecules and the Initiation of Signaling Events during Leukocyte TEM: ... 41
Endothelial Cell Signaling During TEM: ... 43
Therapeutic Strategies in Inflammatory Diseases: ... 45
1.6 Figures and Legends ... 48
CHAPTER TWO: RATIONAL DESIGN AND DEVEOPMENT OF RHO GTPASE BIOSENSORS FOR LIVE CELL IMAGING ... 68
2.1 Abstract ... 68
2.2 Introduction ... 69
Comparison of Usage of Intramolecular and Intermolecular Rho GTPase
FRET Biosensor Designs: ... 71
2.3 Results ... 74
Comparison of Sensitivity and Cellular Perturbation with Intramolecular and Intermolecular GTPase Activity FRET Sensors: ... 74
Comparison of Sensitivity and Cellular Perturbation with Intramolecular and Intermolecular GTPase Activity FRET Sensors: ... 77
Comparison of C-terminal Modifications in GTPase Activity FRET Sensors: ... 79
Rational Development and Improvement of Intramolecular and Intermolecular GTPase Activity FRET Sensors: ... 80
Generation of Orthogonal Red-Shifted FRET Probes for Use with CFP/YFP FRET Probes: ... 82
Generation of a Novel Expression Cassette for Dual-Chain FRET Sensors:... 84
2.4 Discussion ... 86
Development of New and Updated Rho GTPase Biosensors: ... 86
Artefacts Inherent to Biosensor Imaging: ... 87
Overcoming Hurdles to the Use of Dual-Chain Sensors: ... 89
Concluding Remarks: ... 89
2.5 Materials and Methods ... 91
Materials and Reagents: ... 91
Cell Culture and Constructs: ... 91
Generation of Stable Cell Lines: ... 95
Fluorometry Assays for Validation of RhoA, Rac1, and Cdc42 Biosensors: ... 95
Rac1, RhoG, and RhoA Adherent Cell Activity Assays: ... 97
Confocal Imaging: ... 100
Biochemical Measurement of Biosensor Perturbation of Downstream Signaling: ... 101
2.6 Acknowledgments ... 102
2.7 Figures and Legends ... 103
CHAPTER THREE: RHOA, RAC1, AND CDC42 GTPASE DYNAMICS AT THE CELLULAR LEADING EDGE ... 123
3.1 Abstract ... 123
3.2 Introduction ... 125
3.3 Results and Discussion ... 129
Computational Multiplexing of Rho GTPase Activities at the Leading Edge: ... 129
Role of RhoA Regulation by TEM4 at the Leading Edge: ... 139
Role of Cdc42 Regulation by the GAP MILO at the Leading Edge: ... 141
Role of MILO in Regulating Cdc42 Activation Status: ... 144
3.4 Materials and Methods ... 146
Expression Constructs and Reagents: ... 146
Cell Culture, Transient Transfections, and siRNA Transfection: ... 147
Lentivirus Production and Cellular Transduction: ... 148
TEM4 RNA Interference: ... 148
Biosensor Designs: ... 149
Production of the Intermolecular FRET RhoA and Cdc42 Biosensors: ... 150
Fluorometry Assays of GAP Activity on Cdc42 Activation: ... 152
Induction of Filopodia During Imaging: ... 153
Cell Edge Tracking: ... 159
Tracking of Sampling Windows at Constant Distance to the Cell Edge: ... 159
Cross-Correlation Analysis: ... 160
3.5 Acknowledgements ... 162
3.6 Figures and Legends ... 163
CHAPTER FOUR: ROLE OF RHOG IN CELL MIGRATION ... 180
4.1 Abstract ... 180
4.2 Introduction ... 181
4.3 Results ... 185
Spatio-temporal Dynamics of RhoG and Rac1 Activity at the Leading Edge of Motile Cells: ... 185
RhoG is Targeted to the Leading Edge by Endosomal Recycling and Regulated by RhoGDI-3: ... 188
RhoG Regulates the Spatio-temporal Dynamics of Rac1 Activity in Protrusions: ... 190
RhoG Regulates Adhesion and Actin Dynamics at the Leading Edge:... 192
RhoG Plays a Role in Protrusion Formation and Determining the Frequency and Direction of Cell Turning: ... 194
4.4 Discussion and Ongoing Studies ... 199
RhoG is Activated at the Leading Edge during Protrusion: ... 199
RhoG Activity is Regulated by Trafficking and RhoGDI-3: ... 200
RhoG Activity Coordinates the Local Activation of Lamellipodial Rac1: ... 201
RhoG Regulates the Ability of Cells to Turn during Random Migration: ... 202
Small GTPase Signaling in the Regulation of Directed Cell Migration: ... 204
4.5 Materials and Methods ... 208
Expression Constructs and Antibodies: ... 208
Cell Culture and Transient Transfections: ... 209
siRNA Sequences: ... 210
RT-PCR: ... 210
Biochemical Measurement of RhoG and Rac1 Activity: ... 211
Actin Barbed End Assay: ... 211
Rho GTPase Activity Biosensors: ... 212
TIRF Microscopy: ... 213
Live Cell Imaging for FRET Acquisition and FRET Ratiometric Corrections: ... 213
Dual-Camera FRET Imaging: ... 216
Whole-Cell FRET Analysis: ... 216
Single Cell Tracking and Kymography Analysis: ... 217
Imaging and Quantitation of Focal Adhesion Dynamics: ... 218
Linescan Analysis of Protrusional Rac1 Activity: ... 219
Rac1 Activity “Spot” Analysis: ... 220
RhoGTPase Activity Correlation Analysis: ... 220
3-D Migration Assay: ... 221
Cell-Tracking and Cell-Track Modeling: ... 222
Rac1 and RhoG Activity Polarity Analysis: ... 225
Statistical Analysis: ... 226
4.6 Acknowledgments ... 227
CHAPTER FIVE: ACTIVATION OF RHO GTPASES BY GROWTH
FACTORS ... 260
5.1 Abstract ... 260
5.2 Introduction ... 262
Regulation of RhoG Signaling: ... 262
Unique Properties of Signaling during Macropinocytosis: ... 264
Functional Relationship between Macropinocytosis and Na+/H+ Exchange: ... 266
5.3 Results and Discussion ... 269
EGF Induces Rapid Activation of RhoG: ... 269
Identification of GEFs Mediating the Rapid Activation of RhoG: ... 270
Involvement of PLEKHG6 in Rapid Activation of RhoG in A431 Cells: ... 271
Role of pH in the Regulation of Rho GTPases during Macropinocytosis: ... 275
5.4 Materials and Methods ... 280
Materials and Reagents: ... 280
Cells, Media, Transfection and Growth Factor Stimulation: ... 280
Plasmids and Expression Constructs: ... 281
Rac1 and Cdc42 Activity Assays ... 282
Imaging the Activity of One Rho GTPase per Cell: ... 283
5.5 Acknowledgments ... 286
5.6 Figures and Legends ... 287
CHAPTER SIX: ROLE OF RHO GTPASES IN TRANSENDOTHELIAL MIGRATION ... 292
6.1 Abstract ... 292
Transmigratory Cup Composition: ... 294
Transmigratory Cup and TEM Signaling Pathways: ... 295
6.3 Results ... 297
Establishment of a Model System for Studying ICAM-1 Ligation and Downstream Signaling: ... 297
Examining Rac1 Activity Downstream of ICAM-1 Ligation: ... 298
Examining RhoA Activity Downstream of ICAM-1 Ligation: ... 299
Examining RhoA Activity Downstream of Applied Mechanical Force: ... 301
Examining RhoG Activity Downstream of ICAM-1 Ligation: ... 303
6.4 Discussion and Ongoing Studies ... 306
6.5 Materials and Methods ... 309
Materials and Reagents: ... 309
Cell Culture and Constructs: ... 309
Antibody Conjugation to Beads: ... 311
Magnetic Bead Force Application: ... 312
Rac1, RhoG, and RhoA Activity Assays: ... 312
Imaging the Activity of One Rho GTPase per Cell: ... 312
Disk-spinning Confocal Imaging and 3-D Deconvolution: ... 315
6.6 Acknowledgments ... 316
6.7 Figures and Legends ... 317
CHAPTER SEVEN: DISCUSSION, CLINICAL RELEVANCE, AND FUTURE DIRECTIONS ... 327
Coordination of the Spatiotemporal Dynamics of Rho GTPases during
Cell Migration: ... 329
Role of RhoG in Cell Migration: ... 331
Regulation of Rho GTPase Dynamics in Response to Growth Factors: ... 331
Role of Rho GTPases in Transendothelial Migration: ... 332
7.2 Clinical Relevance ... 333
Role of Rho GTPases in Cancer: ... 333
Role of Rho GTPases in Inflammatory Signaling: ... 336
Imaging Probes for in vivo Detection of Aberrant Signaling: ... 338
7.3 Long-term Directions ... 340
Large-scale Analysis of GTPase Regulators During Random Cell Migration: ... 340
Regulation of RhoG in Cell Migration: ... 343
Rho GTPases in Leukocyte Transendothelial Migration: ... 345
7.4 Concluding Remarks ... 347
LIST OF TABLES
LIST OF FIGURES
Figure 1.1: Rho Family of Small GTPases. ... 48
Figure 1.2: Distinct Steps in the Cell Migration Cycle. ... 50
Figure 1.3: Combinatorial Nature of Growth Factor Signaling Networks. ... 51
Figure 1.4: Regulation of Rho GTPases Downstream of Growth Factors. ... 54
Figure 1.5: Common Designs for Intracellular Signaling Probes. ... 56
Figure 1.6: Spectra of Fluorophores Used in Ratiometric FRET Multiplex Experiments. ... 58
Figure 1.7: Leukocyte Adhesion and Signaling Cascade. ... 60
Figure 1.8: Proximal Signaling Events in the Endothelium Leading to Formation of Endothelial Docking Structures Induced Upon Firm Adhesion of Leukocytes via ICAM-1. ... 62
Figure 2.1: Comparison of FRET Signal Measurement in Intramolecular and Intermolecular GTPase Activity FRET Sensors. ... 103
Figure 2.2: Comparison of Sensitivity of Intramolecular and Intermolecular GTPase Activity FRET Sensors. ... 105
Figure 2.3: Comparison of C-terminal Modifications in GTPase Activity FRET Sensors. ... 107
Figure 2.4: Rational Development and Improvement of Intramolecular and Intermolecular GTPase Activity FRET Sensors. ... 109
Figure 2.5: Generation of Orthogonal Red-Shifted FRET Probes for use with CFP/YFP FRET Probes. ... 112
Figure 2.6: Generation of a Novel Expression Cassette for Dual-Chain FRET Sensors. ... 114
Supplemental Figure 2.2, Related to Figure 2.2: Analysis of Perturbation of Downstream Signaling by Overexpression of Intramolecular and Intermolecular Rho GTPase FRET Biosensors. ... 119
Figure 3.1: Activation of Rho GTPases in Migrating Mouse Embryonic
Fibroblasts. ... 163
Figure 3.2: Designs of the Biosensors Used. ... 165
Figure 3.3: Effect of Biosensor Component Concentrations on the Measured Rac1-Protrusion Correlation. ... 167
Figure 3.4: Relationship Between RhoA and Protrusion/Retraction Determined by an Intermolecular Biosensor. ... 169
Figure 3.5: Spatiotemporal Coordination of Rac1, Cdc42, and RhoA Activation. ... 171
Figure 3.6: TEM4 Activates RhoC during Microtubular Depolymerization. ... 173
Figure 3.7: Cdc42 Dynamics in TNF-Stimulated Filopodium Formation. ... 176
Figure 3.8: Effects of MILO GAP Activity on Cdc42 Activation Globally and within Filopodia. ... 178
Figure 4.1: Localization and Timing of RhoG Activation at the Leading Edge of Motile Cells. ... 228
Figure 4.2: RhoG is Targeted to the Leading Edge by Endosomal Recycling and is Regulated by RhoGDI-3. ... 231
Figure 4.3: RhoG Regulates the Spatio-temporal Dynamics of Rac1 Activity in Protrusions. ... 234
Figure 4.4: RhoG Regulates Adhesion Dynamics at the Leading Edge. ... 237
Figure 4.5: RhoG Regulates Actin and Protrusion Dynamics at the Leading Edge. ... 240
Figure 4.6: RhoG Regulates Cell Migration Behaviors on 2-D and 3-D Substrates. ... 242
Figure 4.7: Model for the Regulation of Lamellipodial Rac1 Activity by RhoG. ... 245
Supplemental Figure S4.1, Related to Figure 4.1: Validation of a RhoG Activity Biosensor and Observed Activity at the Leading Edge. ... 247
Supplemental Figure S4.2, Related to Figure 4.2: Vesicular RhoG Localization and Trafficking and its Regulation by RhoGDI-3. ... 250
Supplemental Figure S4.4, Related to Figure 4.4: Effects of RhoG Manipulation
on Rac1 Activity at the Ventral Cellular Surface and Adhesion Dynamics. ... 254
Supplemental Figure S4.5, Related to Figure 4.5: RhoG Regulates Retraction Velocities in Migrating Cells. ... 256
Supplemental Figure S4.6, Related to Figure 4.6: RhoG Modulation of Rac1 Activity Regulates Random Cell Migration Patterns. ... 258
Figure 5.1: RhoG and PLEKHG6 are Required for Dorsal Ruffle Formation in A431 cells after EGF Stimulation. ... 288
Figure 5.2: Effect of pH on Activation of Rac1 and Cdc42. ... 290
Figure 6.1: Establishment of a Model System for Studying ICAM-1 Ligation and Downstream Signaling. ... 317
Figure 6.2: Rac1 Activation Downstream of ICAM-1 Ligation. ... 319
Figure 6.3: RhoA Inactivation Downstream of ICAM-1 Ligation. ... 321
Figure 6.4: RhoA Activation Downstream of Applied Mechanical Force. ... 323
LIST OF ABBREVIATIONS t: Change in Time
2D: Two-dimensional 3D: Three-dimensional
aPKC: Atypical Protein Kinase C Ar/Kr: Argon/Krypton
Arf6: ADP-ribosylation Factor 6
ARNO: Cytohesin-2/ARF Nucleotide Binding-site Opener Arp2/3: Actin-Related Proteins 2 and 3
BAEC: Bovine Aortic Endothelial Cells
BAI-1: Brain-specific Angiogenesis Inhibitor 1 BDNF: Brain-derived Neurotrophic Factor
-Pix: p21-activated Kinase [Pak]-interacting Exchange Factor
BiFC: Bimolecular Fluorescence Complementation BSA: Bovine Serum Albumin
Ca2+: Calcium Ion
CAAX: Cysteine Aliphatic Aliphatic Any CAM: Cellular Adhesion Molecule
CaMKII: Calmodulin Kinase II
cAMP: Cyclic Adenosine Monophosphate CBD: WASP Cdc42 Binding Domain CCD: Charge-coupled Device
CED-10: Cell Death Abnormality, Protein 10 CFP: Cyan Fluorescent Protein
cGMP: Cyclic Guanosine Monophosphate CMV: Cytomegalovirus
CRIB: Cdc42/Rac1 Interactive Binding
CtBP/BARS: C-terminal Binding Protein/Brefeldin A-ADP Ribosylated Substrate CyPet: Cyan Fluorescent Protein for Energy Transfer
D: Distance
D-TOPO: directional topoisomerase Dbl: Diffuse B-Cell Lymphoma GEF DCX: Doublecortin (DCX)
DH: Dbl Homology
DIC: Differential Interference Contrast DMEM: Dulbecco's Modified Eagle Medium DNA: Deoxyribonucleic Acid
dNTP: Deoxynucleotide Triphosphate Dock180: Dedicator of Cytokinesis
DPBS: Dulbecco's Phosphate Buffered Saline DsRed: Discosoma Red Fluorescent Protein EGF: Epidermal Growth Factor
EGM-2: Endothelial Growth Medium 2 EIPA: Ethylisopropylamiloride
ErbB: Erythroblastic Leukemia Viral Oncogene ESAM: Endothelial Cell-selective Adhesion Molecule FA: Focal Adhesion
FACs - Fluorescence Activated Cell Sorting FAK: Focal Adhesion Kinase
FBS: Fetal Bovine Serum
FCS: Fluorescence Correlation Spectroscopy FGF: Fibroblast Growth Factor
FLIM: Fluorescence Lifetime Microscopy FRET: Fluorescence Resonance Energy Transfer GAP: GTPase Activating Protein
GBD: ELMO1 RhoG Binding Domain GDI: Guanine Dissociation Inhibitor GEF: Guanine Nucleotide Exchange Factor GFP: Green Fluorescent Protein
GPCR: G-protein Coupled Receptor
Grb2: Growth Factor Receptor-bound Protein 2 GS: Glycine Serine
GTP: Guanosine Triphosphate GTPase: Guanosine Triphosphatase H: Hours
HEPES: 4-(2-hydroxyethyl)-1-piperazineethanesulfonic Acid Hg: Mercury
HOE-694: (3-methylsulphonyl-4-piperidinobenzoyl)guanidine Methanesulphonate HQ: High Quality
HUVEC: Human Umbilical Vein Endothelial Cells ICAM-1: Intracellular Adhesion Molecule 1
IgG: Immunoglobulin G
IQGAP: IQ Motif-containing GTPase Activating Protein IRSp53: Insulin Receptor Tyrosine Kinase Substrate p53
ITLGMDELYK: Isoleucine Threonin Leucine Glycine Methionine Glutamic Acid Leucine Tyrosine Lysine
JAM: Junctional Adhesion Molecule KD: Knockdown
kDa: Kilodalton
LARG: Leukemia Associated Rho GEF
LDEV: Lactose Dehydrogenase-Elevating Virus LFA-1: Lymphocyte Function-associated Antigen 1 LPA: Lysophosphatidic Acid
M199: Medium 199
MAC1: Macrophage Antigen 1
MADCAM1: Mucosal Vascular Addressin Cell-adhesion Molecule 1 MAPK: Mitogen Activated Protein Kinase
MEF: Mouse Embryonic Fibroblast
MeroCBD: CBD (see above) Labeled with Merocyanine Dye MgCl2: Magnesium Chloride
Mig-2: Abnormal Cell Migration, Protein 2
MILO: Mdia Interactor in fiLOpodia or Mammalian vIlse homoLOgue min: minutes
mKO: Monomeric Kusabira Orange MLK3: Mixed Lineage Kinase 3
MMP-MT1: Membrane Type 1 Metalloprotease N: Number
NaCl: Sodium Chloride NF-B: Nuclear Factor B
NHE: Na+/H+ Exchangers
NIH: National Institutes of Health NO: Nitric Oxide
Opti-MEM: Optimum Modified Eagle's Medium pAd-DEST: Adenoviral Destination plasmid PAK: p21-Activated Kinase
Par3: Partioning Defective Protein 3 Par6: Partitioning Defective Protein 6
PBD: p21 Activated Kinase Rac1 Binding Domain PCR: Polymerase Chain Reaction
PECAM1: Platelet/endothelial-cell Adhesion Molecule 1 PH: Pleckstrin Homology
pH: Concentration of Hydrogen Ions PI3K: Phosphatidylinositol-3 kinase
PIP3: Phosphatidyl Inositol (3,4,5)Phosphate3 PIP2: Phosphatidyl Inositol (4,5)Phosphate2 PKC: Protein Kinase C
PKA: Protein Kinase A PLA2: Phospholipase A2 PLC: Phospholipase C PLD: Phospholipase D
PLEKHG6: Pleckstrin Homology Domain Containing, Family G Member 6 PMSF: Phenylmethanesulfonylfluoride
Por-1: Mitochondrial Porin 1 POSH: Plenty of SH3s
PSGL1: P-selectin Glycoprotein Ligand 1 PTEN: Phosphatase and Tensin Homolog Puro: Puromycin
Rac1: Ras-related C3 Botulinum Toxin Substrate 1 Rab: Ras-like GTP-binding protein
Rap1: Ras-proximate-1 or Ras-related Protein 1 GTP-binding Protein Ras: Rat Sarcoma GTP-binding Protein
RhoGIP122: RhoG Inhibitior Protein 122 kDa RBD: Rhotekin RhoA Binding Domain RNAi: Ribonucleic Acid (RNA) Interference ROCK: Rho Kinase
RTK: Receptor Tyrosine Kinase S: Seconds
S3: Serine 3
S/N: Signal to Noise
SEM: Standard Error of the Mean
SGEF: Src Homology 3 Domain-Containing Guanine Nucleotide Exchange Factor SGLRSELGS: Serine Glycine Leucine Arginine Serine Glutamic Acid Leucine Glycine Serine
shRNA: Short Hairpin RNA
siRNA: Short Interfering Ribonucleic Acid SNX: Sorting Nexin
Src: Sarcoma
TC: Transmigratory Cup tdmCh: Tandem mCherry tdYPet: Tandem YPet
TRAF3: TNF-receptor Associated Factor 3 Tris: Tris(hydroxymethyl)aminomethane
Toca-1: Transducer of Cdc42-dependent Actin Assembly UV: Ultraviolet
VASP: Vasodilator-stimulated Phosphoprotein VCAM-1: Vascular Cellular Adhesion Molecule 1 W: Watt
WASP: Wiskott-Aldrich Syndrome Protein
WSP-1: Wiskott-Aldrich Syndrome Protein, C. elegans WAVE: WASP and Verprolin Homology
WVE-1: WASP and Verprolin Homology, C. elegans WT:Wild Type
YFP: Yellow Fluorescent Protein
CHAPTER ONE: INTRODUCTION
1.1 Introduction to Cell Migration
A Historical Perspective:
Cell migration is clearly critical to most physiological and pathological
organismal processes, playing necessary roles in embryogenesis, neural cell migration and brain cortical development, inflammatory responses, wound healing, and cancer cell metastasis. While we understand this clearly today, this knowledge has been long in development.
which became the standard for the approach to disease pathology until molecular pathology was developed in the following century. In parallel with these studies, the microscope was also improved and advanced, with achromatic lenses in the 1800s
pushing the field forward and allowing better visualization of cellular structures at higher magnification. However, further technological advances were needed to study the movements and migration of metazoan cells. In the late 1800s, Ernst Abbe and Carl Zeiss developed several technologies that enabled progress in visualizing thin, low-contrast objects: apochromatic lenses, the Abbe condenser for oblique and darkfield imaging, and a new theory of image formation in microscopy (Dunn and Jones 2004). Among the first observations of metazoan cell migration was that by Ilya Metchnikoff, who studied motile cells in transparent starfish larvae. By the introduction of small thorns into the larvae to see if the cells would defend against intruders, he observed the accumulation of cells around the sites of injury, single-handedly discovering leukocyte chemotaxis and engulfment (Tauber 2003). However, it was not until Ross Harrison, in 1907, plated frog neural tissue explants in clotted lymph and observed cells migrating out of the tissues, that it was confirmed with certainty that cells from tissues could move, and that cells from tissues could be cultured (Harrison 1907). Further developments in
photography and interference contrast microscopy all enhanced scientists’ abilities to visualize and record such cellular movements.
What still remained to be identified were the molecular components of the cellular machinery. Through development of antibodies for cytoskeletal components, scientists were able to identify the structure and location of actin and tubulin in fixed cells
Lansing Taylor and Yu-Li Wang revived the use of the microscope by injecting
fluorescently labeled actin into live cells and visualizing its dynamics (Taylor and Wang 1978). With the advent of the laser-scanning confocal microscope (Amos and White 2003) and the cloning and expression of green fluorescent protein (GFP) (Prasher et al. 1992), the usefulness of fluorescent microscopy massively expanded, and scientists were then able to tag multiple components of cellular machinery and observe their dynamics in both space and time as cells moved or were perturbed.
complexity of the amazing integrative signal processing device that is the cellular cytoskeleton, with all its myriad components. However, much work remains to be done and hopefully the work presented here will unravel just a very small part of this
complexity.
The Role of Cell Migration in Development, Homeostasis, and Disease:
alteration of the actin cytoskeleton, including the Rho guanosine triphosphatases (GTPases), and in particular Rac1 in Drosophila (Bianco et al. 2007).
Similarly, the role of migration in the targeting of immune cells to sites of infection for homeostatic maintenance has been intensively studied. In response to inflammation, endothelial cells upregulate the expression of a number of chemokines and adhesion molecules. As leukocytes flow by in the bloodstream, engagement of the selectins on the surface of the endothelium causes the leukocytes to slow down (Kansas 1996), whereupon they can be stimulated by chemokines on the surface of the
endothelium (Middleton et al. 1997), telling the leukocytes to “activate.” Once activated, the leukocyte can engage other upregulated receptors on the endothelium and come to a full stop (Kinashi 2005), whereupon the leukocyte will engage its machinery to
reorganize the actin cytoskeleton and transmigrate into tissues to the site of infection (Springer 1995; Ley et al. 2007). Thus, cell migration is absolutely critical to these normal processes of development and homeostasis.
If cell migration becomes dysregulated, a number of disorders and diseases may result, depending on the cell type and location affected. Cell migration must be
behaviors (Bos et al. 2009). To accomplish these movements, cancer cells take on highly migratory and invasive capabilities due to changes in gene expression and function, often through the epithelial-to-mesenchymal transition (Yilmaz and Christofori 2009). Once these capabilities are acquired, cells can migrate by a number of different paradigms, including amoeboid, mesenchymal, and collective migration modes, all of which require reorganization of the actin cytoskeleton and force generation to move through tissues (Nurnberg et al. 2011). Many studies have been targeted at understanding and inhibiting the changes that occur that drive cancer cell migration, but due to the plasticity of cancer cells, attempts to inhibit cell migratory pathways have often failed because cells simply engage other available signaling pathways to continue cell migration (Sanz-Moreno et al. 2008), though there have been some promising studies (Shan et al. 2005).
microtubules which are normally utilized by the Lis1 protein to regulate nucleokinesis and centrosome positioning (Grabham et al. 2007; Sapir et al. 2008). Recent studies have
also identified mutations in both the and tubulin genes that cause a variety of neuronal disorders in humans (Jaglin et al. 2009). Cell migration also appears to play a role in some more complicated disorders, such as Alzheimer’s disease and schizophrenia, where the disease causative factors are still unclear. In these diseases, it has been shown that genes encoding Neuregulin-1, a growth factor, and Disc-1,which regulates dynein function, both contribute to the development of these diseases through the dysregulation of neuronal cell positioning, especially later in life. However, these findings have largely been ignored from a clinical standpoint (Flames et al. 2004; Kamiya et al. 2005; Duan et al. 2007). Thus, gaining an understanding of the molecular mechanisms that contribute to the proper cell migration, and of the mechanisms that are engaged when this process goes awry, is essential for the development of therapeutics targeted to either enhance or
1.2 Overview of Signaling Pathways Involved in Regulating Cell Migration
Cell migration has long been a visually-oriented field of study. It is upon this backdrop that the signaling pathways that regulate cell migration have been investigated. However, before the development of probes for visually studying protein activity in living cells, biochemical methods and fixed-cell observations have been the preferred techniques for the investigation of the signaling pathways leading to cell migration.
The individual players in the signaling processes that regulate cell migration have been and are being discovered rather rapidly, and how they regulate cell migration is only slightly behind. However, the understanding of the integrative and combinatorial
functions of the cytoskeleton as a complete signaling network are only starting to be understood, though it is clear that cell migration is a coordinated process in both time and space. The space needed to cover all the signaling pathways studied and their relevance for cell migration would be prohibitive, and many excellent review articles are available that cover the field exceptionally well (Lauffenburger and Horwitz 1996; Ridley et al. 2003; Burridge and Wennerberg 2004; Yilmaz and Christofori 2009; Nurnberg et al. 2011). Thus, what will be covered here is a more broad-scale view of cell migration signaling that will eventually focus on the role of the Rho GTPases in cell migration, as these molecules are at the core of the work contained within this dissertation.
Rho GTPases as Coordinators of Cell Migration:
The best characterized of the Rho GTPases are RhoA, Rac1, and Cdc42. However, it should be noted that unique roles have been identified, some cell-type specific, for the other GTPases as well, and the cell migratory behaviors discussed above are not solely the domain of RhoA, Rac1, and Cdc42.
Signaling Pathways Leading to Cellular Morphological Polarization:
Traditionally, cell migration has been broken down into a series of physical events, each utilizing distinct signaling pathways: cellular polarization, lamellipodial protrusion, establishment of cell-substrate contacts, contractility and force generation, and release of rearward attachments (Lauffenburger and Horwitz 1996; Ridley et al. 2003). Figure 1.2 summarizes these steps and the critical signaling molecules in each step. The first event in this process is the response of the cell to some form of polarized extracellular cue, such as chemokines or growth factors, but also including extracellular matrix proteins, mechanical force, and electrical gradients. These signals cause
morphological polarization of the cell, which is required for directional extension of actin-rich lamellipodial structures via the activity of actin-polymerizing proteins discussed shortly. These cues (both intracellular and extracellular) activate many downstream pathways leading to cell polarization, but most converge on the master regulator of polarity, Cdc42. Activation of Cdc42 recruits the Par3/Par6/aPKC complex and serves as a central regulatory node for crosstalk between Rac1, RhoA, and Cdc42 (Etienne-Manneville and Hall 2003), for centrosome reorientation, for microtubule stabilization, and for membrane trafficking to the leading edge for the maintenance of polarity (Etienne-Manneville and Hall 2002; Rodriguez et al. 2003). Cdc42 activation
leads to recruitment of the GEF Pix to the leading edge for activation of Rac1 (Koh et
al. 2001), while simultaneously activating Rac1 via Tiam-1 recruitment to the
microtubule “highways” such that molecules needed for further signaling at the leading edge are added and replenished, maintaining a signaling polarity (Osmani et al. 2010). This leading edge activation of Cdc42 (Li et al. 2003) and Rac1 (Kraynov et al. 2000) also appears to be important for antagonizing RhoA activity at the leading edge, leading to activation of RhoA at the rear of cells to further polarize the cell and to define the leading and retracting edges of the cell required for efficient cell migration (Xu et al. 2003). In contrast, if RhoA is activated at the leading edge, which has been described in numerous studies (Pertz et al. 2006; Ridley 2006; Machacek et al. 2009; Tkachenko et al. 2011), Rho kinase (ROCK) can then phosphorylate Par3, leading to the disruption of Cdc42 effects through Par3 and Rac1 recruitment to the edge (Nakayama et al. 2008; Simoes Sde et al. 2010), thus antagonizing Cdc42 and Rac1 activities. Thus, these are but several of the many mechanisms which can lead to polarization of the cell during motility (Burridge and Wennerberg 2004).
Signaling Pathways Regulating Lamellipodium Formation:
activate Rac1 and a subsequent positive feedback loop that stimulates massive
polymerization of actin and lamellipodial extension (Devreotes and Janetopoulos 2003; Huang et al. 2003; Merlot and Firtel 2003). Additionally, it has been shown that phospholipase A2 (PLA2), phospholipase C (PLC), and phospholipase D (PLD) all contribute to the modulation of this gradient and the activation of parallel pathways (Kolsch et al. 2008), such as the inhibition of cofilin (Edwards et al. 1999), which
enhance Rac1 activity and actin polymerization downstream of extracellular cues . These parallel pathways also seem to be critical for the direction-finding component of cell migration, suppressing lateral lamellipodia, while the PI3K pathway predominantly affects the velocity of the migration (Wessels et al. 2007). Additionally, a myriad of feedback amplification pathways are present for both Rac1 and Cdc42 (Sasaki et al. 2007)in this process such that even extremely shallow chemoattractant gradients can be amplified into very strong signals that cause directed cell migration (Andrew and Insall 2007). Ultimately, lamellipodial protrusion is generated when Rac1 and Cdc42 bind to WASP homology domain containing proteins such as N-WASP and WAVE which subsequently activate Arp2/3, which directly polymerizes actin (Ridley et al. 2003; Burridge and Wennerberg 2004). Further, Cdc42 is also well known for generating another protrusive structure, filopodia, via interaction with an additional actin nucleating protein, mDia2, and these structures may even extend from lamellipodia and serve sensory functions during protrusion (Mellor 2009; Lee et al. 2010b). Rac1 and Cdc42 both can bind and activate the PAK kinases which phosphorylate and activate LIM kinase (Bokoch et al. 1998), which in turn phosphorylates and inactivates cofilin, which
RhoA at the leading edge can also polymerize actin, which was a surprising finding, even though biochemical and colocalization data both show that RhoA can bind and activate mDia (Lammers et al. 2008) at the leading edge to nucleate and polymerize actin
(Kurokawa and Matsuda 2005; Pertz et al. 2006; Machacek et al. 2009; Tkachenko et al. 2011). Collectively, these signaling pathways lead to the extension and stabilization of actin-rich lamellipodia.
Signaling Pathways Involved in the Stabilization of Extended Lamellipodia: Once a lamellipodium is extended, it needs to form new contacts with the
Over 180 proteins have been identified within these complexes (Zaidel-Bar et al. 2007), and a thorough review of adhesion signaling is well beyond the scope of this
introduction. Very recent work using superresolution microscopy has also shown that the proteins present in adhesions are very precisely stratified to either anchor other signaling proteins or transduce signals further within the cell (Kanchanawong et al. 2010). Suffice to say that these adhesions serve as anchor points for the cell for generation tractional forces for movement, and for mechanosensation by the cell. At this point in the
migration cycle, the cell has stretched and extended a lamellipodium which has become anchored, through which it can sense adhesion via mechanical forces exerted on these new adhesive contacts.
light chain phosphatase to increase myosin activation (Riento et al. 2003). It is curious to note that the severing of adhesion sites at the cellular rear appears to have a stimulatory effect on leading edge protrusion, perhaps through generation and transmission of hydrostatic pressure, starting the protrusion-adhesion cycle anew (Ridley 2006).
Specific Role of RhoG Signaling in Cell Migration:
While most of the small GTPase literature has focused on the canonical GTPases RhoA, Rac1, and Cdc42, 20 other Rho GTPases have been identified. One particularly interesting GTPase for this work is RhoG. RhoG is a Rac-family GTPase with 72% sequence identity to Rac1, and was identified in a screen looking for early gene
expression induced during cellular growth by stimulation with growth factors (Vincent et al. 1992). RhoG is a ubiquitously expressed, evolutionarily conserved GTPase, with homologs identified in C. elegans, D. melanogaster, M. musculus, and others. Further, RhoG appears to play a critical role in the evolutionarily conserved processes of phagocytosis and apoptotic cell clearance via the GEF Trio (deBakker et al. 2004). However, its importance in cellular signaling has been debated given that RhoG knockout mice display only minor defects in immune cell function and no gross pathological
changes (Vigorito et al. 2004).
that RhoG engages; for example, RhoG does not bind IRSp53, WASP, Por-1, POSH, or PAKs (Gauthier-Rouviere et al. 1998; Wennerberg et al. 2002), but does bind MLK3, IQGAP, and PLD1, as well as kinectin, and the fragment RhoGIP122 which appears to map to a sequence from TRAF3 Interacting protein. It has also been shown that at least in C. elegans axon guidance, RhoG (Mig-2) interacts with WASP (WSP-1), whereas Rac1 (CED-10) interacts with WAVE (WVE-1), suggesting an ability to polymerize actin via the Arp2/3 complex, but this interaction or the interaction of RhoG with Sra1 has not been tested fully in higher organisms (Shakir et al. 2008). Later studies manipulating RhoG and Rac1 in fibroblasts have shown that RhoG is dispensable for cell spreading and only contributes to cell migration in the absence of Rac1 (Meller et al. 2008), suggesting minimal capacity for RhoG to signal on its own. In contrast, the key factors regulating RhoG activation of Rac1 were identified to be ELMO1 and DOCK180, an unconventional Rac1 GEF (Katoh and Negishi 2003), and this pathway was shown to play a role in cell migration (Katoh et al. 2006). Thus, the true downstream effects of RhoG still remain poorly understood.
shown to bind to RhoG (Zalcman et al. 1996; Olofsson 1999; Michaelson et al. 2001; Brunet et al. 2002; Elfenbein et al. 2009). Thus, piecing together a coherent picture of what RhoG does in cells is a bit difficult. Based on localization and function studies, RhoG appears to be trafficked along microtubules in vesicles, as regulated by its effector kinectin, and these vesicles likely contain caveolin-1 (Prieto-Sanchez and Bustelo 2003) and Trio (Prosser et al. 2010). RhoG is also present at the cell membrane where it can be activated by extracellular cues via GEFs and subsequently engage ELMO1 and
DOCK180 to activate Rac1. Beyond this, functionally, little is known. Loss of RhoG is known to reduce EGF-stimulated macropinocytosis in A431 cells (Samson et al. 2010), to block phagocytic engulfment of apoptotic cells (deBakker et al. 2004), to reduce dorsal ruffling in some cell types (Wennerberg et al. 2002), and to potentially alter the velocity of cell migration (Katoh et al. 2006; Monypenny et al. 2009), or migration in cancer cells (Hiramoto-Yamaki et al. 2010). Given the ability of RhoG to modulate other GTPases and potentially affect the actin cytoskeleton in so many ways, it is of importance to better understand its functional role in cellular behaviors, particularly in migration where its role remains most controversial (Meller et al. 2008).
Conclusion:
1.3 Introduction to Growth Factor Signaling and the Regulation of Cytoskeletal Dynamics:
A Broader Perspective:
To respond to environmental changes, cells must have mechanisms by which they can sense those environmental changes and translate them into changes in cellular
behavior. Broadly speaking, the ability of cells to respond to extracellular cues is
conferred by the expression of a variety of receptors that are incorporated into the plasma membrane and bridge the extracellular and intracellular environments. Many classes of receptor exist, including G-protein coupled receptors (GPCRs), receptor tyrosine kinases (RTKs), cellular adhesion molecules (CAMs), integrins, and many others. Many of these receptors respond to molecules known as growth factors, which were discovered as components of serum that caused cellular proliferation. In addition to their ability to cause cellular proliferation, many of these growth factors are also known to cause cell migration, or chemotaxis, toward the growth factor.
Among these extracellular growth factors known to stimulate and regulate cell migration is the extracellular ligand epidermal growth factor (EGF). The fact that a number of different therapeutic attempts have been made to target EGF signaling in metastatic breast cancer and other diseases indicates the importance of this signaling pathway not only in normal physiological development, but in pathological cellular responses as well.
EGF Signaling in the Regulation of Cell Migration:
components of the EGF signaling pathway that determine specific contextual and cellular responses to EGF ligands, rather than simple activation of the pathway itself (Figure 1.3). EGF binding to EGF receptors promotes hetero- or homodimerization of the four major EGF receptors (ErbB1-4), which are receptor tyrosine kinases, and induces
autophosphorylation of the receptor. In turn, this autophosphorylation generates docking sites on the cytoplasmic tail of the receptor that allow for the binding of adaptor proteins and scaffolds. From this point, many signaling proteins interact with the adaptor
proteins, initiating downstream signaling cascades dependent on the particular proteins recruited to the receptor. Common to all EGF signaling is the activation of the mitogen-activated protein kinase (MAPK) pathway, the PI3K/Akt pathway, and the p70S6 kinase pathway, which lead to cellular responses such as apoptosis, migration, growth, adhesion, and differentiation (Rubin and Yarden 2001; Yarden and Sliwkowski 2001).
subsequent activation of both Rac1 and Cdc42 (Liu and Burridge 2000). Additionally, there are many other pathways leading to Rac1 activation downstream of the EGF receptor, predominantly mediated by the PI3K pathway (Nobes et al. 1995). Through this pathway, as mentioned above, phosphoinositides are generated, particularly PI3P, at the leading edge, leading to recruitment of a variety of Rac1 GEFs including Tiam-1, P-Rex, and others (Kolsch et al. 2008). In turn, both Cdc42 and Rac1 can bind to and activate PI3K generating a feedback loop that further stimulates the production of leading edge phosphoinositides for signaling and actin polymerization. In addition, RhoA is apparently inactivated at first by EGF stimulation, giving further credence to the mutual antagonism of Rac1/RhoA (Sander et al. 1999; Nimnual et al. 2003), but is activated at later stages, perhaps to assist in productive cell migration by retraction of the trailing edge (Burridge and Wennerberg 2004).
EGF Signaling in the Regulation of Macropinocytosis:
In addition to its effects on cell migration pathways mediated through the Rho GTPases, EGF stimulation in many cell lines also engages the Rho GTPases to rearrange the actin cytoskeleton for the purposes of macropinocytosis. Macropinocytosis is a non-selective fluid-uptake process. Most cells do not demonstrate constitutive
macropinocytosis, but rather macropinocytose in response to growth factor signaling, such as in fibroblasts which respond potently to both PDGF and EGF (Mellstrom et al. 1988; West et al. 1989; Anton et al. 2003). The macropinocytosis process is very similar to phagocytosis and requires rearrangement of the actin cytoskeleton on the dorsal
on the dorsal surface which are actin-based, and eventually the cup closes in a similar fashion to phagosome formation (Swanson and Watts 1995). Because of its dependence on actin-based dynamics, a number of actin-regulatory proteins have been identified in these structures, including the GTPases Rac1 and Cdc42 (Cox et al. 1997; West et al. 2000; May and Machesky 2001). The phosphoinositides again play a role in
macropinocytosis, particularly in the closure of the macropinosomes (Araki et al. 1996) (Swanson JCB 1996). Further, PI3K in particular appears critically important in growth-factor induced macropinosomes (Wennstrom et al. 1994; Kotani et al. 1995), functioning upstream of Rac1 to regulate the actin cytoskeletal changes needed for cup formation in some cell lines, while becoming more important for macropinosome closure in others such as A431 cells. The reasons for these differences remain unclear, but are likely due to the different composition of signaling proteins downstream of EGF signaling. For example, it was recently reported that PLEKHG6 is a GEF that binds to ezrin on the dorsal surface of cells to mediate dorsal ruffling and in its absence, EGF-induced
closure. However, signaling through ezrin is complex and may activate a number of GTPases, so the full context is not clearly understood. However, it is clear that the Rho GTPases are activated by EGF in the process of growth-factor induced macropinocytosis, and much remains to be understood about their spatiotemporal regulation, in particular their ability to affect both the formation of macropinocytic cups, and the closure of those macropinosomes.
1.4 Overview of Fluorescent Biosensors for Protein Activity
Introduction:
Dynamic cellular responses and behaviors, such as cell migration described above, are encoded by the complex spatial and temporal dynamics of a variety of signaling networks. A major challenge is to delineate the precise spatial and temporal behaviors of each of the signaling molecules and second messengers in these networks and how they relate to one another in both space and time. To this end, a large body of work has been devoted to observing the formation, localization, activation, and turnover of a vast number of these signaling molecules. Many techniques have been developed to observe the activity of these molecules over a large population of cells with biochemistry, or single molecules in single cells, both with and without spatial and temporal resolution. Recently, fluorescence-based methodologies have become among the most widely used methods to monitor these cellular events. Biosensors, probes designed to detect changes in protein or second messenger activity or concentration, have been developed to achieve these goals, and they provide the exquisite spatial and temporal resolution needed for analysis of signaling pathways within single cells. However, researchers have long sought to observe more than one molecule’s activity in cells at the same time, such that correlative analyses can be made more accurately. As the fluorescent protein and dye palette has expanded, new biosensors and imaging technologies have been designed to observe multiple protein activities within live cells, known as multiplexing or
highlight the developments that have led to the ability to image signaling activity within cells, the development of probes for the study of intracellular signaling, and some of the current approaches and challenges to the study of intracellular signaling by imaging.
Development of Fluorescent Proteins and Chemical Dyes:
Fluorescence as a biophysical phenomenon has been used for many years to visualize cellular structures and targets, typically by labeling antibodies with small organic dyes, fixing cells or samples of interest, and then adding the antibody which can be subsequently visualized via fluorescence. However, these techniques were highly invasive and gave little information about cellular dynamics due to fixation. Later, dyes were developed that could recognize some cellular structures and molecules, such as DNA or intracellular ions, in living cells, but these are fewer in number and limited in their utility overall. The true revolution in fluorescence technology came with the discovery and development of fluorescent proteins, the first of which were
protein with GFP and observing its dynamics and localization. As years went by, the complexity of such studies gradually increased. In parallel, much work has been devoted to improving and expanding the “base” GFP molecule, yielding advances in protein folding efficiency, brightness, photostability, monomericity, and spectral diversity (Shaner et al. 2004; Shaner et al. 2007; Shaner et al. 2008; Newman et al. 2011). Through these advances, the ease of use of fluorescent proteins through either
transfection of plasmid DNA or transgenic methods for expression has brought them to the forefront of imaging studies of protein dynamics.
Biosensors for Monitoring Protein Movement and Translocation:
in response to growth factors, phosphoinositide-binding proteins to sites of inositide production (Akt, ARNO, GRP1, PLC) (Stauffer et al. 1998; Gray et al. 1999; Hirose et al. 1999; Meili et al. 1999; Oatey et al. 1999; Watton and Downward 1999; Servant et al. 2000), and transcription factors to the nucleus, such as NF-κB (Nelson et al. 2004), and these have been observed through imaging of single fluorophores (O'Rourke et al. 2005). Observation of combinations of such probes simultaneously is relatively trivial today given the available range of bandpass filters, dichroic mirrors, and spectrally separable fluorophores, and has been applied to a variety of high-throughput methodologies for the examination of signaling pathways, of which category a particularly elegant study was recently published (Taylor et al. 2009). However, these single protein fluorescent fusions can only reveal a limited amount of information when it comes to localization or
translocation. In particular, for many enzymes or signaling proteins, simply observing localization does not reflect when and where the protein is active, which likely represents the truly functional form of the protein. Thus, sensors that could detect the active form of proteins were soon developed via the use of fluorescence resonance energy transfer (FRET) principles.
FRET-Based Biosensor Design and Usage:
In the field of biosensor development, a myriad of sensors for the detection or identification of signaling protein or second messenger function, activity, or
degree of spatial and temporal resolution. Probe designs have been extensively covered in several excellent review articles (Zhang et al. 2002; Miyawaki 2003; Lalonde et al. 2005; Tsien 2005; VanEngelenburg and Palmer 2008) and here I will broadly cover common designs, methods for their use, and their advantages and disadvantages in multiplexing.
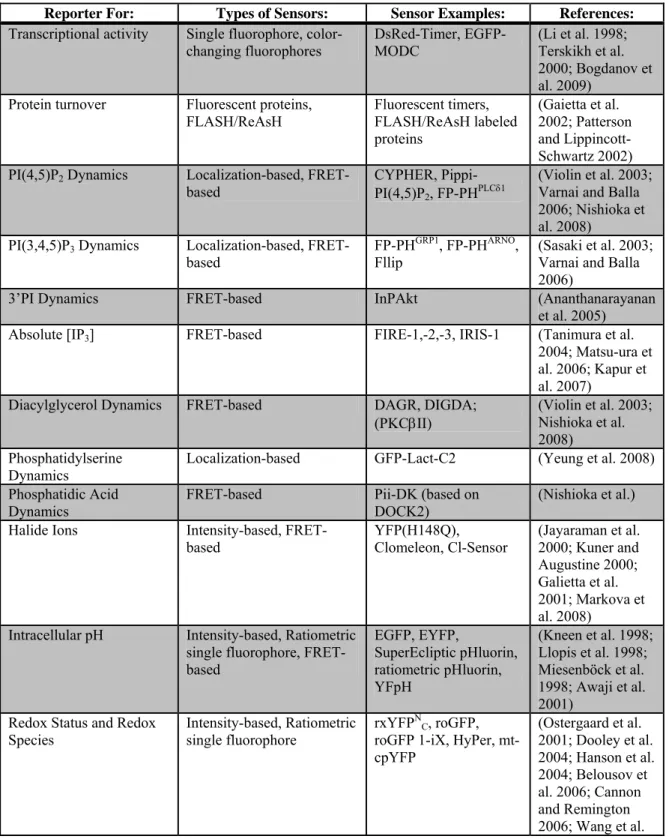
In general, biosensors come in two basic “flavors”: target/substrate-modified sensors or endogenous sensors. Either format contains an “affinity reagent,” which is either a sensing or substrate element that is modified or bound upon signaling molecule activity/concentration change within the cell, resulting in a change in FRET or associated fluorophore intensity/wavelength. See Figure 1.5 for general biosensor design and possible variations. Here I will discuss several categories of these sensors and their use in the evaluation of signaling molecule behaviors or activities within cells.
The range of available FRET probes has expanded greatly since the first demonstrated use of FRET between two fluorescent proteins in an intracellular probe, which observed the protease-mediated cleavage of a peptide flanked by BFP (blue fluorescent protein) and GFP (green fluorescent protein) (Mitra et al. 1996). The current list is almost too exhaustive to list but general classes of sensors can be defined. In general, there are three categories of probe activity detection methods: activity or ligand-binding causes 1) FRET between two fluorescent proteins to change, or 2) spectral properties of a single fluorophore to change, or 3) translocation of a fluorophore.
and others (O'Rourke et al. 2005; Newman et al. 2011). Single fluorophore probes that change spectrally have been designed based on a critical understanding of the chemistry of the fluorophore itself, often designing the fluorophore to be more sensitive to pH, ions, redox status, or even adding domains to the fluorophore that cause the fluorophore to change its spectral properties. In contrast, FRET-based sensors are much more complex, usually consisting of multiple domains and flexible linker regions connecting the
fluorophores to the activity-detecting segment, or “affinity reagent.” Three basic designs of these probes exist, with many variants: the sensors separate two fluorescent proteins with 1) a cleavage-sensitive linker, 2) an affinity reagent that undergoes conformational change (phosphorylation motif, binding of the molecule of interest, etc.), or 3) an affinity reagent in addition to the molecule that binds the affinity reagent on the same molecule or on separate molecules (intramolecular versus intermolecular FRET). These three broad classes cover most available FRET probes published to date. For design variants that fall within these classes, see Figure 1.5. For prototypical examples of these probe designs, the different classes of molecules that can be studied with them, and representative references, see Table 1.1.
compartmentalizing sensors, multiple sensors can be introduced into cells in different compartments to allow visualization of subsets of the protein of interest, or to allow study of two proteins simultaneously, which will be discussed in more detail below.
FRET-Based Biosensors for the Rho GTPases:
Of particular interest to this work, most Rho GTPase FRET probes fall under the intramolecular FRET sensor design, wherein the affinity reagent and the molecule of interest are both contained within the probe, in addition to the two fluorophores. Much optimization has been undertaken to obtain GTPase probes that change their FRET signal when in the active versus inactive states. In chapter two, I will discuss the design and optimization of these probes, as well as new advances in this area generated by the Hahn lab.
Selection of Fluorescent Proteins for Optimal FRET:
proteins (if the acceptor is slow to mature, FRET will be reduced). Additionally, 6) each FRET pair must be excited using wavelengths that do not excite the other FRET pair, or the microscope should be able to collect emission from each pair where the other FRET pair does not fluoresce, or the FRET pairs must be targeted to non-overlapping
subcellular regions. Finally, 7) longer excitation wavelengths are preferred as they cause significantly less photodamage to the cells under study, permitting shorter intervals between each image acquisition, and autofluorescence is reduced in the longer wavelengths, thus reducing background and enhancing signal-to-noise ratio.
When used ratiometrically, these probes consume the greatest amount of spectral bandwidth, requiring the use of both the donor and acceptor emission and excitation spectra. Many fluorophores, particularly fluorescent proteins, are problematic in that they have broad excitation and emission spectra, are relatively dim compared to dyes, and the resultant FRET signal is relatively small. Thus, only a few fluorophores fit the
criteria above, with most FRET probes largely developed using the fluorophores CFP and YFP, because they meet all the criteria listed above (Tsien and Miyawaki 1998; Campbell 2009), and can be genetically encoded. Other pairs, such as BFP/CFP and EGFP/DsRed, have also been used for FRET probes (even before CFP/YFP), but each of these pairs has significant excitation and emission overlap with the other available pairs, preventing their simultaneous use in live cells for ratiometric imaging when the probes are present in the same location. This has prevented the ability of researchers to achieve imaging of multiple signaling molecule activities/changes simultaneously.
literature to effect FRET, and these have been covered in previous reviews (Berney and Danuser 2003; Wallrabe and Periasamy 2005). In addition to these previously used dyes, environmentally-sensitive dyes that change intensity in response to local conformational changes may be used to detect protein activity quantitatively when the change is ratioed against a non-responding fluorophore such as EGFP (Nalbant et al. 2004). Dyes are often much brighter than fluorescent proteins, though less photostable, and there are a number of dyes which extend further into red wavelengths than fluorescent proteins, permitting a greater number of ratiometric FRET pairs, which was taken advantage of to
and a biarsenical dye, which has been previously used for FRET studies (Van
Engelenburg et al.; Martin et al. 2005). Such methods for labeling endogenous proteins are still few in number, but will likely expand as time goes on and will permit easier use of dyes for multiplex imaging studies (Hinner and Johnsson 2010).
A third fluorescent protein-based intracellular signal detection technique which has many useful applications, but does not fall under the realm of FRET, is bimolecular fluorescence complementation (BiFC) (Hu et al. 2005; Kerppola 2006; Kerppola 2009; Robida and Kerppola 2009). This technique has the advantage of detecting protein interactions similar to FRET, while only using a single fluorescent protein. However, this technique suffers from irreversibility and the necessity of tagging two proteins with fragments of the fluorescent protein to be complemented. Thus, this technique is primarily useful for detecting protein interaction, but not the dynamics of these
interactions. However, it has been used to effect in multicolour studies (Vidi et al. 2008; Kodama and Wada 2009).
Current Approaches and Challenges to Studying Intracellular Signaling by Imaging: Progress toward the ability to use two FRET pairs simultaneously and thus detect two intracellular signaling activities for correlation studies has been one of the key goals of FRET-based biosensor work. However, this goal has been limited by the lack of fluorophores for novel FRET pairs that are genetically encodable, spectrally distinct, bright, monomeric, photostable, and do not overlap with the common CFP/YFP pair. The development of the red fluorescent protein from Discosoma, DsRed, initially brought much hope toward the development of a second FRET pair (Matz et al. 1999), but
development of red-shifted fluorescent proteins for sensitized FRET emission that meet the criteria defined above has been difficult. Only recently have there been significant advances in the improvement of the photostability, brightness, and quantum yield of red-shifted fluorescent proteins (Ouyang et al.; Shaner et al. 2004; Shaner et al. 2008), though the current red-shifted fluorescent proteins are still not as useful for FRET as the
previously developed FRET pairs, given their poorer photostability and lower quantum yield (Ai et al. 2008). Here we will briefly cover the fluorophores that have been used to effect in multiparameter imaging experiments.
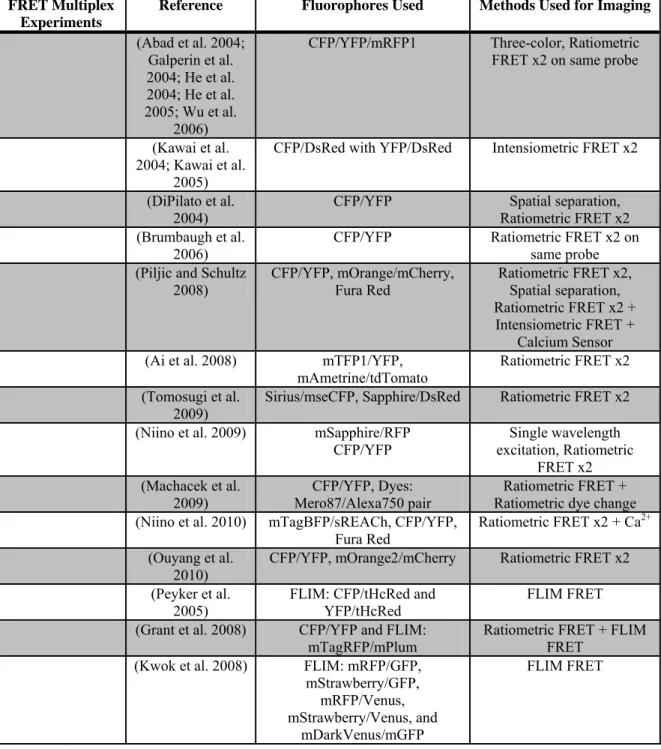
True emission ratiometric multiplex FRET imaging experiments provide the greatest quantitative measurements of the spatial and temporal behaviors of the molecules of interest and thus are preferable to other techniques. For a current list of published multiplex FRET experiments, see Table 1.2. We will highlight a few illustrative
pair, along with Fura red to sense Ca2+ levels. They achieved resolution of FRET signal, corrected for bleedthrough, despite mCherry being a poor FRET acceptor due to its low quantum yield (Wallrabe and Periasamy 2005; Ai et al. 2008). In that work, the authors were able to relate temporally the relationship among Ca2+ changes, PKC and CaMKIIα activity, and Annexin A4 assembly down to a temporal resolution of seconds from imaging data. Further, Ouyang et al. (Ouyang et al. 2010) have recently demonstrated use of mOrange2/mCherry as a second FRET pair to examine both Src and MMP-MT1 simultaneously within cells, showing dramatically different spatiotemporal patterns for each molecule, with Src activity being fast and dispersed downstream of EGF
stimulation, whereas MMP-MT1 was slow and predominantly membranous, despite the fact that Src activates MMP-MT1. In contrast to these studies utilizing currently
available orange and red fluorescent proteins for novel FRET pairs, Ai and others (Ai et al. 2008) sought to generate a second FRET pair that would better meet the criteria above than mOrange/mCherry combinations and developed an mTeal/YFP and
et al. 2009; Tomosugi et al. 2009). A graphical representation of the spectra of fluorophores used in known ratiometric multiplex FRET experiments is illustrated in Figure 1.6.
Perhaps the largest and most successful set of multiplexing experiments has been performed using a CFP/YFP FRET sensor with a ratiometric Ca2+ sensor such as Fura-2, Fura red, or Indo-1 (Violin et al. 2003; Palmer et al. 2004; Landa et al. 2005; Harbeck et al. 2006; Newman and Zhang 2008; Wier et al. 2008). In particular the study by Wier et al. examining Ca2+ levels via Fura-2, and a CFP/YFP biosensor for MLCK, performs particularly careful experiments addressing spectral crosstalk between the two probes while permitting simultaneous imaging of Ca2+ levels and MLCK activity in mouse small arteries. Other groups have suggested that Indo-1 may have less spectral interference than Fura-2 (Tay et al. 2007), while recently Fura red was used with a blue-shifted FRET sensor for cGMP (Cygnus), and a CFP/YFP sensor for cAMP (Niino et al. 2010).
Other groups have developed other methods to expand the range of useful FRET biosensors. Several groups have used additional FRET pairs such as CFP/tHcRed or mTagRFP/mPlum for fluorescence lifetime imaging (FLIM) (in parallel with
T-Sapphire/DsRed to detect cGMP (Niino et al. 2009), in addition to a CFP/YFP FRET pair in each study.
Appropriate Probe Use and the Potential for Perturbation of Signaling Dynamics:
As researchers load cells with multiple activity sensors for multiplex imaging, one might hypothesize that cellular perturbation might be an even greater concern than simple spectral separation of the sensors. It is difficult to study a system without perturbing said system. However, we believe that the higher the dynamic range of the sensor, the better, as it allows lower expression levels of the sensor to visualize the same target changes, preventing perturbation of intracellular signaling. In general, the sensitivity or dynamic range of a sensor should be great enough to detect normal, constitutive signaling
increases the amount of sensor, the sensor may compete with the endogenous substrate for phosphorylation, thus blunting or altering intracellular signaling cascades.
In the case where the enzyme of interest is contained within the sensor, the cell may be swamped by the addition of this extra enzymatic activity. In the case of GTPase sensors, where the GTPase itself is present within the sensor, comparison of both
unimolecular and bimolecular designs is illustrative. In the case of an intramolecular GTPase sensor, it has been shown previously that the sensor is unable to interact effectively with downstream effectors (Pertz et al. 2006), but it is still capable of interacting with GEFs, GAPs, and GDI. As one increases the amount of sensor, the interaction with these proteins increases, and thus the sensor can behave as a dominant negative. Overexpression of GTPases also depletes the available GDI within cells, thus increasing the activity and altering the normal function of many other GTPases dependent on GDI1 (Boulter et al. 2010). In intermolecular GTPase sensors, the same GAP, GEF, and GDI interactions occur, along with additional interactions with downstream effectors. Overexpression of this sensor type can cause it to behave either as a dominant negative or a signal amplifier if allowed to interact with downstream effectors, depending on the circumstances. Massive overexpression of the intermolecular sensor may allow the sensor to act on downstream effectors more easily and activate downstream signaling pathways. However, the dynamic range may be as great as 600% due to low FRET in the “off” state (Welch and Hahn, unpublished observations) with such intermolecular