Acknowledgments
Table of Contents
1. ABSTRACT………..4
2. INTRODUCTION……….5
2.1 Obesity, Adipose Tissue, and Inflammation………...5
2.2 Immune Cells of the Inflammatory Adipose Microenvironment…………6
2.3 Leptin and T Cell Signaling……….9
2.4 Type II Diabetes Mellitus, Insulin Resistance, Obesity, and Hyperglycemia……….11
2.5 Mouse Models of Obesity, Conditional Knockout Mice, and Lck-Cre Technology………..13
2.6 Summary of Background Information and Significance………...15
3. METHODS………17
3.1 Breeding to Produce Conditional KO Mouse………17
3.2 Diet-Induced Obesity in Mice………17
3.3 Genotyping……….18
3.4 Western Blotting………21
3.5 Fasting Blood Glucose………...24
3.6 Statistical Analysis……….25
4. RESULTS………..26
4.1 Genotyping……….26
4.2 Western Blot………..27
4.3 Mouse Weights and Diet-Induced Obesity………28
4.4 Fasting Blood Glucose………...29
5. DISCUSSION………32
5.1 Diet-Induced Obesity……….32
5.2 Genotyping……….32
5.3 Western Blotting………33
5.4 No Significant Difference Between Fasting Blood Glucose of Obese Mouse Groups………33
5.5 Limitations……….34
5.6 Conclusion and Future Studies………..35
Abstract
Obesity is a serious public health threat, claiming millions of lives each year worldwide. It is thought that many of the complications associated with obesity are the result of adipose inflammation that has a spillover effect leading to a systemic state of low-grade, chronic inflammation in the body. While scientists debate the exact causal mechanism of adipose
Introduction 2.1 Obesity, Adipose Tissue, and Inflammation
Over the past few decades, the prevalence of obesity worldwide has reached epidemic proportions, with the current number of obese people nearly doubling since 1980 (1). According to the World Health Organization (WHO), 35% of adults aged 20 and over were considered overweight in 2008 (BMI ≥ 30), and 11% were obese (BMI ≥ 30). In other words, over 1.4
billion adults aged 20 and over were overweight, and approximately 500 million were obese in 2008 (1). Furthermore, the obesity prevalence is expected to continue to rise in the future with the WHO projecting that 2.3 billion people will be overweight and 700 million people obese by 2015 (1).
In the United States alone, obesity and its related co-morbidities are thought to cause 280,000 deaths annually (2). Obesity is traditionally defined as an accumulation of excess
adipose tissue as the result of a positive energy imbalance; the body consumes more calories than it expends (2). However, as research has advanced, experts now recognize the complexity of obesity and its many health implications, including diabetes mellitus, coronary heart disease, hypertension, hyperlipidemia, liver disease, and certain cancers among others (1-3). In fact, the AMA has altered its position from defining obesity as a serious public health problem to a disease in an attempt to draw increased attention to its devastating effects (4). Clearly, obesity is a significant worldwide public health epidemic.
accepted as having endocrine functions itself, secreting a multitude of hormone molecules known as adipokines that may act in an autocrine, paracrine, or endocrine manner. These adipokines encompass a variety of hormones with many different functions such as leptin, adiponectin, tumor necrosis factor-alpha (TNFα), retinol binding protein, interleukin-6 (IL-6),
resistin, monocyte chemoattractant protein-1 (MCP-1), and angiotensinogen among others. These adipokines are important in allowing WAT to communicate and interact with other tissues of the body (2).
Research now indicates that excess adiposity can trigger the altered, improper release of many adipokines from adipocytes, thus possibly playing a role in the dysfunctional metabolism associated with obesity. Many of these adipokines are pro-inflammatory, such as TNFα and
IL-6, contributing to the widely accepted idea that obesity is associated with a low-grade, chronic state of inflammation (7). This idea has developed overtime as experts have noted that obese individuals usually exhibit increased levels of C-reactive protein and many pro-inflammatory cytokines (8). It is not entirely clear whether the excess inflammatory cytokines released from WAT causes this state of low-grade, chronic inflammation throughout the obese body, but many researchers agree that this spillover of pro-inflammatory mediators directly contributes to the characteristic inflammatory state (8).
2.2 Immune Cells of the Inflammatory Adipose Microenvironment
The exact mechanism as to why WAT in obese individuals expresses elevated levels of pro-inflammatory cytokines still remains unclear. However, over the past couple of decades, many scientists have begun to suspect the increased infiltration of pro-inflammatory
macrophages as being either M1 or M2. M1 macrophages are activated by Th1 inflammatory cytokines, such as IFNγ and TNFα, and are typically pro-inflammatory (9). M2 macrophages, on
the other hand, are activated by Th2 cytokines, such as IL-4, and are typically anti-inflammatory (10). As adipose tissue expands in an obese individual overtime, M1 levels in adipose tissue increase significantly, suggesting that excess adiposity has the effect of shifting the macrophage microenvironment away from M2 to the pro-inflammatory M1 subtype (11). These M1
macrophages then form ‘crown-like structures’ around dying adipocytes and release pro-inflammatory cytokines like IL-6 and TNFα, thus contributing to the pro-pro-inflammatory state of
WAT (11-12).
Although much research in the past has focused on the infiltration and activation of macrophages in adipose tissues as a leading cause of inflammation, recent studies have pointed to other innate and adaptive immune cells, such as B lymphocytes, T lymphocytes, natural killer T (NKT) cells, neutrophils, and eosinophils, as playing a role in the propagation of obesity-induced inflammation. This inflammatory role occurs either by augmentation or depletion of their respective immune cell populations (13-17). For example, one study showed that B cells infiltrate adipose tissue at the onset of weight gain and in doing so display an altered functioning. B cells were shown to contribute to adipose inflammation in their activation of T cells and release of pro-inflammatory cytokines (13). Overall, adipose inflammation is likely the result of a complex interaction of both innate and adaptive immune responses and the depletion or upregulation of certain immune populations that come together to propagate adipose
Of particular interest to this paper are T cells. Recent studies have indicated adipose-resident T cells (ARTs) as playing a major role in the onset of adipose tissue inflammation in their interaction with both adipocytes and macrophages (18). When considering T cell function in adipose inflammation, it is important to note T cell subtype. For instance, research has shown CD8+ and CD4+ Th1 T cells to increase in adipose tissue with obesity, while CD4+ Th2 and T-regulatory cell (Tregs) populations decrease as adiposity increases. Scientists agree that CD8+ and CD4+ Th1 cytokines are pro-inflammatory, and thus as these T cells increase in number, they drive inflammation in adipose tissue. In addition, Th1 cytokines have been shown to recruit macrophages to adipose tissue and stimulate the polarization of macrophages to the M1 pro-inflammatory subtype (19). Th2 cells and Tregs, on the other hand, are anti-pro-inflammatory lymphocytes that secrete Th2 cytokines, such as IL-4, thus playing an integral role in the prevention of adipose inflammation and the polarization of macrophages to the M1 subtype (20-21). Unsurprisingly, the depletion of Th2 cells and Tregs associated with obesity directly contributes to increased adipose inflammation. Clearly, adaptive immunity, specifically concerning T cells, plays a role in the adipose inflammation cascade.
Although many researchers now agree that T cells cannot be overlooked in discussing adipose inflammation, their precise contribution is not as clear as that of both adipocytes and macrophages (22). There is still much that remains unknown concerning T cell biology in WAT and how obesity alters the metabolism of T cells. However, as mentioned before, we do know that a high fat diet (HFD) in mice causes an increase in CD8+ and CD4+ Th1 T cell populations within WAT, leading to the increased release of IFNγ, a pro-inflammatory cytokine that can
the recognition of a specific complex known as MHCII on an antigen-presenting cell alongside other stimulatory signals. Macrophages may serve as the antigen presenting cells that activate T cells. However, multiple publications have noted increases in T cell populations before the infiltration of macrophages into adipose tissues, thus leading to the idea that some other antigen presenting cell and/or hormone may be activating T cells (22). Deng et al. reports that adipocytes in both obese humans and mice express all the MHCII components necessary for antigen
presentation to spur T cell activation and proliferation and suggests that adipocytes therefore likely enhance a pro-inflammatory adaptive immune response, thus contributing to the inflammatory phenotype associated with obesity.
2.3 Leptin and T Cell Signaling
Leptin is a 16-kDA polypeptide best known for its role as a regulator of energy homeostasis. It is primarily produced by adipocytes and is encoded for by the obese gene ob. Leptin is both an adipokine and hormone because although it is secreted primarily from
adipocytes, other tissues, such as placental cells and bone osteoblasts, are known to produce it as well (23). Leptin levels are known to correlate directly with the size of adipose tissue, an
underlying reason that leptin is usually considered a signal of energy reserves for the body. Leptin exerts its biological functions as it binds to the leptin db receptor on various cell types (23).
secrete the pro-inflammatory cytokine IFNγ, thus promoting Th1 and decreasing Th2
differentiation (24). Furthermore, Deng et al. found that IFNγ promoted the increased expression of adipocyte MHCII thereby leading to antigen-specific T cell activation. This T cell activation in turn leads to increased inflammation within adipose tissue. Importantly, this interaction of leptin, IFNγ, adipocyte MHCII, and T cells leading to T cell activation and proliferation all occurred before macrophage infiltration and M1 polarization in adipose tissues (22). Moreover, other papers have found that IFNγ levels increase with obesity and lead to M1 macrophage
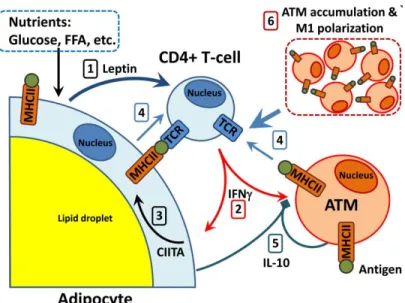
polarization, while mice deficient in IFNγ developed less adipose inflammation, highlighting the integral role of IFNγ in promoting WAT inflammation (25-26). Taking these findings together, Deng et al. suggests that leptin stimulates adipose resident T cells to activate and release INFγ, which then increases adipocyte MHCII thereby further promoting the differentiation of Th1 T cells and a pro-inflammatory state (See Figure 1.). Therefore, we would conclude that adipose inflammation is at least partly a result of an inflammatory dialog between adipocytes and adaptive immunity. This hypothesis is supported by the fact that leptin deficient ob/ob mice show less adipose resident T cell IFNγ, adipocyte MHCII expression, and fewer activated Th1 T
Figure 1. This image depicts the role adaptive immunity may play in the inflammatory response related to a high fat diet. Excess nutrients lead to increased leptin expression from adipocytes (1). Leptin signals to CD4+ T cells to activate and release the cytokine IFNγ (2), which then causes
adipocytes to increase their expression of MHCII overtime (3). MHCII antigen presentation by adipocytes and other cells stimulates CD4+ T cells to proliferate and differentiate (4). Source:
Deng, T., Lyon, C. J., Minze, L. J., Lin, J., Zou, J., Liu, J. Z., ... & Hsueh, W. A. (2013). Class II
major histocompatibility complex plays an essential role in obesity-induced adipose
inflammation. Cell metabolism, 17(3), 411-422.
2.4 Type II Diabetes Mellitus, Insulin Resistance, Obesity, and Hyperglycemia
to leave the blood and enter into cells. As a result of the altered insulin-signaling cascade
associated with diabetes, hyperglycemia manifests as cells fail to take up proper levels of glucose from the blood and the liver fails to halt gluconeogenesis. In a compensating attempt, pancreatic beta cells release an increased amount of insulin, but this overtaxing fails eventually leading to insulin insufficiency and a dangerous hyperglycemic state in both diabetic human and mouse models (5). Type II diabetes can be diagnosed in several ways, including fasting plasma glucose levels, an oral glucose tolerance test, or measurement of hemoglobin A1c, which reflects the average blood glucose levels over the past 3 months. Clearly, insulin resistance and diabetes are major public health threats (27).
mouse models (5-6). Interestingly, recent studies have indicated that insulin resistance may occur before macrophage infiltration and polarization, allowing for another process to possibly
contribute to adipose inflammation and insulin resistance. Deng et al. suggests the proposed increased leptin signaling to T cells in obesity, which then drives the release of IFNγ to increase
MHCII expression on adipocytes thereby promoting the differentiation of Th1 T cells, as a possible mediator of insulin resistance. Moreover, these researchers found MHCII deficient mice to have less insulin resistance, IFNγ, and M1 macrophage compared to wild type mice,
suggesting that adaptive immunity likely plays a role not only in adipose inflammation but also insulin resistance (22). Therefore, we propose that insulin resistance may be able to be
diminished in mice if the adaptive immune response is blocked. For our purposes, we will attempt to block the initial leptin signaling to T cells proposed by Deng et al. to initiate the inflammatory cascade in adipose tissues within mice.
Although fasting plasma glucose levels are normally not used as a measure of insulin resistance, it is a common test performed to test for diabetes. Studies in the past have linked obesity to hyperglycemia as well. We will therefore use fasting glucose levels to test the following hypothesis; we predict that blocking the initial leptin signaling to T cells may reduce the hyperglycemia usually associated with insulin resistance and diabetes in diet-induced obese mice. If this hypothesis is in fact true, it would suggest that leptin activation of T cell metabolism is, in part, responsible for the development of hyperglycemia as a consequence of obesity.
Findings from this study can be used to build future studies to understand the relationship between obesity, insulin resistance, T cells, and leptin.
To limit confounding factors, we chose a mouse model of diet-induced obesity in which to test our hypothesis. Research in the past has indicated that mouse models of diet-induced obesity successfully mimic the overconsumption of calorically dense foods, a leading cause of obesity in human beings. (30). Furthermore, one study found that mouse adipocytes expressed significant levels of the inflammatory markers associated with obesity after just 2 weeks on a high fat diet (HFD) (22). In order to ensure that diet-induced obesity occurred, mice were weighed over a period of 12-16 weeks and fed either a HFD or control chow diet. Mice were weaned 3 to 4 weeks after birth and placed on their respective diets.
In order to focus on the interaction between leptin and T cells alone, we utilized a T cell specific leptin receptor conditional knockout (KO) mouse in which leptin receptor (LepR) has been truncated in T cells alone. In contrast to the traditional knockout mouse where a gene is knocked out in all tissues, the conditional knockout yields selective knockout in particular tissues, in this case all mature T cells. The inactivation of a specific gene in a conditional knockout occurs by the presence of a site-specific DNA recombinase (in our case Cre) along with two recombinase recognition sites (in our case loxP) residing on noncoding sequences of the target gene. The Cre will then cut out the segment of DNA between the two loxP sites hence removing the target gene (31). For our purposes, we rely on the Lck-Cre system to ensure that T cells are the only tissue that becomes mutated with no functional leptin receptor. Lck
functional leptin receptor within their T cells, thus hindering leptin from signaling to T lymphocytes.
2.6 Summary of Background Information and Significance
Obesity is a global epidemic and is linked to a number of serious conditions such as cardiovascular disease, cancer, and diabetes. Scientists now believe that the low-grade, chronic state of inflammation associated with obesity is largely responsible for obesity’s adverse metabolic effects. This obesogenic systemic inflammation is likely multi-factorial with adipocytes, macrophages, and other immune cells all expressing an altered pro-inflammatory phenotype as a result of excess adiposity. Although not as well understood, recent studies have begun to implicate adaptive immunity and, more specifically, T cells as playing a major role in the onset on adipose inflammation. In particular, one study implicated leptin from adipocytes as signaling to T cells, causing Th1 differentiation and inflammatory cytokine release before M1 macrophages had even infiltrated adipose tissue. This notion suggests that leptin may indeed be a pro-inflammatory adipokine contributing to T cell activation and differentiation and thus adipose inflammation.
Methods 3.1 Breeding to Produce Conditional KO Mouse
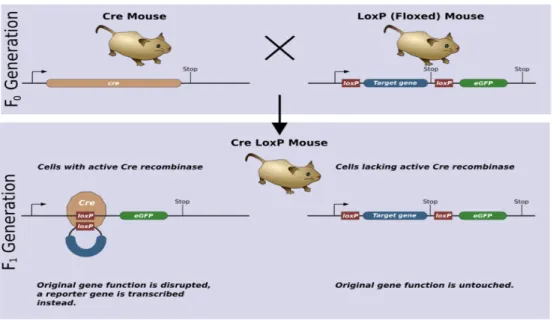
To create a conditional knockout mouse, a double loxP flanking exon 17 mouse (floxed) created through embryonic stem cell targeting was mated with a transgenic mouse expressing Cre at the Lck promoter. The loxP mouse was homozygous for loxP while the Cre mouse was heterozygous, leading to some mice that are KO and others that are not (See Figure 2). The knockout offspring had disrupted DNA only where both Cre and loxP sites are present (T cells), thus creating a T cell specific leptin receptor conditional knockout mouse.
Figure 2. To create a conditional knockout mouse (Cre LoxP), a Cre mouse is mated with a LoxP (Floxed) mouse. Only cells with active Cre (T cells) will have the target gene disrupted. Source:
Zepper, Matthias [Creator]. (2008). Cre LoxP Mouse [Image]. Retreived March 2, 2014, from: <
http://php.med.unsw.edu.au/cellbiology/index.php?title=File:CreLoxP_mouse.png>.
Male KO mice and littermate controls were weaned at 3-4 weeks and placed on their respective diets. Diet-induced obesity was achieved through a 60% kcal from fat diet over a period of 12-16 weeks. Previous studies have shown that feeding a high fat diet (HFD) results in excess adiposity leading to obesity (33). In addition to inducing weight gain, HFDs are known to be pro-inflammatory, further mimicking the desired model of obesity (32). In addition, mice on a HFD have been shown to develop insulin resistance after just 4 weeks on the diet (22). Control mice were fed a standard chow diet (14.02% kcal from fat). To document that the mice became obese, all mice of interest were weighed over a 12-16 week period on their respective diets. All mice were housed in isolation cubicles at the University of North Carolina at Chapel Hill (fully accredited by the American Association for Accreditation of Laboratory Animal Care). The University of North Carolina Institutional Animal Care and Use Committee approved all experimental procedures involving mice.
3.3 Genotyping
Genotyping is the process of determining the genetic makeup of a living thing by
analyzing its DNA sequence (34). Genotyping is particularly useful for this paper as it allows us to determine the differences in the genetic makeup of our mice. To begin, the tips of the tails were removed. The tails were then placed in Proteinase K and Proteinase K buffer at 55°C for
5-6 hours in order to digest protein and neutralize DNA nucleases. The samples were then vortexed, and a saturated NaCl solution was added. Samples were centrifuged, and the
quantifies DNA by measuring the absorbance values of sample DNA in cuvettes relative to a blank (water).
PCR (Polymerase Chain Reaction) is a method of DNA amplification developed by Kary Mullis in 1983. It relies on the ability of DNA polymerase to synthesize new strands of DNA that are complementary to the template strand. Because DNA polymerase may only add base
nucleotide sequences to the 3’ end of DNA, it requires a primer to which it can bind and add its first nucleotide. This primer is specially chosen to match a target region of the template strand that the researcher wants to amplify, thus allowing for the amplification of millions of copies of a particular DNA sequence or gene sequence. This process relies on thermal cycling, whereby repeating cycles of heating and cooling occur to cause DNA melting and separation followed by enzymatic replication of the DNA by DNA polymerase. As PCR progresses, the newly generated DNA strands can be used as templates leading to a chain reaction of exponential DNA
Cre bands in our final genotype as a safeguard to ensure that mice have the ability to have an altered genome in their T cells.
The next step was to create a gel through which our newly amplified DNA could migrate through gel electrophoresis. This was accomplished through a combination of agarose, TAE buffer, and ethidium bromide. Before the samples were loaded into the wells of the gel, a loading dye was added to ensure that the DNA did not escape the wells. DNA is negatively charged allowing for the migration of DNA from an anode (negative) to a cathode (positive) based on size alone. Using 70 V, the DNA was run through the gel for approximately 1 hour. Once
migration had occurred, the gel was imaged in the Makowski laboratory within the UNC Gillings School of Global Public Health. Imaging relied on UV light interacting with the ethidium
bromide attached to the DNA.
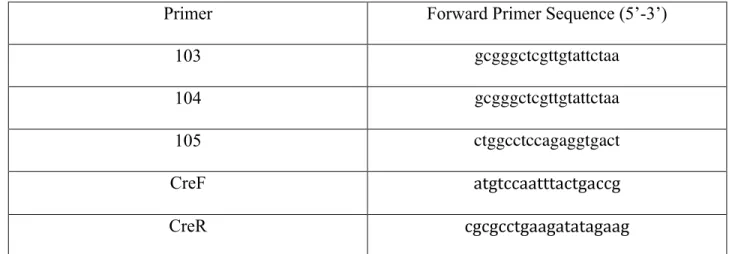
Primers and Their Sequences for PCR
Primer Forward Primer Sequence (5’-3’)
103 gcgggctcgttgtattctaa
104 gcgggctcgttgtattctaa
105 ctggcctccagaggtgact
CreF atgtccaatttactgaccg
CreR cgcgcctgaagatatagaag
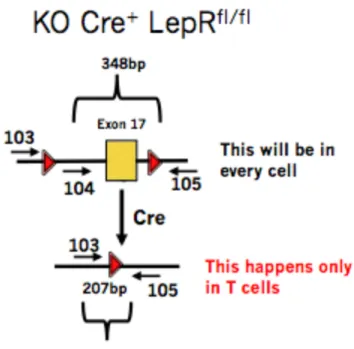
Figure 3. For a KO mouse, PCR would amplify a 348 base pair floxed DNA segment from all other cells as well as a 207 base pair segment, but only for T cells as Cre is only expressed in T cells in our model.
3.4 Western Blotting
Western blotting is a technique utilizing specific antibodies by which researchers can identify proteins separated from one another through gel electrophoresis based on size. Once proteins have migrated through the gel, the gel is placed next to a membrane (the blot), in our case a nitrocellulose membrane. Electric current is then used to transfer the proteins from the gel onto the membrane, a now perfect replica of the protein pattern originally on the gel. The
Before western blotting could occur, we had to isolate T cell proteins and quantify them. The Dynal Mouse T cell Negative Isolation Kit was used. Spleen cells were isolated from both a control and KO mouse. Antibodies were added to bind to non-T cells. Beads were then added that bound to non-Tells, and then a magnet was used to separate T cells from non-T cells. Using isolated T cells, protein was obtained utilizing Lysis buffer and homogenization. To quantify the amount of protein obtained, a BCA protein assay kit was utilized. Samples were stored at -80°C.
The western blot is the “gold standard” for demonstrating the presence or lack of a specific protein. Therefore, we attempted to optimize a western blot protocol capable of detecting leptin receptor in normal mouse T cells while failing to detect the truncated leptin receptor in KO mice. To begin, 4-20% precast polyacrylamide gel from Bio-Rad was placed within a Bio-Rad electrophoresis cell. Running buffer was created using 100 mL of ultra pure 10x Tris/Glycine/SDS from National Diagnostics mixed with 900 mL of distilled H2O. This solution was then added to the electrophoresis cell until the wells of the gel were covered in running buffer. Protein samples were diluted 1:1 in 2x Laemmli Sample Buffer from Bio-Rad. Sample and buffer volumes varied depending on the desired protein concentration for each well of the gel. After mixing with buffer, the samples were incubated for 5 minutes at 95°C. Upon
completion of incubation, the samples were ready to be added to the gel within the
electrophoresis cell. A protein ladder was loaded for reference followed by the samples. Once loading had occurred, the power source was turned on, and the proteins were allowed to migrate down the gel at 200 V for approximately 40 minutes.
of methanol and 700 mL of distilled H2O. For transfer, we utilized the Bio-Rad Trans-Blot Turbo Transfer System, allowing us to transfer the protein bands from the gel to a nitrocellulose
membrane.
Once transfer was complete, the membrane was agitated overnight at 4°C in 5% non-fat
milk (blocking buffer) mixed in TBST from National Diagnostics. This blocking step was very important to prevent the nonspecific binding of antibodies later. After incubation, the membrane was washed 3 times with TBST for 5 minutes each under agitation. Primary antibodies for both leptin receptor (anti-LepR from Abcam) and β-actin (anti-β-actin) were then diluted in 10 mL of
blocking buffer and added to the membrane. Incubation occurred for 1 hour under agitation. After time had expired, the membrane was washed once for 15 minutes in TBST under agitation and then 2 times in TBST for 5 minutes each. Secondary antibodies for both leptin primary antibody (HRP Donkey anti-rabbit IgG) and β-actin primary antibody (HRP Goat anti-mouse IgG) were diluted in 10 mL of blocking buffer and added to the membrane. This incubation was also allowed to occur for 1 hour under agitation. The blot was washed once for 15 minutes in TBST under agitation and then 2 times in TBST for 5 minutes each again. The blot was then washed in TBS from National Diagnostics for 5 minutes under agitation to remove Tween-20. After pouring out the TBS, distilled H2O was added to the blot to remove any TBS. An ECL detection solution from BioExpress was then created. This solution was then added to the
Figure 4. Western blotting relies on a primary antibody binding to the protein of interest on the blot. Shortly after, a secondary antibody conjugated to a detection molecule recognizes and binds to the primary antibody, giving off a detection signal when the proper enzyme substrate is
present. Source: Detection in Western Blots [Image]. Retrieved March 3, 2014, from: <http://www.leinco.com/general_wb>.
3.5 Fasting Blood Glucose
FreeStyle Lite glucose strips to give a blood glucose reading. These measurements were repeated twice for each mouse and averaged in an attempt to control for random variation in the
instrument. Dividing each mouse by genotype and weight status, the values were then compared. 3.6 Statistical Analysis
Results 4.1 Genotyping
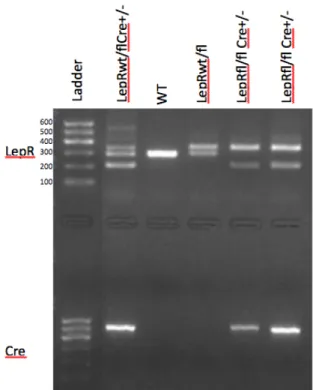
Mice were successfully genotyped beginning at 2 weeks of age. Upon genotyping, we knew which mice should have T cell leptin receptor dysfunction. In total, 15 mice were
Figure 5. This is an example genotype image revealing the DNA makeup of mice. A protein ladder reference with base pair size is provided.
4.2 Western Blot
After a significant amount of trial and error, an optimized protocol for western blotting to reveal leptin receptor protein in T cells was achieved. We applied both leptin receptor and
Figure 6. This western blot shows both leptin receptor and β-actin. Proteins were identified using a protein ladder for reference.
4.3 Mouse Weights and Diet-Induced Obesity
Weight Gain in Experimental Mice Groups Over a 15-week Period
Figure 7. This figure compares the weight status of mice stratified by experimental group over a 15-week period on their respective diets. CD here stands for chow diet. Mice of the lean groups (LepRTfl/fl CD and LepRT-/- CD) gain weight at a significantly slower rate compared to mice of the obese groups (LepRTfl/fl HFD and LepRT-/- HFD).
4.4 Fasting Blood Glucose
Initially, normal mice were compared solely based on weight status (obese vs. lean) to support the well-known idea that obese mice have higher fasting glucose than lean mice. This comparison is made in the graph below (See Figure 8.). Indeed, control obese mice (Obese LepRTfl/fl) have higher fasting blood glucose compared to control lean mice (Lean LepRTfl/fl) averaging at 94.2 mg/dL and 65.1 mg/dL respectively. These results were considered to be statistically significant with a p-value of less than 0.05.
Knockout (Lean LepRT-/-), Obese Leptin Receptor T Cell Floxed/Floxed (Obese LepRTfl/fl), and Obese Leptin Receptor T Cell Knockout (Obese LepRT-/-) mice. These results are presented in the graph below (See Figure 9.). As we expected, both the Lean LepRTfl/fl and Lean LepR T-/-groups had significantly lower fasting blood glucose levels than the obese mice with 65.1 mg/dL and 65.2 mg/dL respectively. These results were statistically significant as they had a p-value of less than 0.05. Although both the obese groups had higher average fasting blood glucose
compared to the lean groups, the Obese LepRTfl/fl group had an average fasting blood glucose level of 94.3 mg/dL while the Obese LepRT-/- group had an average fasting blood glucose level of 84.6 mg/dL, suggesting that the knocking out of the leptin receptor in T cells may have had a slight effect on blood glucose levels. However, these results only represented a trend and were not statistically significant.
Comparing Fasting Blood Glucose Levels in Lean and Obese Mice
!
Fasting Glucose Among Mice Divided by Experimental Group!
!
Figure!9.!This!graph!compares!the!average!fasting!blood!glucose!levels!among!all! experimental!groups.!Both!Lean!LepRTfl/fl!mice!and!Lean!LepRTF/F!mice!exhibited! significantly!lower!fasting!glucose!levels!than!the!two!obese!groups.!However,!in!
comparing!Obese!LepRTfl/fl!mice!to!Obese!LepRTF/F!mice,!the!results!were!not!significant.! Results!were!considered!statistically!significant!with!a!pFvalue!of!less!than!0.05.!!
Discussion
Previous studies have indicated that obesity gives rise to a state of low-grade, chronic inflammation, likely as a result of a combination of increased adipokine production, macrophage infiltration, and pro-inflammatory immune cell activation (5). Research over the past couple of decades has given insight into exactly how adipocytes and macrophages may contribute to adipose inflammation. However, the precise role that T cells play in the inflammatory cascade still remains largely unclear. A recent study by Deng et al. suggested that leptin from adipocytes may lead to the activation of T cells thus propagating the inflammatory cascade associated with obesity. The systemic inflammation caused by obesity is thought to be causative of a host of chronic conditions including insulin resistance and diabetes (22). Moreover, Deng et al. reports that inflammatory T cell activation may indeed contribute to insulin resistance. Given the proposed interaction of leptin, T cells, inflammation, and insulin resistance, this lab sought to further explore this interaction by measuring hyperglycemia levels in leptin receptor T cell knockout mice.
5.1 Diet-Induced Obesity
As expected, diet-induced obesity was successfully achieved in mice fed a HFD. As evidenced by the graph in Figure 7, HFD mice and chow diet (CD) mice diverge in weight status approximately 4 weeks after the diet began with HFD mice becoming increasingly obese
overtime. Importantly, groups of the same weight status gain weight at a consistent rate, allowing us to rule out any difference in weight gain as a potential confounding factor for the results obtained.
In reference to Figure 5, this lab successfully genotyped mice according to DNA sequence. Clear DNA band differences are seen between wild type mice, heterozygous double floxed mice without Cre, heterozygous double floxed mice with Cre, and homozygous floxed mice with Cre. Successful genotyping was very important as a way to organize the mice into their proper experimental group for this study.
5.3 Western Blotting
Although an optimal protocol for western blotting was discovered, we were unable to prevent our leptin receptor antibody from binding within the Leptin Receptor T Cell KO mouse (LepRT-/-) lane. We believe that this binding occurred because our leptin receptor is not
completely removed but is rather truncated to prevent its functionality. Moreover, we believe that our specific primary antibody is still able to recognize a sequence of the leptin receptor protein that is not truncated in our model. This recognition would lead to its binding, even if the leptin receptor is in fact truncated and dysfunctional. In the future, this lab will purchase other primary antibodies in an attempt to discover one that specifically binds to the missing part of the leptin receptor in our model, thereby having the ability to show a difference between Leptin Receptor T Cell Floxed/Floxed mice (LepRTfl/fl) and Leptin Receptor T Cell KO mice (LepRT-/-). 5.4 No Significant Difference Between Fasting Blood Glucose of Obese Mouse Groups
Therefore, we cannot conclude that Obese LepRT-/- mice have less hyperglycemia compared to control Obese LepRTfl/fl mice. Although not statistically different, there was a trend for the Obese LepRT-/- mice (average glucose measurement of 84.6 mg/dL) to have lower fasting glucose compared with the control Obese LepRTfl/fl mice (average glucose measurement of 94.3 mg/dL), and, therefore, it is possible that by repeating this experiment and increasing the sample size, we may observe a significantly different level of hyperglycemia between the two groups. As
mentioned previously, adipose inflammation and the resulting insulin resistance are likely due to a number of players, not just inflammatory T cell activation. Moreover, it makes sense that a large sample size would be needed in order to detect a smaller difference in fasting glucose levels if adipose inflammation is indeed a result of multiple causes. Therefore, although our hypothesis cannot be accepted, futures studies concerning T cells, leptin, adipose inflammation, and hyperglycemia are still warranted.
5.5 Limitations
before the food was taken away while others may have not eaten for a few hours before that. If fasting varied, this unequal eating pattern could lead to faulty comparisons between glucose measurements. Finally, fasting blood glucose is a crude measurement of insulin resistance. In humans, fasting blood glucose is often used as a surrogate index for insulin sensitivity/diabetes. However, mice may respond differently to fasting as their eating patterns differ significantly from humans’. Therefore, investigators must be careful not to over-interpret any results from fasting blood glucose alone in mice (37).
5.6 Conclusion and Future Studies
Assuming that leptin released from adipocytes activates T cells and causes them to release pro-inflammatory cytokines such as IFNγ, it follows that leptin’s interaction with T cells may very well lead to adipose inflammation and thus contribute to insulin resistance and
hyperglycemia in obese mice. We therefore hypothesized that by blocking leptin’s interaction with T cells through the use of obese leptin receptor T cell knockout mice, hyperglycemia may be reduced in these mouse models. However, although these mice showed slightly lower levels of hyperglycemia compared to control obese mice, the differences were not significant.
Therefore, we are unable to conclude from this study that leptin’s proposed activation of T cells during obesity contributes to hyperglycemia.
group is increased significantly so as to discover if our original hypothesis may hold true. In addition, this study should make use of other measurements besides fasting blood glucose, such as glucose tolerance tests, insulin ELISAs (Enzyme Linked Immunosorbent Assay), and insulin tolerance tests, to more fully ascertain the effect of leptin signaling to T cells on insulin
sensitivity. Furthermore, a future study could look at differences in adipose inflammation between leptin receptor T cell knockout obese mice and control obese mice. If inflammation in the KO mice was indeed less, we would expect that insulin resistance and thus hyperglycemia would be lowered as well. For instance, one could measure the cytokine IFNγ in the WAT of the KO mouse and compare these to levels in the WAT of the control obese mouse, expecting to see significantly lower levels of IFNγ in the KO mouse if leptin truly activates T cells during obesity.
References
1. Obesity and overweight. WHO. Mar. 2013. Accessed: Feb 28, 2014. <http://www.who.int/mediacentre/factsheets/fs311/en/>.
2. Shoelson, S. E., Herrero, L., & Naaz, A. (2007). Obesity, inflammation, and insulin resistance.
Gastroenterology, 132(6), 2169-2180.
3. Jung, R. T. (1997). Obesity as a disease. British Medical Bulletin, 53(2), 307-321.
4. AMA Adopts New Policies on Second Day of Voting at Annual Meeting. AMA. Jun. 2013. Accessed: Feb 28, 2014. < http://www.ama-assn.org/ama/pub/news/news/2013/2013-06-18-new-ama-policies-annual-meeting.page>
5. Johnson, A. R., Justin Milner, J., & Makowski, L. (2012). The inflammation highway:
metabolism accelerates inflammatory traffic in obesity. Immunological reviews, 249(1), 218-238.
6. Xu, H., Barnes, G. T., Yang, Q., Tan, G., Yang, D., Chou, C. J., ... & Chen, H. (2003).
Chronic inflammation in fat plays a crucial role in the development of obesity-related insulin
resistance. Journal of Clinical Investigation, 112(12), 1821-1830.
7. Wisse, B. E. (2004). The inflammatory syndrome: the role of adipose tissue cytokines in
metabolic disorders linked to obesity. Journal of the American Society of Nephrology, 15(11),
2792-2800.
8. Trayhurn, P. (2005). Endocrine and signaling role of adipose tissue: new perspectives on fat.
Acta Physiologica Scandinavica, 184(4), 285-293.
9. Lumeng, C. N., Bodzin, J. L., & Saltiel, A. R. (2007). Obesity induces a phenotypic switch in
adipose tissue macrophage polarization. Journal of Clinical Investigation, 117(1), 175-184.
10. Gordon, S., & Martinez, F. O. (2010). Alternative activation of macrophages: mechanism
11. Lumeng, C. N., Bodzin, J. L., & Saltiel, A. R. (2007). Obesity induces a phenotypic switch in
adipose tissue macrophage polarization. Journal of Clinical Investigation, 117(1), 175-184.
12. Weisberg, S. P., McCann, D., Desai, M., Rosenbaum, M., Leibel, R. L., & Ferrante, A. W.
(2003). Obesity is associated with macrophage accumulation in adipose tissue. Journal of
Clinical Investigation, 112(12), 1796-1808.
13. Winer, D. A., Winer, S., Chng, M. H., Shen, L., & Engleman, E. G. (2013). B Lymphocytes
in obesity-related adipose tissue inflammation and insulin resistance. Cellular and Molecular
Life Sciences, 1-11.
14. Duffaut, C., Galitzky, J., Lafontan, M., & Bouloumié, A. (2009). Unexpected trafficking of
immune cells within the adipose tissue during the onset of obesity. Biochemical and biophysical
research communications, 384(4), 482-485.
15. Wu, L., Parekh, V. V., Gabriel, C. L., Bracy, D. P., Marks-Shulman, P. A., Tamboli, R. A., ...
& Van Kaer, L. (2012). Activation of invariant natural killer T cells by lipid excess promotes
tissue inflammation, insulin resistance, and hepatic steatosis in obese mice. Proceedings of the
National Academy of Sciences, 109(19), E1143-E1152.
16. Elgazar-Carmon, V., Rudich, A., Hadad, N., & Levy, R. (2008). Neutrophils transiently
infiltrate intra-abdominal fat early in the course of high-fat feeding. Journal of lipid research,
49(9), 1894-1903.
17. Maizels, R. M., & Allen, J. E. (2011). Eosinophils forestall obesity. science, 332(6026), 186-
18. Kintscher, U., Hartge, M., Hess, K., Foryst-Ludwig, A., Clemenz, M., Wabitsch, M., ... &
Marx, N. (2008). T-lymphocyte Infiltration in Visceral Adipose Tissue A Primary Event in
Adipose Tissue Inflammation and the Development of Obesity-Mediated Insulin Resistance.
19. Nishimura, S., Manabe, I., Nagasaki, M., Eto, K., Yamashita, H., Ohsugi, M., ... & Nagai, R.
(2009). CD8+ effector T cells contribute to macrophage recruitment and adipose tissue
inflammation in obesity. Nature medicine, 15(8), 914-920.
20. Ilan, Y., Maron, R., Tukpah, A. M., Maioli, T. U., Murugaiyan, G., Yang, K., ... & Weiner,
H. L. (2010). Induction of regulatory T cells decreases adipose inflammation and alleviates
insulin resistance in ob/ob mice. Proceedings of the National Academy of Sciences, 107(21),
9765-9770.
21. Biswas, S. K., & Mantovani, A. (2010). Macrophage plasticity and interaction with
lymphocyte subsets: cancer as a paradigm. Nature immunology, 11(10), 889-896.
22. Deng, T., Lyon, C. J., Minze, L. J., Lin, J., Zou, J., Liu, J. Z., ... & Hsueh, W. A. (2013).
Class II major histocompatibility complex plays an essential role in obesity-induced adipose
inflammation. Cell metabolism, 17(3), 411-422.
23. Lago, R., Gómez, R., Lago, F., Gómez-Reino, J., & Gualillo, O. (2008). Leptin beyond body
weight regulation—current concepts concerning its role in immune function and inflammation.
Cellular immunology, 252(1), 139-145.
24. Lord, G. M., Matarese, G., Howard, J. K., Baker, R. J., Bloom, S. R., & Lechler, R. I. (1998).
Leptin modulates the T-cell immune response and reverses starvation-induced
immunosuppression. Nature, 394(6696), 897-901.
25. Pacifico, L., Di Renzo, L., Anania, C., Osborn, J. F., Ippoliti, F., Schiavo, E., & Chiesa, C.
(2006). Increased T-helper interferon-γ-secreting cells in obese children. European journal of
26. Wong, N., Fam, B. C., Cempako, G. R., Steinberg, G. R., Walder, K., Kay, T. W., ... &
Andrikopoulos, S. (2011). Deficiency in interferon-γ results in reduced body weight and better
glucose tolerance in mice. Endocrinology, 152(10), 3690-3699.27.
27. National Diabetes Statistics, 2011. National Diabetes Information Clearing House. Feb. 2011. Accessed: Feb 28, 2014. <http://www.diabetes.niddk.nih.gov/dm/pubs/statistics/#fast>. 28. Age-Adjusted Percentage of Adults Aged18 Years or Older with Diagnosed Diabetes Who Have Risk Factors for Complications, United States, 2010. CDC. Apr. 2012. Accessed: Feb 28,
2014. <http://www.cdc.gov/diabetes/statistics/comp/fig10.htm>.
29. Sartipy, P., & Loskutoff, D. f J. (2003). Monocyte chemoattractant protein 1 in obesity and insulin resistance. Proceedings of the National Academy of Sciences, 100(12), 7265-7270.
30. Wang, C. Y., & Liao, J. K. (2012). A mouse model of diet-induced obesity and insulin
resistance. In mTOR (pp. 421-433). Humana Press.
31. Kühn, R., & Schwenk, F. (2002). Conditional knockout mice. In Transgenic Mouse (pp.
159-185). Humana Press.
32. Gianazza, E., Sensi, C., Eberini, I., Gilardi, F., Giudici, M., & Crestani, M. (2013).
Inflammatory serum proteome pattern in mice fed a high-fat diet. Amino acids, 44(3),
1001-1008.
33. Surwit, R. S., Kuhn, C. M., Cochrane, C., McCubbin, J. A., & Feinglos, M. N. (1988).
Diet-induced type II diabetes in C57BL/6J mice. Diabetes, 37(9), 1163-1167.
34. What is Genotyping and Expression Profiling? Coriell Institute For Medical Research.
Accessed: Mar. 28, 2014. <https://
35. Erlich, H. A. (1989). PCR technology. Principles and applications for DNA amplification.
Stockton press.
36. Mahmood, T., & Yang, P. C. (2012). Western blot: technique, theory, and trouble shooting.
North American journal of medical sciences, 4(9), 429-434.
37. Ayala, J. E., Samuel, V. T., Morton, G. J., Obici, S., Croniger, C. M., Shulman, G. I., ... &
McGuinness, O. P. (2010). Standard operating procedures for describing and performing
metabolic tests of glucose homeostasis in mice. Disease models & mechanisms, 3(9-10),
525-534.
38. Zepper, Matthias [Creator]. (2008). Cre LoxP Mouse [Image]. Retreived March 2, 2014,
from: < http://php.med.unsw.edu.au/cellbiology/index.php?title=File:CreLoxP_mouse.png>.
39. Detection in Western Blots [Image]. Retrieved March 3, 2014, from:
<http://www.leinco.com/general_wb>.
40. Hucklebridge, F. H., Clow, A., Abeyguneratne, T., wHuezo-Diaz, P., & Evans, P. (1999).