'•
by
Subodh Rajesh Selukar
Senior Honors Thesis Department of Biostatistics University of North Carolina at Chapel Hill
Spring 2016
April 6, 2016
Abstract
Roughly 1 in 20 people in the United States suffers from temporomandibular disorders (TMD), a
set of disorders with symptoms ranging from mild jaw pain to chronic, debilitating pain. Prior research
has indicated that patients with TMD may have more conditions comorbid to TMD (such as back pain or
fibromyalgia), and experts have called for further work to increase awareness of a possible relationship
between comorbid conditions and pain sensitivity. Using data from the Orofacial Pain: Prospective
Evaluation and Risk Assessment (OPPERA) project’s case-control study, we address this problem. We
used regression methods to determine if the number of painful comorbid conditions was associated with
33 different pain measures. We also adjusted for possible biases due to the sampling design using
Inverse Probability Weighting (IPW) and also for multiple testing using Bonferroni adjustment. After
these adjustments, we found that pressure pain measures were significantly associated with the number of
comorbid conditions, but that in general other measures of pain sensitivity were not. Also, no association
was detected when looking at cases versus controls individually. The surprising results that pain type
had differential significance and that case status did not raises questions that warrant further research
(alternatively, this may be due to decreased sample size to detect a difference between cases and controls).
Despite this, there did exist conclusive results to suggest that, at least for pressure pain measures, there
Introduction
The term temporomandibular disorders (TMD) encompasses a range of musculoskeletal disorders
in which patients present with symptoms ranging from mild pain to chronic, debilitating pain in the
temporomandibular region, even limiting jaw function. The National Health Interview Study found an
overall prevalence of TMD of 4.6% in their sample representative of the US population, underscoring
a need to better understand TMD. [1] In particular, Limet al. described the clinical problems of an
elderly woman presenting with TMD alongside other conditions comorbid to TMD including irritable
bowel syndrome, constant headaches and fibromyalgia. This woman motivated Lim to examine the
importance of understanding the relationship between TMD and comorbid conditions by reviewing
current literature, and she summarized studies which found putative relationships between TMD and
various conditions such as chronic widespread pain. [2] Hoffmannet al.further explored this relationship
and found that over 50% of patients with TMD also experienced chronic pain, tension or migraine
headaches and allergies, significantly differing from control patients. [3]
The data for this paper emerge from the Orofacial Pain: Prospective Evaluation and Risk
As-sessment (OPPERA) study. Maixner et al. introduced the landmark study with its major aims in
understanding the sociodemographic and clinical factors predictive of TMD, psychological determinants
of TMD onset and persistence, genetic factors influencing the risk of TMD onset and persistence and,
finally, pain amplification as a determinant of TMD onset and persistence, which will be the overarching
aim of this paper as well. [4] The OPPERA project comprises 4 related studies: a prospective cohort
study of TMD onset, a matched case-control of incident TMD, a prospective cohort of TMD incidence
and an unmatched baseline case-control study of chronic TMD. [5] The last study will be the source of
the data utilized in this paper. Data collectors assessed enrolled subjects for TMD and also for clinical
characteristics thought to predict TMD risk, including the presence of conditions comorbid to TMD
status (the definition of comorbidity bears some controversy, but this paper uses a clinical definition of
comorbidity without the implication that comorbid conditions are causally related to TMD [6]). They
also collected quantitative sensory testing (QST) information to measure the response of these subjects
to noxious stimuli including pressure pain, mechanical pain and heat pain. [5]
Greenspanet al. initially looked at the QST pain measures from the OPPERA unmatched
case-control data and examined the differences between TMD cases and case-controls. They observed that cases
responded more strongly (via lower pain threshold or higher experimental pain ratings) to pain stimuli
than did controls, but they did note that the difference in response varied over the different pain measures
the data from the study to examine the difference between cases and controls regarding the prediction
of pain measures by the number of comorbid conditions.
This paper serves to address the issues reported by Lim and to improve the understanding of
pain in the context of comorbid conditions within the TMD population. The analysis centers around
the question: is the number of comorbid conditions associated with the experimental pain measures
within this case-control study? This probes the clinical hypothesis that patients with greater numbers of
comorbid conditions will report higher responses to noxious stimuli. A regression model is constructed for
each pain measure (instead of performing multivariate regression), so special consideration for multiple
hypothesis testing will be given. Overall, examining pain in TMD patients will improve the broader
scientific understanding of pain, which may have important clinical benefits in the future.
Methods
Study Design
This paper examines data from the OPPERA baseline case-control study of chronic TMD whose
methods are described by Sladeet al.in more detail. [5] The target population was subjects between the
ages of 18 and 44, and investigators collected a community-based sample representative of diversity of
the population around the recruitment sites. The data for the unmatched case-control study were taken
during baseline assessments for both cases and controls.
The OPPERA project enrolled 3247 subjects as controls and 1035 chronic TMD cases at baseline.
The project had 4 recruitment sites: Baltimore, MD, Buffalo, NY, Chapel Hill, NC and Gainesville, FL,
and subjects were recruited by word-of-mouth alongside advertisements in local media, emails through
university networks and flyers near academic health centers. Interested subjects telephoned the study
site and then were administered a computer-assisted telephone interview for screening and scheduling
purposes. The project was reviewed and approved by institutional review boards at each study site and
at the data coordinating center, Battelle Memorial Institute. Each participant provided signed consent
to participate in the study.
Data Collection
Prior to the baseline visit, potential study participants completed 15 questionnaires (one of which
was the Comprehensive Pain and Symptom Questionnaire, CPSQ, from which the number of comorbid
visit lasted 3 hours and began with explanations of study procedures and consent followed by additional
questionnaires. Then a trained and calibrated examiner (each of whom was assessed at a reliability
exercise early in the study) assessed participants for TMD and also clinical characteristics that may
be associated with TMD. The TMD case status was assessed with the RDC/TMD criteria. Next,
they performed quantitative sensory testing to measure responses to painful stimuli, including pressure,
mechanical and heat pain (more details are provided below and in Greenspanet al.). The participants
received $100 as compensation for their time. [5]
Pressure pain thresholds were measured using a pressure algometer at 5 body regions bilaterally
in the following order: 1) center of temporalis muscle; 2) center of masseter muscle; 3) overlying the
temperomandibular joint (TMJ); 4) center of the trapezius muscle; 5) overlying the lateral epicondyle.
Pressure was increased at a steady rate of 30 kPa/s, until the participant indicated that they experienced
pain, which the examiner recorded as the threshold. Values of 600 kPa were recorded if the subject did
not report pain after a force of 600 kPa was applied. They repeated the procedure until 2 trials recorded
values within 20 kPa or 5 trials were administered; in both cases, the final value recorded was the mean
of the two trials closest in value.
Mechanical cutaneous (pinprick) pain was assessed using weighted probes applied to the dorsum
of the 2nd to 4th digits. Pain thresholds were determined via a staircase method with 512 mN as the
maximum threshold. Afterward, subjects were given the stimulus for approximately 0.5s and instructed
to report pain intensity (on a 0 to 100 scale where “0” represents “no pain” and “100” represents “the
worst pain imaginable”). Then participants were given a series of 10 stimuli and asked to report the pain
intensity upon termination of the procedure as well as at 15- and 30-second intervals after administration.
This was repeated 4 times each with 256- and 512-mN probes. The temporal summation (or wind-up)
was calculated by taking the difference between the series-of-10 rating and the single stimulus rating.
Heat pain was measured using a thermal stimulator applied to the ventral forearm. The heat
pain threshold was evaluated via a similar process as the pressure pain method (with a maximum of
52◦C). Subjects reported the pain intensity rating at 15- and 30-seconds after a series of 10 stimuli,
which ramped up from 38◦C to 46◦C. This was repeated with peak temperatures of 48◦C and 50◦C,
each conducted at different locations. Ratings were also taken immediately after each of the 10 pulses.
The area under the curve was calculated using these 10 ratings. Temporal summation was determined
first (the delta variable) by the difference between the highest rating and the first rating, and second
Statistical Considerations
The outcome variables for this paper are the values of each pain measure, each treated as
contin-uous. See Table 1 for the variables used (recall: a scale of 0 to 100 was used where 0 indicated “no pain”
and 100 indicated “the worst pain imaginable”). The magnitude and direction of regression parameter
estimates are used to indicate the “effect sizes” of associations in the regression analysis.
Table 1: Pain Measure Variables
Pain Measure Description Abbreviation Unit
Temporalis Pressure Pain Threshold Temporalis kPa
Massester Pressure Pain Threshold Masseter kPa
TMJ Pressure Pain Threshold TMJ kPa
Trapezius Pressure Pain Threshold Trapezius kPa
Epicondyle Pressure Pain Threshold Epicondyle kPa
Mechanical Pain Threshold Mech Threshold mN
Single Stimulus Mechanical Pain 256-mN Single 256 0-100 Scale Single Stimulus Mechanical Pain 512-mN Single 512 0-100 Scale 15s Mechanical Pain Aftersensation 256-mN 15s 256 0-100 Scale 30s Mechanical Pain Aftersensation 256-mN 30s 256 0-100 Scale 15s Mechanical Pain Aftersensation 512-mN 15s 512 0-100 Scale 30s Mechanical Pain Aftersensation 512-mN 30s 512 0-100 Scale
Mechanical Pain Wind-Up 256-mN Windup 256 0-100 Scale
Mechanical Pain Wind-Up 512-mN Windup 512 0-100 Scale
Heat Pain Threshold Heat Threshold ◦C
First Pulse Thermal Stimulus 46◦C First 46 0-100 Scale
First Pulse Thermal Stimulus 48◦C First 48 0-100 Scale
First Pulse Thermal Stimulus 50◦C First 50 0-100 Scale
Net Heat Pain Wind-Up 46◦C Delta 46 0-100 Scale
Net Heat Pain Wind-Up 48◦C Delta 48 0-100 Scale
Net Heat Pain Wind-Up 50◦C Delta 50 0-100 Scale
15s Thermal Stimulus Aftersensation 46◦C 15s 46 0-100 Scale 15s Thermal Stimulus Aftersensation 48◦C 15s 48 0-100 Scale 15s Thermal Stimulus Aftersensation 50◦C 15s 50 0-100 Scale 30s Thermal Stimulus Aftersensation 46◦C 30s 46 0-100 Scale 30s Thermal Stimulus Aftersensation 48◦C 30s 48 0-100 Scale
30s Thermal Stimulus Aftersensation 50◦C 30s 50 0-100 Scale Area Under the Curve Heat Pain Wind-Up 46◦C AUC 46 0-100 Scale Area Under the Curve Heat Pain Wind-Up 48◦C AUC 48 0-100 Scale Area Under the Curve Heat Pain Wind-Up 50◦C AUC 50 0-100 Scale Slope of Regression Line Heat Pain Wind-Up 46◦C Slope 46 0-100 Scale Slope of Regression Line Heat Pain Wind-Up 48◦C Slope 48 0-100 Scale Slope of Regression Line Heat Pain Wind-Up 50◦C Slope 50 0-100 Scale
The predictor variable used in the analysis is the number of comorbid conditions (among 20
comorbidities assessed by the examiners). This count of comorbidities was obtained from question 50,
a checklist of 20 conditions known to be comorbid with TMD, of the CPSQ (see Figure 1 in appendix).
The number was treated as continuous for part of the analysis and also as a categorical variable with 3
(another categorization of 0, 1, 2, and 3 or more was considered but did not have sufficient numbers and
a choice of two levels was not hypothesized to capture the relationship between variables). Study site,
race (with 5 levels: white, black, asian, hispanic and other), gender (2 levels) and age (continuous) were
included as covariates in each model.
LetY be the vector containing values for the ith pain measure, Xc be the vector of counts of
comorbidities as a continuous variable and Zj (j = 1, . . . ,9) be vectors of covariates described above.
Note that there are 9 covariates specified in the model because study site has 3 dummy variables (as
it has 4 levels), race has 4 dummy variables, gender (with only one level) has one variable and age
also only has one variable (because it is continuous). Then the first model used in the analysis is the
multiple linear regression model using the continuous count of comorbidities (note: a univariate model
is constructed for each of the 33 outcome variables):
Y =β0+β1Xc+ 9
X
j=1
γjZj+. (1)
And we use at-test for the hypothesis that the coefficient of Xc is statistically significant from 0, or
H0:β1= 0 HA:β16= 0. (2)
For the second model with comorbidity as a categorical variable, we introduce the two dummy
variablesL1andL2, whereL1=L2= 0 if the observation has 0 comorbidities,L1= 1 andL2= 0 if the
observation has 1 comorbidity, andL1= 0 andL2= 1 if the observation has 2 or more. These variables
replace the continuous variable Xc in the model above, so we have the following (note: a univariate
model is constructed for each of the 33 outcome variables):
Y =β0+β1L1+β2L2+ 9
X
j=1
γjZj+. (3)
We analyze this model with two separate tests: in the first, we use anF test (using the anova
function in R) to examine the null hypothesis that there is no difference between the 3 groups of the
categorical variable:
H0:β1=β2= 0 HA:β1, β26= 0. (4)
constructed for each of the 33 outcome variables):
Y =β0+β1L1+β2L2+ 9
X
j=1
γjZj+
Y =β0+ 9
X
j=1
γjZj+.
We also tested each dummy variable separately, determining if there exists a significant difference
in having 1 comorbid condition over no comorbid conditions, or if there exists such a significant difference
for having 2 or more comorbid conditions over no comorbid conditions. In effect, we conduct the following
two tests separately:
H0:β1= 0 HA:β16= 0 (5)
H0:β2= 0 HA:β26= 0. (6)
Because the sampling design oversampled TMD cases, and we aim to infer on the general
pop-ulation, Monsees et al.advise inverse probability weighting to address possible bias in estimates when
performing tests on the whole data set (when dealing with cases or controls only, no adjustment is
needed). [8] We use an inverse probability weighting scheme that assumes the prevalence of TMD in
the population is approximately 5% (see the discussion for further consideration of this choice). The
estimates for this analysis were obtained by thegeeglmfunction of the geepacklibrary in R.
Because we perform tests on 33 models in each type of analysis, we must adjust for multiple
comparisons to prevent falsely rejecting the null hypothesis due to chance. A common method is the
Bonferroni correction, which adjusts the type I error rate by dividing the desired type I (α= 0.0) error
rate by the number of tests (m= 33).
αadj = α m =
0.05
33 ≈0.002
While this is a crude, often overly conservative, method for adjustment, it will be used in this exploratory
analysis. Thus, we useαadj ≈0.002 to determine whether or not to reject the null hypothesis in each
Results
Demographics and Pain Measure Summary
Table 2 presents a summary of demographic variables used in the study. As expected based on the
sampling design, more controls were enrolled in the study, so imbalances exist with respect to gender,
race and study site. It should be noted that more women were enrolled in the study due to the greater
prevalence of TMD among women. The cases were slightly older than controls, but participants generally
were close to 27.5 years of age.
Table 2: Demographic Variables by Case Status
Chronic TMD Cases Controls Overall
Number 1036 (0.242) 3244 (0.758) 4280
Gender
Male 244 (0.236) 1388 (0.428) 1632
Female 792 (0.764) 1856 (0.572) 2648
Race
White 732 (0.707) 1631 (0.503) 2363
Black 167 (0.161) 1004 (0.309) 1171
Asian 40 (0.039) 299 (0.092) 339
Hispanic 64 (0.062) 211 (0.065) 275
Other 33 (0.032) 99 (0.031) 132
Study Site
Baltimore, MD 321 (0.310) 815 (0.251) 1136
Buffalo, NY 228 (0.220) 797 (0.246) 1025
Chapel Hill, NC 265 (0.256) 874 (0.269) 1139
Gainesville, FL 222 (0.214) 758 (0.234) 980
Age - Mean (SD) 29.32 (7.805) 27.04 (7.793) 27.59 (7.856)
Entries written as “Count (Proportion of Overall)” unless otherwise indicated
Next, we display data on the number of comorbidities in the data in Table 3. TMD cases
gener-ally report a greater number of comorbid conditions than TMD-free controls. After stratifying by the
categorical count of comorbidities, the difference between cases and controls becomes more apparent. A
much larger proportion of cases had more than 2 comorbid conditions.
Table 3: Number of Comorbidities of Subjects by Case Status Chronic TMD Cases Controls Comorbidities - Mean (SD) 0.58 (0.786) 0.10 (0.319) Comorbidities by Category
0 544 (0.525) 2692 (0.830)
1 278 (0.268) 243 (0.075)
2+ 117 (0.113) 20 (0.006)
Entries written as “Count (Proportion of Overall)” unless otherwise indicated
Finally, Tables 4 to 9 show the mean pain score stratified by the categorical comorbid variable. In
comorbidities appeared to have increased pain sensitivity. In Tables 5 to 9, this remains the same for the
entries that correspond to mechanical and heat pain thresholds. For entries that are not threshold values,
if the values increase as the number of comorbid conditions increases, subjects with higher comorbidities
had increased pain sensitivity. Importantly, we consider subjectively the differences between cases and
controls, but we do not conduct any statistical tests for this difference in the regression analysis because
it is outside of the scope of the paper.
Looking at Table 4, we see that the pressure pain thresholds decrease as the number of comorbid
conditions increase. This relationship can be observed both in the overall group and in each of the control
and case subgroups. For the mechanical pain tables, Tables 5 and 6, the overall group again indicates
increased pain sensitivity for subjects with greater comorbid conditions. However, this relationship does
not apply to the controls, and it only applies weakly to the cases. For heat pain in Tables 7 to 9, the
overall group again indicates increased pain sensitivity for subjects with higher comorbidities, but this
does not apply to the Delta variables. Very few variables in either the case or control groups followed this
trend. Notably, the subjects with 2 or more comorbid conditions did indicate increased pain sensitivity
for every variable measured.
Regression Analysis with Continuous Comorbid Variable
First we performed the IPW regression to examine the overall relationship between the number
of comorbid conditions and the pain measure, which is displayed in Table 10 (see model in Equation (1)
and hypotheses in Equation (2)). Using the Bonferroni adjustment, the pain measures for each pressure
pain along with 1 variable in the heat pain category were significantly or associated with the number of
comorbid conditions. Pressure pain measures, in particular, had large effect sizes. More variables were
significantly associated with the number of comorbid conditions before adjustment and had large effect
sizes, so they may be worth exploring in detail.
On the other hand, when looking at cases and controls separately, none of the variables were
significantly associated with the number of comorbid conditions after adjustment (see Tables 11 and
12). Some variables were significantly associated with the number of comorbid conditions prior to
adjustment but many fewer than in the overall tests.
Regression Analysis with Categorical Comorbid Variable
To justify the use of the categorical variable in the model, the first test conducted is the group
Table 5: Mechanical Pain Measures 1 by Count of Comorbidities‡
Threshold† Single 256 Single 512 15s 256 30s 256
Chronic TMD Cases
0 163.99 (135.490) 11.92 (14.263) 20.39 (20.947) 6.16 (10.890) 3.27 (7.569) 1 156.36 (141.286) 12.17 (15.844) 22.22 (23.125) 6.11 (12.794) 3.41 (9.706) 2+ 142.63 (125.150) 16.20 (19.828) 25.49 (26.634) 10.72 (17.738) 7.06 (15.010) Controls
0 252.21 (172.234) 9.29 (13.422) 16.97 (20.358) 3.14 (7.666) 1.55 (4.887) 1 244.31 (169.633) 8.75 (12.066) 16.24 (18.406) 3.06 (6.845) 1.46 (4.418) 2+ 248.28 (135.490) 8.44 (14.263) 18.24 (20.947) 3.40 (10.890) 1.54 (7.569) Overall
0 237.38 (169.841) 9.73 (13.600) 17.54 (20.495) 3.64 (8.371) 1.84 (5.467) 1 197.38 (161.101) 10.58 (14.297) 19.43 (21.247) 4.68 (10.551) 2.50 (7.760) 2+ 158.05 (137.800) 15.07 (19.283) 24.43 (25.997) 9.65 (16.704) 6.26 (14.044)
Entries written as “Mean (SE)”
†Smaller values indicate increasing pain sensitivity in mN
‡Larger values (except threshold) indicate increasing pain sensitivity on a scale of 1 to 100
Table 6: Mechanical Pain Measures 2 by Count of Comorbidities‡
15s 512 30s 512 Windup 256 Windup 512
Chronic TMD Cases
0 13.80 (18.453) 8.25 (14.072) 13.40 (14.361) 21.27 (17.835) 1 13.04 (18.754) 8.03 (15.146) 12.69 (13.624) 20.26 (16.35) 2+ 20.00 (25.26) 13.59 (22.238) 15.45 (15.071) 20.41 (16.327) Controls
0 8.32 (15.081) 4.75 (11.110) 9.78 (12.460) 17.05 (16.637) 1 8.83 (14.989) 4.88 (10.35) 9.40 (11.739) 17.91 (16.672) 2+ 12.32 (18.453) 8.04 (14.072) 8.28 (14.361) 18.98 (17.835) Overall
0 9.24 (15.829) 5.34 (11.732) 10.39 (12.869) 17.76 (16.915) 1 11.08 (17.215) 6.56 (13.211) 11.16 (12.873) 19.16 (16.527) 2+ 18.88 (24.308) 12.78 (21.167) 14.40 (14.584) 20.20 (16.250)
Entries written as “Mean (SE)”
Table 10: Inverse Probability Weighted Regression Table With Continuous Comorbidities N=4280
Pain Measure Estimate (95% CI) P
Pressure Pain Temporalis -18.996 (-25.113, -12.880) <0.001 Masseter -16.679 (-22.388, -10.969) <0.001 TMJ -13.328 (-18.409, -8.247) <0.001 Trapezius -26.292 (-38.365, -14.218) <0.001 Epicondyle -24.542 (-36.940, -12.144) <0.001 Mechanical Pain Mech Threshold -17.005 (-30.866, -3.144) 0.016
Single 256 0.697 (-0.392, 1.786) 0.210 Single 512 0.687 (-0.929, 2.304) 0.405
15s 256 0.848 (0.212, 1.483) 0.009
30s 256 0.555 (0.111, 0.999) 0.014
15s 512 1.569 (0.250, 2.888) 0.020
30s 512 1.071 (0.099, 2.044) 0.031
Windup 256 0.344 (-0.628, 1.316) 0.488 Windup 512 0.820 (-0.55, 2.189) 0.241 Heat Pain Heat Threshold -0.142 (-0.315, 0.030) 0.106
First 46 1.786 (-0.875, 4.447) 0.188
First 48 2.199 (-0.437, 4.834) 0.102
First 50 2.119 (-0.521, 4.759) 0.116
Delta 46 0.803 (-1.473, 3.079) 0.489
Delta 48 0.779 (-1.396, 2.953) 0.483
Delta 50 0.767 (-1.500, 3.034) 0.507
15s 46 1.899 (0.450, 3.348) 0.010
15s 48 2.539 (0.881, 4.197) 0.003
15s 50 3.188 (1.371, 5.005) <0.001
30s 46 0.988 (-0.086, 2.063) 0.071
30s 48 1.062 (-0.145, 2.269) 0.085
30s 50 2.031 (0.658, 3.405) 0.004
AUC 46 24.866 (1.228, 48.504) 0.039
AUC 48 25.532 (3.929, 47.135) 0.021
AUC 50 28.834 (9.551, 48.118) 0.003
Slope 46 0.365 (-0.339, 1.069) 0.310
Slope 48 0.495 (-0.222, 1.211) 0.176
Slope 50 0.865 (0.0120, 1.718) 0.047
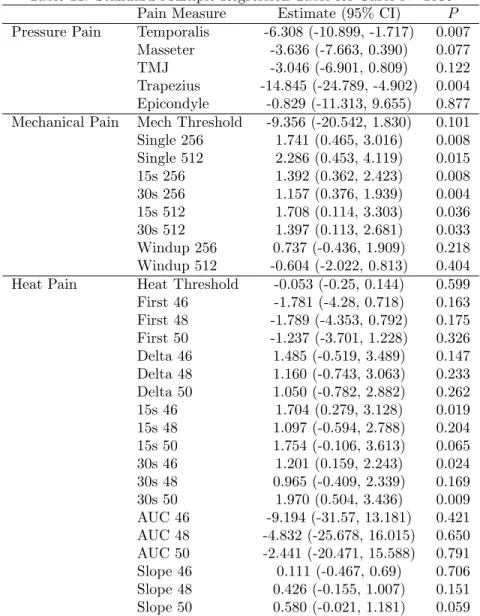
Table 11: Standard Multiple Regression Table for Cases N=1036
Pain Measure Estimate (95% CI) P
Pressure Pain Temporalis -6.308 (-10.899, -1.717) 0.007 Masseter -3.636 (-7.663, 0.390) 0.077
TMJ -3.046 (-6.901, 0.809) 0.122
Trapezius -14.845 (-24.789, -4.902) 0.004 Epicondyle -0.829 (-11.313, 9.655) 0.877 Mechanical Pain Mech Threshold -9.356 (-20.542, 1.830) 0.101 Single 256 1.741 (0.465, 3.016) 0.008 Single 512 2.286 (0.453, 4.119) 0.015
15s 256 1.392 (0.362, 2.423) 0.008
30s 256 1.157 (0.376, 1.939) 0.004
15s 512 1.708 (0.114, 3.303) 0.036
30s 512 1.397 (0.113, 2.681) 0.033
Windup 256 0.737 (-0.436, 1.909) 0.218 Windup 512 -0.604 (-2.022, 0.813) 0.404 Heat Pain Heat Threshold -0.053 (-0.25, 0.144) 0.599 First 46 -1.781 (-4.28, 0.718) 0.163 First 48 -1.789 (-4.353, 0.792) 0.175 First 50 -1.237 (-3.701, 1.228) 0.326 Delta 46 1.485 (-0.519, 3.489) 0.147 Delta 48 1.160 (-0.743, 3.063) 0.233 Delta 50 1.050 (-0.782, 2.882) 0.262
15s 46 1.704 (0.279, 3.128) 0.019
15s 48 1.097 (-0.594, 2.788) 0.204
15s 50 1.754 (-0.106, 3.613) 0.065
30s 46 1.201 (0.159, 2.243) 0.024
30s 48 0.965 (-0.409, 2.339) 0.169
30s 50 1.970 (0.504, 3.436) 0.009
AUC 46 -9.194 (-31.57, 13.181) 0.421 AUC 48 -4.832 (-25.678, 16.015) 0.650 AUC 50 -2.441 (-20.471, 15.588) 0.791
Slope 46 0.111 (-0.467, 0.69) 0.706
Slope 48 0.426 (-0.155, 1.007) 0.151 Slope 50 0.580 (-0.021, 1.181) 0.059
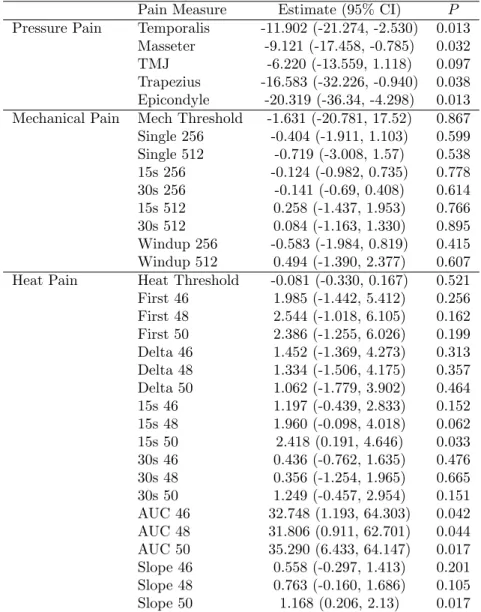
Table 12: Standard Multiple Regression Table for Controls N=3244
Pain Measure Estimate (95% CI) P
Pressure Pain Temporalis -11.902 (-21.274, -2.530) 0.013 Masseter -9.121 (-17.458, -0.785) 0.032
TMJ -6.220 (-13.559, 1.118) 0.097
Trapezius -16.583 (-32.226, -0.940) 0.038 Epicondyle -20.319 (-36.34, -4.298) 0.013 Mechanical Pain Mech Threshold -1.631 (-20.781, 17.52) 0.867 Single 256 -0.404 (-1.911, 1.103) 0.599 Single 512 -0.719 (-3.008, 1.57) 0.538 15s 256 -0.124 (-0.982, 0.735) 0.778
30s 256 -0.141 (-0.69, 0.408) 0.614
15s 512 0.258 (-1.437, 1.953) 0.766
30s 512 0.084 (-1.163, 1.330) 0.895
Windup 256 -0.583 (-1.984, 0.819) 0.415 Windup 512 0.494 (-1.390, 2.377) 0.607 Heat Pain Heat Threshold -0.081 (-0.330, 0.167) 0.521 First 46 1.985 (-1.442, 5.412) 0.256 First 48 2.544 (-1.018, 6.105) 0.162 First 50 2.386 (-1.255, 6.026) 0.199 Delta 46 1.452 (-1.369, 4.273) 0.313 Delta 48 1.334 (-1.506, 4.175) 0.357 Delta 50 1.062 (-1.779, 3.902) 0.464
15s 46 1.197 (-0.439, 2.833) 0.152
15s 48 1.960 (-0.098, 4.018) 0.062
15s 50 2.418 (0.191, 4.646) 0.033
30s 46 0.436 (-0.762, 1.635) 0.476
30s 48 0.356 (-1.254, 1.965) 0.665
30s 50 1.249 (-0.457, 2.954) 0.151
AUC 46 32.748 (1.193, 64.303) 0.042
AUC 48 31.806 (0.911, 62.701) 0.044
AUC 50 35.290 (6.433, 64.147) 0.017
Slope 46 0.558 (-0.297, 1.413) 0.201 Slope 48 0.763 (-0.160, 1.686) 0.105
Slope 50 1.168 (0.206, 2.13) 0.017
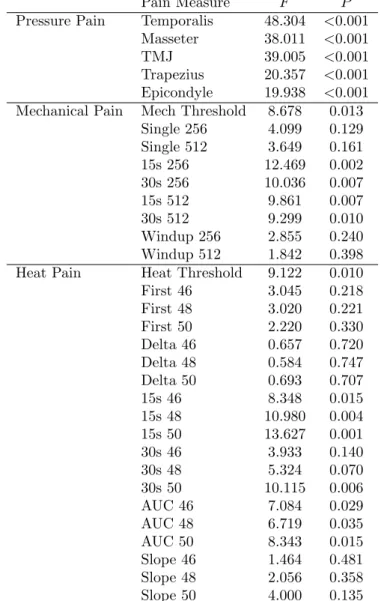
Table 13: Inverse Probability Weighted Group Test with Categorical Comorbidities N=4280
Pain Measure F P
Pressure Pain Temporalis 48.304 <0.001 Masseter 38.011 <0.001
TMJ 39.005 <0.001
Trapezius 20.357 <0.001 Epicondyle 19.938 <0.001 Mechanical Pain Mech Threshold 8.678 0.013
Single 256 4.099 0.129
Single 512 3.649 0.161
15s 256 12.469 0.002
30s 256 10.036 0.007
15s 512 9.861 0.007
30s 512 9.299 0.010
Windup 256 2.855 0.240
Windup 512 1.842 0.398
Heat Pain Heat Threshold 9.122 0.010
First 46 3.045 0.218
First 48 3.020 0.221
First 50 2.220 0.330
Delta 46 0.657 0.720
Delta 48 0.584 0.747
Delta 50 0.693 0.707
15s 46 8.348 0.015
15s 48 10.980 0.004
15s 50 13.627 0.001
30s 46 3.933 0.140
30s 48 5.324 0.070
30s 50 10.115 0.006
AUC 46 7.084 0.029
AUC 48 6.719 0.035
AUC 50 8.343 0.015
Slope 46 1.464 0.481
Slope 48 2.056 0.358
Slope 50 4.000 0.135
See model in Equation (3) and hypotheses in Equation (4)
comorbid variable (see model in Equation (3) and hypotheses in Equation (4)). These results are
presented in Tables 13 to 15. As before, in Table 13 the pressure pain variables were significantly
associated with the number of comorbid conditions, while one mechanical and one heat pain measure
each were significantly associated with the number of comorbid conditions. As expected, more variables
also were significantly associated with the number of comorbid conditions prior to adjustment, so they
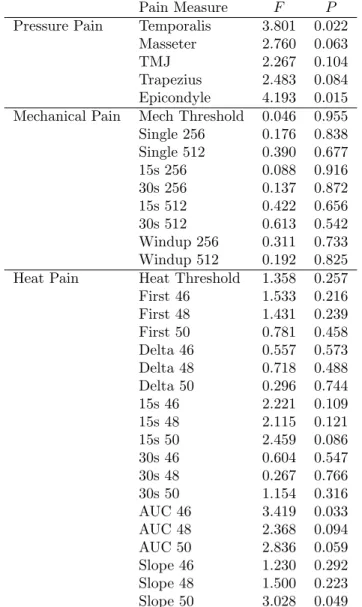
may warrant further testing. When looking at cases and controls separately, no association was detected
between any pain measure and the number of comorbid conditions after using the Bonferroni adjustment.
Before adjustment, one pressure pain and one heat pain measurement each were significantly associated
with the number of comorbid conditions in both cases and controls.
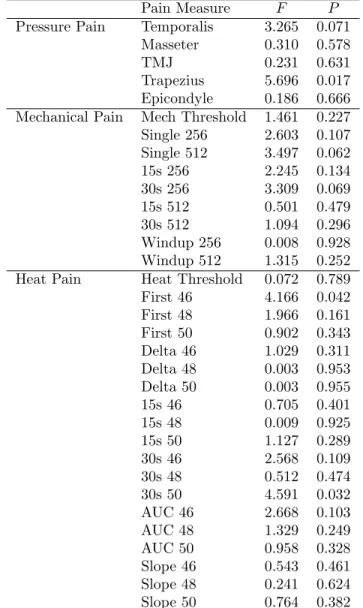
Table 14: Group Test for Categorical Comorbidities for Cases N=1036
Pain Measure F P
Pressure Pain Temporalis 3.265 0.071
Masseter 0.310 0.578
TMJ 0.231 0.631
Trapezius 5.696 0.017
Epicondyle 0.186 0.666
Mechanical Pain Mech Threshold 1.461 0.227
Single 256 2.603 0.107
Single 512 3.497 0.062
15s 256 2.245 0.134
30s 256 3.309 0.069
15s 512 0.501 0.479
30s 512 1.094 0.296
Windup 256 0.008 0.928
Windup 512 1.315 0.252
Heat Pain Heat Threshold 0.072 0.789
First 46 4.166 0.042
First 48 1.966 0.161
First 50 0.902 0.343
Delta 46 1.029 0.311
Delta 48 0.003 0.953
Delta 50 0.003 0.955
15s 46 0.705 0.401
15s 48 0.009 0.925
15s 50 1.127 0.289
30s 46 2.568 0.109
30s 48 0.512 0.474
30s 50 4.591 0.032
AUC 46 2.668 0.103
AUC 48 1.329 0.249
AUC 50 0.958 0.328
Slope 46 0.543 0.461
Slope 48 0.241 0.624
Slope 50 0.764 0.382
Table 15: Group Test with Categorical Comorbidities for Controls N=3244
Pain Measure F P
Pressure Pain Temporalis 3.801 0.022
Masseter 2.760 0.063
TMJ 2.267 0.104
Trapezius 2.483 0.084
Epicondyle 4.193 0.015
Mechanical Pain Mech Threshold 0.046 0.955
Single 256 0.176 0.838
Single 512 0.390 0.677
15s 256 0.088 0.916
30s 256 0.137 0.872
15s 512 0.422 0.656
30s 512 0.613 0.542
Windup 256 0.311 0.733
Windup 512 0.192 0.825
Heat Pain Heat Threshold 1.358 0.257
First 46 1.533 0.216
First 48 1.431 0.239
First 50 0.781 0.458
Delta 46 0.557 0.573
Delta 48 0.718 0.488
Delta 50 0.296 0.744
15s 46 2.221 0.109
15s 48 2.115 0.121
15s 50 2.459 0.086
30s 46 0.604 0.547
30s 48 0.267 0.766
30s 50 1.154 0.316
AUC 46 3.419 0.033
AUC 48 2.368 0.094
AUC 50 2.836 0.059
Slope 46 1.230 0.292
Slope 48 1.500 0.223
Slope 50 3.028 0.049
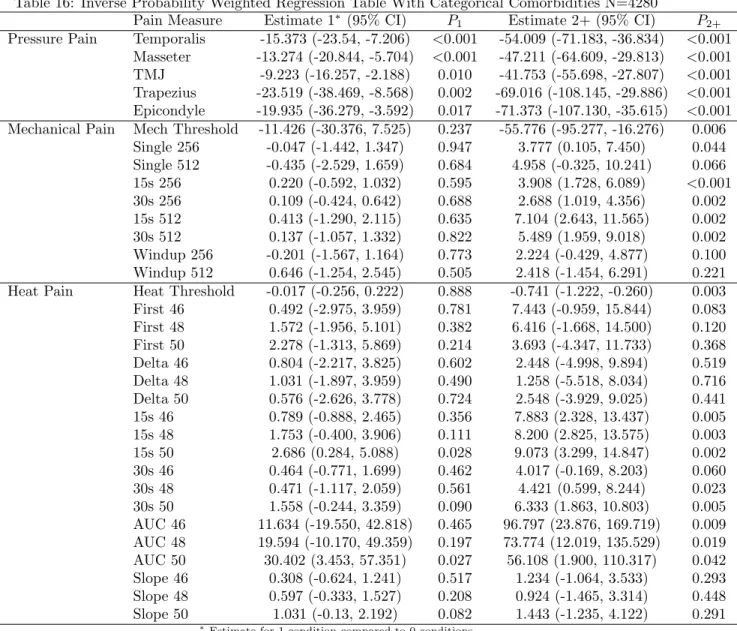
Table 16: Inverse Probability Weighted Regression Table With Categorical Comorbidities N=4280
Pain Measure Estimate 1∗ (95% CI) P1 Estimate 2+ (95% CI) P2+
Pressure Pain Temporalis -15.373 (-23.54, -7.206) <0.001 -54.009 (-71.183, -36.834) <0.001 Masseter -13.274 (-20.844, -5.704) <0.001 -47.211 (-64.609, -29.813) <0.001 TMJ -9.223 (-16.257, -2.188) 0.010 -41.753 (-55.698, -27.807) <0.001 Trapezius -23.519 (-38.469, -8.568) 0.002 -69.016 (-108.145, -29.886) <0.001 Epicondyle -19.935 (-36.279, -3.592) 0.017 -71.373 (-107.130, -35.615) <0.001 Mechanical Pain Mech Threshold -11.426 (-30.376, 7.525) 0.237 -55.776 (-95.277, -16.276) 0.006
Single 256 -0.047 (-1.442, 1.347) 0.947 3.777 (0.105, 7.450) 0.044 Single 512 -0.435 (-2.529, 1.659) 0.684 4.958 (-0.325, 10.241) 0.066 15s 256 0.220 (-0.592, 1.032) 0.595 3.908 (1.728, 6.089) <0.001
30s 256 0.109 (-0.424, 0.642) 0.688 2.688 (1.019, 4.356) 0.002
15s 512 0.413 (-1.290, 2.115) 0.635 7.104 (2.643, 11.565) 0.002
30s 512 0.137 (-1.057, 1.332) 0.822 5.489 (1.959, 9.018) 0.002
Windup 256 -0.201 (-1.567, 1.164) 0.773 2.224 (-0.429, 4.877) 0.100 Windup 512 0.646 (-1.254, 2.545) 0.505 2.418 (-1.454, 6.291) 0.221 Heat Pain Heat Threshold -0.017 (-0.256, 0.222) 0.888 -0.741 (-1.222, -0.260) 0.003 First 46 0.492 (-2.975, 3.959) 0.781 7.443 (-0.959, 15.844) 0.083 First 48 1.572 (-1.956, 5.101) 0.382 6.416 (-1.668, 14.500) 0.120 First 50 2.278 (-1.313, 5.869) 0.214 3.693 (-4.347, 11.733) 0.368 Delta 46 0.804 (-2.217, 3.825) 0.602 2.448 (-4.998, 9.894) 0.519 Delta 48 1.031 (-1.897, 3.959) 0.490 1.258 (-5.518, 8.034) 0.716 Delta 50 0.576 (-2.626, 3.778) 0.724 2.548 (-3.929, 9.025) 0.441
15s 46 0.789 (-0.888, 2.465) 0.356 7.883 (2.328, 13.437) 0.005
15s 48 1.753 (-0.400, 3.906) 0.111 8.200 (2.825, 13.575) 0.003
15s 50 2.686 (0.284, 5.088) 0.028 9.073 (3.299, 14.847) 0.002
30s 46 0.464 (-0.771, 1.699) 0.462 4.017 (-0.169, 8.203) 0.060
30s 48 0.471 (-1.117, 2.059) 0.561 4.421 (0.599, 8.244) 0.023
30s 50 1.558 (-0.244, 3.359) 0.090 6.333 (1.863, 10.803) 0.005
AUC 46 11.634 (-19.550, 42.818) 0.465 96.797 (23.876, 169.719) 0.009 AUC 48 19.594 (-10.170, 49.359) 0.197 73.774 (12.019, 135.529) 0.019 AUC 50 30.402 (3.453, 57.351) 0.027 56.108 (1.900, 110.317) 0.042 Slope 46 0.308 (-0.624, 1.241) 0.517 1.234 (-1.064, 3.533) 0.293 Slope 48 0.597 (-0.333, 1.527) 0.208 0.924 (-1.465, 3.314) 0.448
Slope 50 1.031 (-0.13, 2.192) 0.082 1.443 (-1.235, 4.122) 0.291
∗Estimate for 1 condition compared to 0 conditions
See model in Equation (3) and hypotheses in Equations (5) and (6)
variable (see model in Equation (3) and hypotheses in Equations (5) and (6)). Focusing on the effect of
2 or more comorbid conditions over 0, the pressure pain variables are significantly associated with the
number of comorbid conditions as are 5 mechanical pain and 5 heat pain variables (or roughly
signifi-cant). Many more variables were significantly associated with the number of comorbid conditions prior
to adjustment. For the effect of 1 comorbid condition, only 2 pressure pain variables are significantly
as-sociated with the number of comorbid conditions after adjustment; all of the pressure pain variables were
significantly associated before adjustment, but no other pain measures returned a significant association
with the number of comorbid conditions even before adjustment.
cases reveals that two of the mechanical pain variables were significantly associated with the number
of comorbid conditions after adjustment, and some more pain measures were significantly associated
with the number of comorbid conditions prior to adjustment when looking at the effect of 2 or more
conditions. In the case of 1 comorbid condition, no pain measures were significantly associated with the
number of comorbid conditions even prior to adjustment.
For the controls in Table 18, only two variables were significantly associated with the number
of comorbid conditions prior to adjustment for the 2 or more case, and no measures were significantly
associated with the number of comorbid conditions after adjustment in the 1 condition case. Notably,
the large effect sizes in the pressure pain measures may indicate that there is an association that was
Table 17: Standard Multiple Regression Table for Cases with Categorical Comorbidities N=1036
Pain Measure Estimate 1∗(95% CI) P1 Estimate 2+ (95% CI) P2+
Pressure Pain Temporalis -3.041 (-11.103, 5.021) 0.460 -15.814 (-27.078, -4.550) 0.006 Masseter 1.303 (-5.765, 8.371) 0.718 -9.523 (-19.398, 0.352) 0.059
TMJ 0.747 (-6.025, 7.518) 0.829 -7.056 (-16.517, 2.404) 0.144
Trapezius -12.775 (-30.242, 4.692) 0.152 -35.122 (-59.526, -10.719) 0.005 Epicondyle 5.86 (-12.552, 24.272) 0.533 -1.791 (-27.514, 23.933) 0.891 Mechanical Pain Mech Threshold -6.511 (-26.161, 13.139) 0.516 -21.868 (-49.322, 5.586) 0.119 Single 256 0.413 (-1.825, 2.651) 0.718 4.768 (1.642, 7.894) 0.003 Single 512 1.805 (-1.416, 5.026) 0.272 5.172 (0.672, 9.672) 0.025 15s 256 -0.11 (-1.913, 1.694) 0.905 4.617 (2.097, 7.137) <0.001 30s 256 0.091 (-1.277, 1.458) 0.896 3.777 (1.866, 5.687) <0.001 15s 512 -1.016 (-3.809, 1.776) 0.476 5.689 (1.787, 9.59) 0.004 30s 512 -0.452 (-2.700, 1.795) 0.693 4.896 (1.756, 8.036) 0.002 Windup 256 -0.765 (-2.822, 1.293) 0.467 2.190 (-0.684, 5.064) 0.136 Windup 512 -1.315 (-3.804, 1.175) 0.301 -1.310 (-4.789, 2.168) 0.461 Heat Pain Heat Threshold 0.038 (-0.308, 0.385) 0.829 -0.243 (-0.726, 0.241) 0.326 First 46 -4.412 (-8.797, -0.027) 0.049 -3.391 (-9.517, 2.735) 0.278 First 48 -2.213 (-6.73, 2.305) 0.337 -4.652 (-10.963, 1.66) 0.149 First 50 -1.176 (-5.504, 3.152) 0.594 -3.661 (-9.708, 2.386) 0.236 Delta 46 0.242 (-3.275, 3.759) 0.893 5.113 (0.200, 10.027) 0.042 Delta 48 -1.957 (-5.288, 1.375) 0.250 5.153 (0.499, 9.808) 0.030 Delta 50 -1.576 (-4.787, 1.635) 0.336 4.185 (-0.301, 8.671) 0.068 15s 46 -0.862 (-3.356, 1.633) 0.499 5.498 (2.013, 8.983) 0.002 15s 48 -1.881 (-4.843, 1.080) 0.213 4.206 (0.068, 8.343) 0.047 15s 50 -0.173 (-3.433, 3.086) 0.917 5.978 (1.423, 10.532) 0.010
30s 46 0.450 (-1.379, 2.278) 0.630 3.583 (1.028, 6.138) 0.006
30s 48 -0.239 (-2.649, 2.172) 0.846 3.353 (-0.015, 6.721) 0.051
30s 50 1.223 (-1.347, 3.794) 0.351 5.800 (2.209, 9.391) 0.002
AUC 46 -39.163 (-78.399, 0.072) 0.051 -5.620 (-60.437, 49.196) 0.841 AUC 48 -26.208 (-62.789, 10.373) 0.161 -2.607 (-53.715, 48.501) 0.920 AUC 50 -18.996 (-50.642, 12.651) 0.240 -2.538 (-46.752, 41.676) 0.910 Slope 46 0.364 (-0.652, 1.380) 0.483 0.296 (-1.123, 1.716) 0.683 Slope 48 -0.338 (-1.356, 0.680) 0.516 1.637 (0.214, 3.059) 0.024 Slope 50 -0.067 (-1.123, 0.988) 0.900 1.645 (0.170, 3.120) 0.029
∗Estimate for 1 condition compared to 0 conditions
Table 18: Standard Multiple Regression Table for Controls with Categorical Comorbidities N=3244 Pain Measure Estimate 1∗ (95% CI) P1 Estimate 2+ (95% CI) P2+
Pressure Pain Temporalis -9.683 (-20.545, 1.18) 0.081 -40.483 (-76.765, -4.202) 0.029 Masseter -7.601 (-17.264, 2.063) 0.123 -29.977 (-62.252, 2.298) 0.069 TMJ -3.741 (-12.246, 4.764) 0.389 -28.597 (-57.003, -0.191) 0.049 Trapezius -16.704 (-34.837, 1.429) 0.071 -42.106 (-102.671, 18.459) 0.173 Epicondyle -15.672 (-34.239, 2.895) 0.098 -76.800 (-138.813, -14.788) 0.015 Mechanical Pain Mech Threshold -1.468 (-23.670, 20.733) 0.897 -10.542 (-84.695, 63.610) 0.781 Single 256 -0.529 (-2.275, 1.218) 0.553 0.044 (-5.791, 5.879) 0.988 Single 512 -1.124 (-3.777, 1.530) 0.407 1.249 (-7.614, 10.111) 0.782 15s 256 -0.198 (-1.193, 0.798) 0.697 0.247 (-3.078, 3.571) 0.884 30s 256 -0.168 (-0.805, 0.469) 0.605 -0.101 (-2.228, 2.026) 0.926 15s 512 -0.126 (-2.090, 1.839) 0.900 3.033 (-3.53, 9.595) 0.365 30s 512 -0.291 (-1.736, 1.153) 0.693 2.514 (-2.311, 7.34) 0.307 Windup 256 -0.572 (-2.197, 1.053) 0.490 -1.114 (-6.542, 4.313) 0.687 Windup 512 0.408 (-1.775, 2.591) 0.714 1.903 (-5.388, 9.195) 0.609 Heat Pain Heat Threshold 0.030 (-0.258, 0.318) 0.839 -0.799 (-1.761, 0.163) 0.104 First 46 0.432 (-3.539, 4.404) 0.831 11.802 (-1.462, 25.066) 0.081 First 48 1.355 (-2.774, 5.484) 0.520 11.146 (-2.644, 24.936) 0.113 First 50 2.193 (-2.028, 6.413) 0.309 5.440 (-8.656, 19.536) 0.449 Delta 46 1.585 (-1.685, 4.856) 0.342 2.729 (-8.193, 13.652) 0.624 Delta 48 2.000 (-1.292, 5.293) 0.234 -0.531 (-11.529, 10.466) 0.925 Delta 50 1.142 (-2.151, 4.435) 0.497 2.134 (-8.865, 13.134) 0.704 15s 46 0.541 (-1.354, 2.437) 0.576 6.618 (0.286, 12.95) 0.041 15s 48 1.620 (-0.765, 4.006) 0.183 6.541 (-1.426, 14.509) 0.108 15s 50 2.331 (-0.251, 4.913) 0.077 6.122 (-2.502, 14.746) 0.164 30s 46 0.184 (-1.206, 1.573) 0.796 2.547 (-2.094, 7.188) 0.282 30s 48 0.134 (-1.731, 2.000) 0.888 2.293 (-3.938, 8.524) 0.471 30s 50 1.149 (-0.828, 3.127) 0.255 3.503 (-3.101, 10.106) 0.299 AUC 46 16.234 (-20.332, 52.800) 0.384 155.27 (33.141, 277.399) 0.013 AUC 48 23.284 (-12.529, 59.098) 0.203 110.067 (-9.549, 229.683) 0.071 AUC 50 34.496 (1.040, 67.951) 0.043 75.410 (-36.330, 187.151) 0.186 Slope 46 0.377 (-0.614, 1.369) 0.455 2.369 (-0.942, 5.68) 0.161 Slope 48 0.912 (-0.158, 1.982) 0.095 0.932 (-2.641, 4.506) 0.609 Slope 50 1.308 (0.193, 2.423) 0.022 1.801 (-1.923, 5.525) 0.343
∗Estimate for 1 condition compared to 0 conditions
Discussion
Conclusion
The results of the analysis point to the possibility of an association between pressure pain and
the number of comorbid conditions, but the results did not detect associations between comorbidities
and the other pain measures. Previous work by Pei Feng Lim and Hoffmann et al. demonstrated the
need for such research, arguing that it would elucidate pain in TMD patients. [2] [3] This research has
the potential to improve clinical care for TMD patients and pain biology understanding in general.
Table 3 shows that a much larger proportion of cases had 2 or more comorbid conditions. The
next tables began evaluating the main study aim, namely whether an association existed between pain
scores and the number of comorbidities. These tables indicate differences between each pain type, with
pressure pain having obvious relationships possibly reflecting increasing pain sensitivity with the number
of comorbid conditions, The other types of pain did not have such obvious relationships.
The regression analysis results were consistent with the above observation: pain pressure measures
were significantly associated with the number of comorbid conditions, while the other pain types were
largely or entirely nonsignificant. Interestingly, even the pressure pain measures were not significantly
associated with the presence of 1 comorbid condition, which may point to a dose-response-like threshold
effect in which at least 2 conditions are needed before observing an association. Fully understanding the
underlying reasons for why such discrepancies exist is an area for future research. It was surprising that
the relationship between pain and the number of comorbid conditions was largely limited to pressure
pain measures. It is possible that the types of comorbid conditions differentially affect different measures
of pain sensitivity, so perhaps many of the commonly assessed conditions here affected pressure pain
more than other types of pain measures.
Few pain measures were significantly associated with the number of comorbid conditions when
restricting the analyses to cases only or controls only. It is possible that this may be due to reduced power
from the stratified analyses, as many measures, especially in pressure pain, did have large effect sizes but
lacked significantP-values. The overall (all cases and controls together) tests did indicate that at least
pressure pain measures were significantly associated with the number of comorbid conditions even after
adjustment. Because case status did not seem to identify subgroups with differential significance, it seems
possible that the relationship between number of comorbid conditions and pain (at least pressure pain)
may underlie a broader population. However, this must be further studied by looking at the interaction
between case status and the number of comorbid conditions, as this paper only subjectively looked at this
the number of comorbid conditions and pain measure, particularly with regards to pressure pain.
Limitations and Future Work
Within the context of the analysis, it was often convenient to group variables after conducting
hypothesis testing because related pain measures often produced similar results. In the future, one could
use multivariate methods to assess the relationship between pain sensitivity and the number of comorbid
conditions. Group-wise testing in this manner would also address the inflated type I error encountered
in the present analysis. Other methods of adjustment may also be considered in further analyses because
the Bonferroni correction is conservative.
The categorization of the comorbid variable may lose valuable information relevant to the study.
This may be especially problematic if the number of conditions has a nonlinear relationship with pain
sensitivity. Another possible issue was that each condition may not have the same effect on pain
sen-sitivity, so a simple count of the number of conditions may not reflect the true relationship between
comorbid conditions and pain. It may be important to examine each condition and its relationship with
the pain measures separately. Further, it may also be important to consider the choice of 5% prevalence
of TMD, as the true prevalence of examiner-diagnosed TMD is under some controversy (though the
estimates would likely not have changed greatly for a small change in this value).
Clarifying the relationship between the number of comorbid conditions and pain in TMD patients
will help elucidate the pain biology of TMD patients. Moving forward, I will take a different approach
and examine whether genetic information can similarly predict pain sensitivity in these TMD patients.
With the increasing availability of genetic data, this analysis may add another tool for researchers to
References
[1] U. Isong, S. A. Gansky, and O. Plesh. Temporomandibular joint and muscle disorder-type pain in
U.S. adults: the National Health Interview Survey. J Orofac Pain, 22(4):317–322, 2008.
[2] P. F. Lim, W. Maixner, and A. A. Khan. Temporomandibular disorder and comorbid pain conditions.
J Am Dent Assoc, 142(12):1365–1367, Dec 2011.
[3] R. G. Hoffmann, J. M. Kotchen, T. A. Kotchen, T. Cowley, M. Dasgupta, and A. W. Cowley.
Temporomandibular disorders and associated clinical comorbidities. Clin J Pain, 27(3):268–274,
2011.
[4] W. Maixner, L. Diatchenko, R. Dubner, R. B. Fillingim, J. D. Greenspan, C. Knott, R. Ohrbach,
B. Weir, and G. D. Slade. Orofacial pain prospective evaluation and risk assessment study–the
OPPERA study. J Pain, 12(11 Suppl):4–11, Nov 2011.
[5] G. D. Slade, E. Bair, K. By, F. Mulkey, C. Baraian, R. Rothwell, M. Reynolds, V. Miller, Y.
Gon-zalez, S. Gordon, M. Ribeiro-Dasilva, P. F. Lim, J. D. Greenspan, R. Dubner, R. B. Fillingim,
L. Diatchenko, W. Maixner, D. Dampier, C. Knott, and R. Ohrbach. Study methods, recruitment,
sociodemographic findings, and demographic representativeness in the OPPERA study. J Pain,
12(11 Suppl):12–26, Nov 2011.
[6] J. M. Valderas, B. Starfield, B. Sibbald, C. Salisbury, and M. Roland. Defining comorbidity:
impli-cations for understanding health and health services. Ann Fam Med, 7(4):357–363, 2009.
[7] J. D. Greenspan, G. D. Slade, E. Bair, R. Dubner, R. B. Fillingim, R. Ohrbach, C. Knott, F. Mulkey,
R. Rothwell, and W. Maixner. Pain sensitivity risk factors for chronic TMD: descriptive data and
empirically identified domains from the OPPERA case control study. J Pain, 12(11 Suppl):61–74,
Nov 2011.
[8] G. M. Monsees, R. M. Tamimi, and P. Kraft. Genome-wide association scans for secondary traits