Embodied Individual Differences in Emotional Intensity Jennifer M. Perry
University of North Carolina at Chapel Hill
Spring 2017
A thesis presented to the faculty of The University of North Carolina at Chapel Hill in partial fulfillment of the requirements for the Bachelor of Science degree with Honors in Psychology.
Advisor ___________________
Reader ___________________
Acknowledgements
First and foremost, my many thanks to my advisor Dr. Kristen Lindquist. She has been an excellent mentor these past three years, and above all a role model for my future in science. My graduate advisor, Jennifer MacCormack, has been an invaluable, unwavering source of knowledge, advice, and much-needed support. Without them, this thesis would not exist at all. I would also like to thank my third committee member, Dr. Keely Muscatell, for her support and patience.
The entirety of the Carolina Affective Science Lab has been a significant help, as well, from the research assistants that helped us collect our data to the graduate students who provided me with key feedback during my early talks. This lab has made me who I am as a researcher, and I will miss it dearly.
Further gratitude to: my parents, Darlene and Elgin, who have always been convinced I could do this, even when I most certainly was not; my siblings, Dylan and Kim, who have lovingly tolerated me through many annoyances, including but not limited to my lengthy ramblings about this project; and my housemate, Deekshita Ramanarayanan, who brought me the copious amounts of Ben & Jerry’s and cheesy roll-ups that went into the writing of this report and listened to me talk about my work at hours of the night when she perhaps would rather not have.
Abstract
The present study took an individual differences approach to understand how peripheral autonomic reactivity and interoceptive ability impact variability in individuals’ emotional intensity. Working under the theory of constructed emotion, we anticipated that interoceptive ability would moderate autonomic reactivity to predict emotional intensity. After using a heartbeat detection task to measure ability to monitor one’s own heart rate, we induced negative affect using the Trier Social Stress Test and continuously recorded cardiovascular physiology throughout the task. Through hierarchical regression analyses we found that while interoceptive ability significantly predicts both general emotional and high arousal negative emotional intensity, neither autonomic reactivity nor its interaction with interoceptive ability have a significant relationship with emotional intensity. Our findings provide support to the idea that emotions are constructed by applying conceptual knowledge to internal and external stimuli, rather than arising from physiological responses alone.
Keywords: emotion, interoception, autonomic reactivity, peripheral physiology,
Although the tendency to experience emotions is recognized as a universal human trait, there is surprising variability in the types and subjective quality of emotions that people experience. For example, in folk psychology, some people seem more “emotional” and experience much more intense emotional reactions compared to the calm-and-collected types who are less ruffled by life’s events. Despite this folk idea of emotional intensity as an individual difference, in scientific literature, this trait is often taken for granted and used in the context of understanding other traits (e.g., neuroticism; Verduyn & Brans, 2011) with little research delineating the mechanisms behind emotional intensity.
In affective science, emotional intensity is defined as how extreme, strong, or forceful an individual’s emotions tend to be on average (Larsen & Diener, 1987). When comparing individuals, one person may have more intense emotions compared to, say, their friend or partner. However, while the intensity of emotions differs depending on circumstance, the intensity of any given emotion also varies within a single person from experience to experience (Kuppens, Van Mechelen, Nezlek, Doscche, & Timmermans, 2007). For example, one instance of anger may be more intense today than it was last week. One potential mechanism driving differences in emotional intensity is differences in robustness of physiological reaction: historical theories hold that differences in autonomic reactivity, particularly in sympathetic excitation, drive differences in emotional intensity (e.g., Schachter & Singer, 1962). More recent data suggest that differences in ability to detect physiological cues, or interoceptive ability, may also drive these individual differences (e.g., Barrett, Quigley, Bliss-Moreau, & Aronson, 2004).
driving emotional intensity. We examine these through the lens of a psychological constructionist theory of emotion called the theory of constructed emotion, which views emotional experiences as unique instances built from the situated combination of physiology, context, and the meaning made of that context. Below, we first review the nature of emotional intensity as a construct and then introduce the theory of constructed emotion and its relevant hypotheses for emotional intensity as measured in the present study.
An Individual Differences Approach to Emotional Intensity Emotional Intensity
An emotional experience can be described in terms of its intensity. Intensity is characterized as the subjective experience of how acute, sharp, or strong the emotion feels to the experiencer. For example, one might feel intense sadness after the loss of a loved one, but less intense sadness after the loss of a famous celebrity (Scherer, 2005). In Russell’s (1980) circumplex model of emotion, intensity is defined as distance from a “neutral” origin point along dimensions of both arousal, or how activated or deactivated one feels, and valence, or how pleasant or unpleasant one feels (Diener, Larsen, Levine, & Emmons, 1985; Scherer, 2005). Following this logic, participants can self-report intensity by indicating a score on a continuous scale from some minimum to some maximum value, either on a circumplex (e.g., Russell, 1980) or along a Likert-type scale (e.g., Affect Intensity Measure; Larsen & Diener, 1987).
(Diener et al., 1985). Since these differences appear to be stable over time and also are observable in children, previous theories posit that between-individual differences in emotional intensity are ultimately driven by personality or temperament (Thomas, Chess, & Birch, 1970). Similarly, Larsen and Diener (1987) frame emotional intensity as how relatively weak or strong an individual’s emotional experiences typically are compared to other people’s, in response to the same degree of emotional stimulus. Thus, prior research has emphasized emotional intensity as a trait, which remains the same across circumstances.
In this study, we were instead interested in emotion intensity as a state, given that trait emotional intensity is likely built upon one’s state emotional intensity. In assessing the emotion intensity of a specific emotional experience –a stressful task– we viewed responses as a byproduct of individual differences in physiological reactions and interoceptive ability.
Theory of Constructed Emotion
Core affect. Physiological changes are a fundamental, “core” component of an emotional experience, in that an individual’s bodily cues serve as information to be interpreted in the construction of a resultant emotion (Lindquist, 2013). The two previously described dimensions of intensity that vary independently of one another, arousal and valence, are in fact measurable qualities of core affect itself (Barrett & Bliss-Moreau, 2009). These two dimensions are typically plotted on a circumplex affect grid, with valence along the horizontal axis and arousal along the vertical axis (Russell, 1980). Core affect is thought to be rooted in the body’s physiological reactions and forms an aspect of consciousness from birth onwards (Barrett, 2017), though affect reactivity is known to vary across individuals, events, and life stages (Russell & Barrett, 1999; Timmermans, Van Mechelen, & Nezlek, 2009). Even animals are thought to possess affect, at least in a rudimentary form (e.g., Bliss-Moreau, Machado, & Amaral, 2013; see Lindquist, 2013). Beyond its role as a building block of emotion, affect is also viewed as a central feature in phenomena like prejudice, decision-making, personality, and other areas (Barrett & Bliss-Moreau, 2009). This is another example of the basic, more general-use nature of the “building blocks of emotion,” rather than those elements being exclusive to emotion itself.
When other influences, like posture and nature of the stressor, are held constant, physiological indices of cardiovascular activity can serve as a window into the activity of the ANS. Autonomic reactivity, or the degree of change in the ANS between a baseline state and a stressful state, is thought to be an important cause of emotional experiences (Critchley & Nagai, 2012; Quigley & Barrett, 2014).
Interoceptive ability. In the construction of emotion, a conceptual framework is used to filter through and react to information that is gathered from the environment and from the inner body (Barrett, 2006). However, contrary to interpretations of older emotion theories that take into account autonomic reactions [like the Schachter-Singer (1962) or James-Lange (James, 1884; Lange, 1885) theories] humans do not have instantaneous, unbiased access to knowledge about the activity in their autonomic nervous or somatic systems. Rather, all information gathered about bodily activity is obtained through perception of these physiological responses. In the central nervous system, this process begins when the insula receives projections from the spinal cord concerning both external and internal sensations, which are then integrated together as a representation of the current environment’s meaningful features (Craig, 2011). Past work has shown that activity in the anterior insular cortex correlates strongly with subjective, but not objective, intensity of stimulus strength (i.e. perceived temperature of cold stimuli, Craig, Chen, Bandy, & Reiman, 2000), suggesting that interoception –or the subjective experience of internal bodily changes– may occur at least in part in the insula (Craig, 2009).
that relatively high activity in the anterior insular cortex during an interoceptive task is associated with better accuracy (i.e., greater interoceptive ability) on that task (Critchley, Weins, Rotshtein, Öhman, & Dolan, 2004).
Predictions for the Role of Autonomic Reactivity and Interoception on Emotional Intensity
Based on the above literature, we hypothesized that ratings of subjective emotional intensity of a stressful experience would be driven by a person’s objective degree of autonomic reactivity and interoceptive ability. Guided by the theory of constructed emotion, we hypothesized that greater degree of autonomic reactivity should correspond to a more intense emotional experience. The theory of constructed emotion also suggests that higher interoceptive ability would be associated with more intense emotions, as Barrett et al. (2004) found a significant positive correlation between interoceptive ability and self-reported arousal. Our third and final hypothesis emerged from the idea that at any level of autonomic reactivity, interoceptive ability should serve to heighten or dampen the individual’s sense of that physiological response and thus influence how physiological response is conceptualized into an emotional experience. In this way, interoceptive ability and autonomic reactivity should interact to predict emotional intensity.
Present Study
interoceptive ability using a series of questionnaires, including the Multidimensional Assessment of Interoceptive Awareness (MAIA; Mehling et al., 2012) and Bodily Awareness Questionnaire (BAQ; Shields, Mallory, & Simon, 1989). To induce negative affect, we used a well-validated task shown to provoke psychobiological stress: the Trier Social Stress Test (TSST; Kirschbaum, Pirke, & Hellhammer, 1993). The stress response elicited by the TSST is known to cause cardiovascular changes, and we measured autonomic reactivity as the degree of change from baseline experienced across the TSST.
Method
Participants
Because we used psychophysiological measures and a stress induction, recruitment included stringent exclusion criteria. During prescreening, individuals who reported current mood, personality, social anxiety disorders, history of substance abuse including nicotine, a diagnosis of a heart condition (e.g., murmur), or presence of a pacemaker were excluded. Additionally, individuals with a BMI over 33 were excluded (M = 22.14, SD = 2.41, range: 16.8–28.9), as high body fat inhibits accurate cardiography (Frank, Colliver, & Frank, 1986). In addition to in-take eligibility, we included session-specific requirements to eliminate physiological confounds: individuals could only participate in the present lab visit if they did not consume alcohol, caffeine, and excess sugar within three hours prior to arrival, nor eat a heavy meal or engage in strenuous exercise within one hour prior.
or learning them from other participants (n = 2), violations of eligibility requirements revealed after participation had begun (e.g., drank a strongly caffeinated drink right before the study; n = 2), participant familiarity with the researchers (n = 1), and poor fluency in English (n = 1).
Procedure
Participants completed two separate sessions, each at least one week but no more than one month apart. In Session 1, participants completed a heartbeat detection task as a measure of their interoceptive ability and several questionnaires. In Session 2, participants underwent the Trier Social Stress Test (TSST) to induce a robust high arousal, negative emotional state and to assess continuous measures of physiological reactivity.
Session 2. Like Session 1, the experimenter wore a laboratory coat and greeted each participant upon arrival. All participants completed a Daily Health Inventory questionnaire regarding food and caffeine intake and recent exercise that might disqualify the individual from participating that day. After ensuring individuals had followed our instructions for participating, we prepared individuals for peripheral physiological data collection by attaching sensors. Participants then completed 5 minutes of physiological baseline in which ECG, cardiac impedance, and blood pressure were continuously recorded. For more information on the utilized cardiovascular indices, see Psychophysiological measures below.
Trier Social Stress Test. The TSST is a standard task for inducing interpersonal stress and physiological responsivity to stress (Kirschbaum et al., 1993). After baseline, participants consented to participate in the TSST. The experimenter introduced the task as an assessment of individuals’ cognitive performance under pressure, as relevant for future job prospects. Following consent, two interviewers entered the room and explained the task. The interviewers were instructed to remain as affectively neutral as possible throughout the duration of the TSST. As per Akinola and Mendes (2008) and Kubzanzky et al. (2012), the TSST consisted of three main periods: the speech preparation period (2 minutes), the speech (10 minutes), and an impromptu mental arithmetic task (5 minutes).
verbal prods when the participant paused for more than a few seconds. If the participant stopped talking completely, the interviewers used a series of “follow-up questions” to ensure the participant remained engaged in the task throughout the full 10 minutes.
After the speech, the interviewers introduced a mental arithmetic task, of which participants had not previously been aware. In this segment, participants were asked to count backwards from a large number and were required to start over after every mistake. For the initial version of the task, participants counted backwards from 996 in steps of 7 and restarted from 996 following each mistake. If participants completed the initial task too easily, the interviewers interrupted and modified the task, instructing the participant to count back from 2043 in steps of 17. If participants struggled to complete the initial task at a regular pace, the interviewers interrupted and modified the task, instructing the participant to count back from 943 in steps of 5. The participant performed the mental arithmetic task in the appropriate version for 5 minutes, though interviewers did not explain in the introduction that the task was time limited (i.e. the participant would not be required to count all the way to 0).
After the math task, participants sat alone for a 5-minute recovery period, allowing us to assess how quickly individuals recovered to baseline from the stressor. Psychophysiological data was recorded for the duration of the baseline, preparation, interview, arithmetic, and recovery periods. During recovery, participants completed questionnaires about their thoughts and feelings during the TSST. These questionnaires provided measures of subjective emotional intensity for this report’s primary hypothesis-testing– as well as somatic intensity as an exploratory addition.
authenticity of the psychophysiological equipment through a funneled debriefing administered by a research assistant. Second, participants received a debriefing form explaining the study hypotheses and procedure, particularly that the TSST was intended as a psychological stress task, rather than a measure of cognitive performance, and that the “trained” interviewers were actually actors. It also gave a brief explanation of our hypotheses– until this point the study had been portrayed as an experiment investigating physiology and cognition, rather than emotion. Lastly, participants received details about University-sponsored counseling services available to research participants, so that they could obtain counseling if they experienced lasting stress related to our study.
Session 1 Measures
Heartbeat detection task. As an objective measure of interoceptive ability, participants completed the modified Whitehead heartbeat detection task (Kleckner, Wormwood, Simmons, Barrett, & Quigley, 2015; Whitehead, Drescher, Heiman, & Blackwell, 1977). In this task, each participant was attached to electrocardiography sensors (ECG) as described above, and his or her heartbeat was measured for a 5-minute baseline period. After this, a MATLAB program was used to administer tones based on the timing of ventricular contraction (i.e. the R spike), as determined from an amplitude threshold calculated during baseline. The tones either coincided with (200 ms after the R spike) or did not coincide with (500 ms after the R spike) the participant’s heartbeat. Each trial consisted of 10 tones, after which participants were asked to identify whether or not the tones for that trial had corresponded with heartbeat, as well as how confident they were in their responses.
(Barrett et al., 2004; Banks, 1970). Several studies on interoceptive ability have used the Schandry (1981) task instead: individuals simply count how many times their heart beats during one minute. However, accuracy on the Schandry task is likely improved if the individual is familiar with how many times his or her heart beats on average per minute (e.g., individuals who exercise, work in healthcare, use FitBits or smart watches, etc.), and thus may be a less objective measure of interoceptive ability. Participants completed 2 practice trials and 60 experimental trials, following previously established methodological recommendations for number of trials necessary to establish sufficient statistical power (Kleckner et al., 2015).
Interoceptive ability questionnaires. In addition to using an objective measure of interoceptive ability –the heartbeat detection task– we also collected self-report data on perceived interoceptive ability during Session 1. This allowed us to analyze the relationship between perceived versus actual interoceptive ability, as well as the interplay between these measures and emotion complexity. We primarily chose measures that were developed in an effort to measure awareness of bodily sensations in a neutral light, rather than those aimed at the negatively-connoted somatic symptom reporting or exaggeration trait.
and emotion (emotional awareness), stress regulation (self-regulation), attending to the body as a source of insight (body listening), and view of the body as trustworthy (trusting).
Body Awareness Questionnaire (BAQ). Shields et al. (1989) developed this scale as an alternative to previous questionnaires that focused only on bodily sensations associated with emotion, in favor of examining “the domain of reported awareness of normal body processes not typically associated with emotion or with somatic complaint” (p. 803). This measure ensured that we were measuring general interoceptive ability, rather than simply symptom reporting or related psychopathology. The BAQ is useful for this purpose, as the results of its validation sample showed no significant correlation between BAQ score and previously established measures of hypochondriasis, trait anxiety, trait neuroticism, or self-esteem (Shields et al., 1989). It consists of 18 first-person statements regarding exercise, hunger, and normal bodily states that the participant rates on a Likert-type scale from 1 (“not at all true of me”) to 7 (“very true of me”).
Common Mental Disorders – Screening Questionnaire (CMD-SQ). In an effort to identify individuals who might have somatization tendencies, we used the CMD-SQ, a questionnaire commonly used to assess how likely an individual is to somaticize their psychological distress, i.e. interpret distress as physiological symptoms (Christensen et al., 2005; Sogaard & Bech, 2009).
Session 2 Measures
1, but only for the purposes of conducting the heartbeat detection task; the ECG data from Session 1 was not included in the present paper’s analyses. Additionally, cardiac impedance was used to measure respiratory sinus arrhythmia (RSA), cardiac output (CO), stroke volume (SV), left ventricular ejection time (LVET), and pre-ejection period (PEP) as indices of how much blood is being pumped to the periphery, versus conserved in the core. Finally, as a measure of vasodilation or vasoconstriction in blood vessels as blood is pumped to the periphery, we continuously collected diastolic pressure, systolic pressure, and total peripheral resistance (TPR). However, for the purposes of this report, blood pressure was not analyzed.
Post-TSST questionnaires. These questionnaires, administered in the second session, aimed to capture the participant’s experience during the TSST, in terms of both emotional and physiological response.
Emotions questionnaire. Participants described their emotions on a 7-point Likert-type scale (anchored at 0, “not at all,” and 6, “extremely”) that asked them to indicate “to what extent” they felt each of 30 emotional or affective states “during the speech and math task you just completed.” The labels for the states were drawn from the Positive and Negative Affect Scale Circumplex (Watson, Clark, & Tellegen, 1988).
have experienced during the TSST– and also compare them to actual physiological data obtained during the task.
Results
In our analyses we addressed the role of peripheral physiological responses and interoceptive ability on the subjective intensity of emotional self-reports. Prior research suggests that more intense physiological reactions predict greater emotional intensity (Levenson, 2014; Kassam & Mendes, 2013; Mendes, 2016). However, we hypothesized that interoceptive ability would interact with physiological reactivity to predict emotional intensity, and also that interoception would account for some of the variability in emotional intensity even beyond this interaction alone.
First, we calculated descriptive statistics for all variables to ensure that our measures were normally distributed and did not exhibit skew or kurtosis. Next, we conducted hypothesis testing using hierarchical regressions to assess the relative contributions of interoceptive ability and physiological reactivity on the intensity of all emotion items, as well as on the intensity of the emotions marked high arousal and negative according to Table 1. Finally, as exploratory analyses, we examined the relationship between the other individual differences (e.g., self-reported interoceptive ability, somatization tendencies, etc.) and interoceptive ability and physiological reactivity. We then ran hierarchical regressions replicating the primary hypothesis-testing models, but with overall somatic intensity as the outcome of interest.
Descriptive Statistics
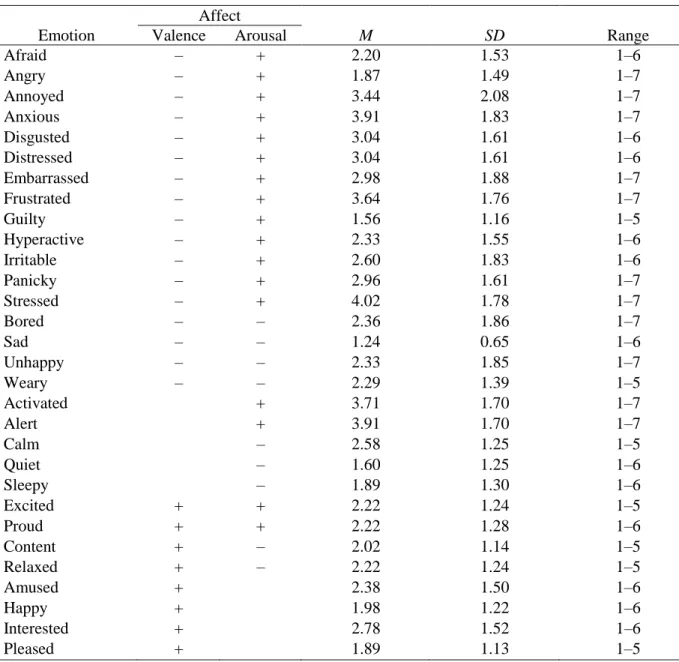
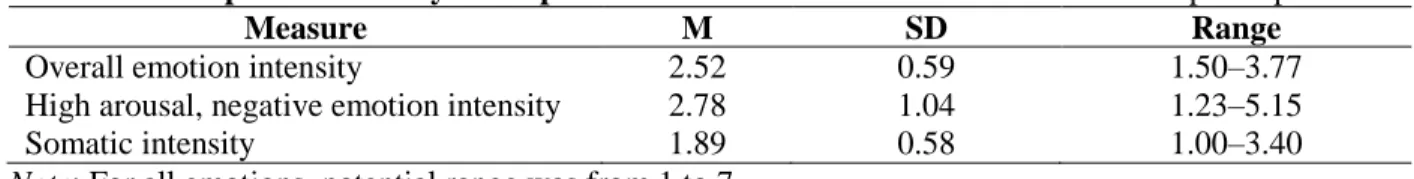
4.02, 3.91, 3.64). In contrast, participants indicated that they felt low arousal emotions, including “sad”, “quiet”, and “sleepy”, with much less intensity (Ms = 1.24, 1.60, 1.89). This suggests that the TSST was effective at inducing the intended high arousal, negative state. In terms of somatic intensity, participants more strongly felt sensations like “heart rate increased,” “fidgety,” and “wide awake” (Ms = 3.84, 3.47, 3.42) than sensations like “faint,” “pale,” or “weak” (Ms = 1.22, 1.27, 1.38). These data show that high arousal somatic sensations were more characteristic of participant experience during the TSST than were low arousal somatic sensations. Also notably, somatic intensity (M = 1.89) was on average lower than emotional intensity (M = 2.52). Further, participants reported greater intensity of high arousal, negative emotions (M = 2.78) than of emotions in general (M = 2.52), as shown in Table 3, which may mean the TSST was likely construed more in terms of emotion than mere somatic changes.
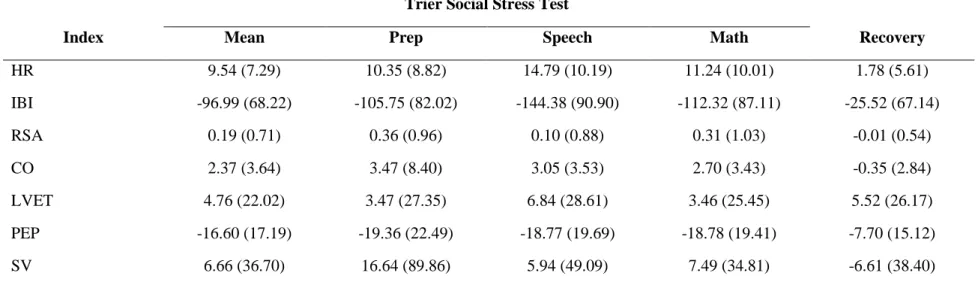
With regards to average physiological reactions during the TSST, participants tended to experience lowest physiological arousal during baseline and peak changes during the prep and math periods of the TSST (e.g., heart rate change from baseline Mspeech = 14.79 increased beats per minute, SDspeech = 10.19). See Table 4 for mean change descriptives from baseline of all peripheral physiological indices at each of the other four time points (prep, speech, math, and recovery), as well as mean reactivity across the TSST as a whole.
Hypothesis Testing
We ran two overarching hierarchical regression models to test our hypotheses on the roles played by interoceptive ability and physiological reactivity in predicting emotional intensity during the TSST. Each physiological index was run in its own model as a predictor, alongside interoceptive ability and the interaction effect between the two. Table 6 lists results for both steps of the analysis for each outcome variable predicting overall emotional intensity; Table 7 lists results for high arousal, negative emotion intensity models.
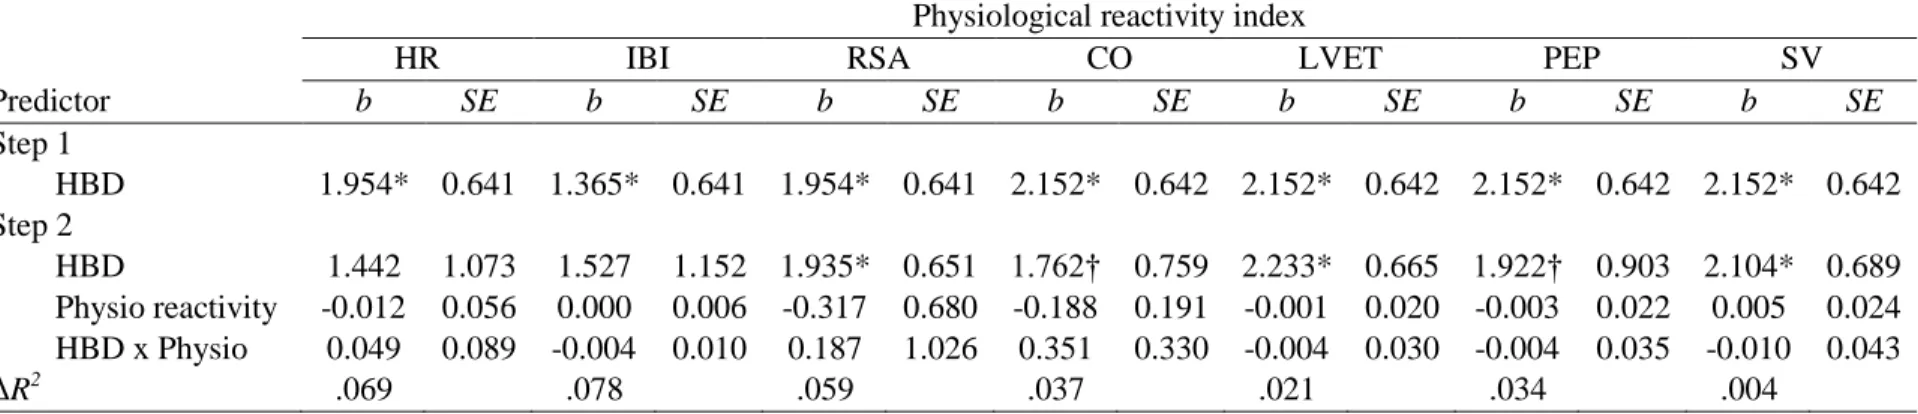
Model A: Interoceptive ability + Physiological reactivity + (Interoceptive ability X Physiological reactivity), on Overall emotional intensity. This model is summarized in Table 6. In general, when interoceptive ability was run in Step A1 as the only predictor, it was significant (ps < .01). In the Step A2 models, it remained the only significant predictor (ps < .05), despite the addition of each physiological reactivity index (e.g., HR) and the interaction between that index and interoceptive ability (ps > .25). Changes in R2 between A1 and A2 were minimal, as well. That is, the A2 models including each physiological reactivity index did not predict the variance in overall emotional intensity during the TSST better than the A1 model with interoceptive ability alone as a predictor. The only exceptions to this pattern were two indices, HR and IBI, for which interoceptive ability became nonsignificant in Step A2 (p = .190, .197).
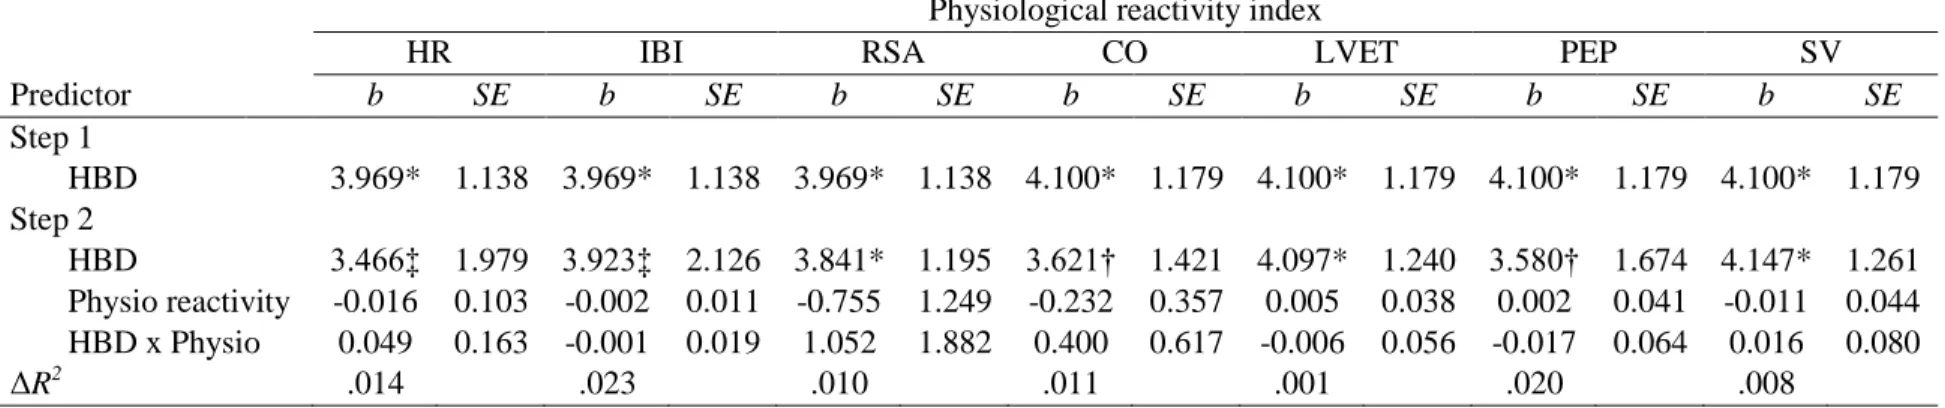
nonsignificant (ps > .50). Again, entering a given physiological reactivity index and the interaction effect between physiological reactivity and interoceptive ability did not produce a better model of high arousal, negative emotion intensity than the model using interoceptive ability alone.
Exploratory Analyses
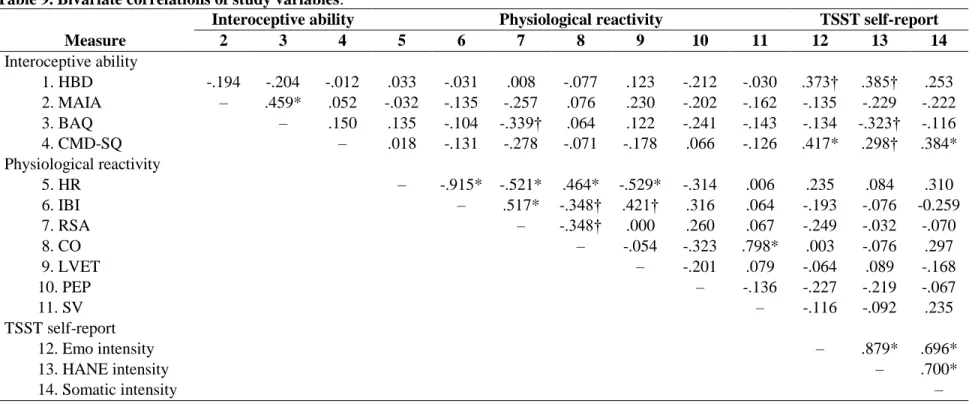
Additionally, two sets of exploratory analyses were conducted. Questionnaire descriptive statistics are in Table 8. In Table 9, we present bivariate correlations between all study variables: interoceptive ability; questionnaire measures; physiological reactivity indices; overall emotional intensity; high arousal, negative emotional intensity; somatic intensity.
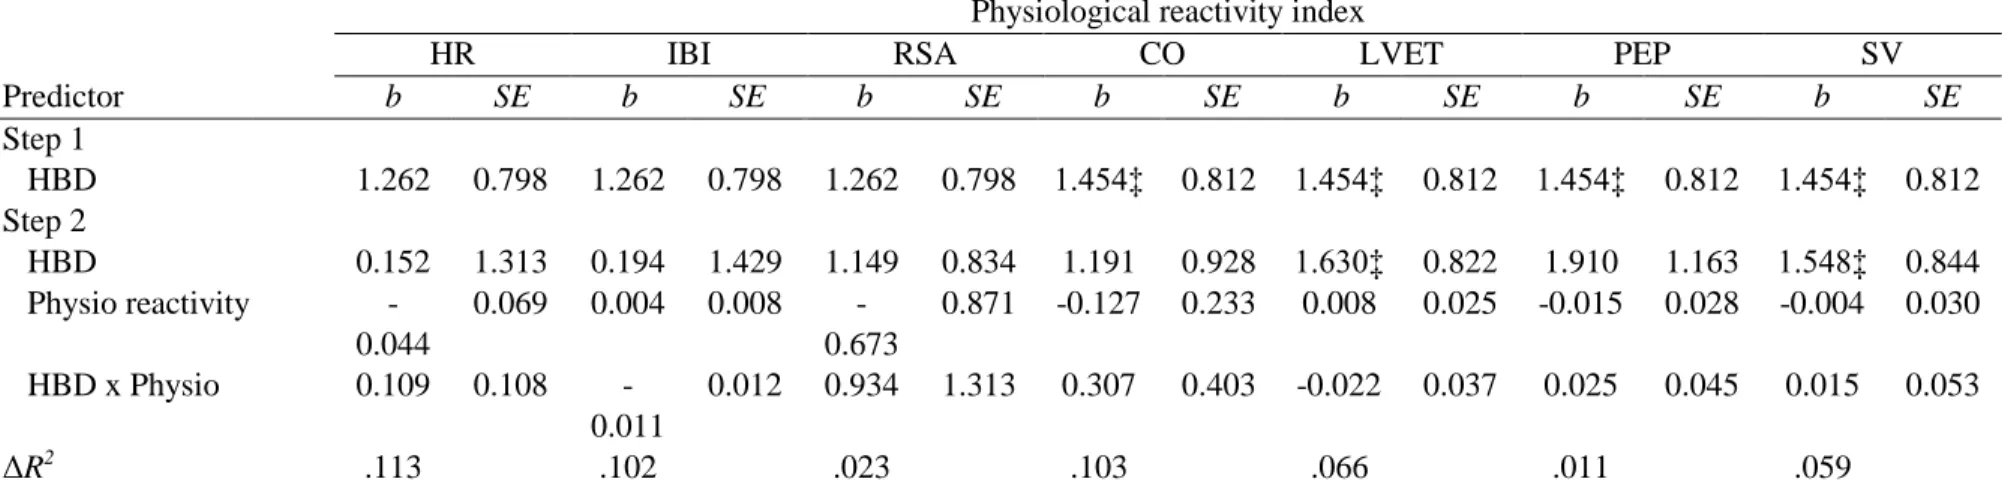
Somatic intensity. We were also interested in how interoceptive ability and physiological reactivity might impact mean reports of overall somatic intensity. To investigate this, we ran hierarchical regressions replicating our primary models of interest with somatic intensity as the outcome. However, no models proved significant. These findings are displayed in Table 10.
Discussion
Hierarchical regression analysis revealed that interoceptive ability is a significant predictor of subjective emotional intensity, regardless of actual physiological reactivity in the autonomic nervous system. The relationship between interoceptive ability, as measured in a heartbeat detection task, and emotional intensity, as self-reported, remained significant even after accounting for actual physiological response in the cardiovascular system and the interaction between this response and interoceptive ability. This evidence suggests that interoceptive ability as an individual difference may be an even more important mechanism driving perceived emotional intensity than how strongly the autonomic nervous system responds.
Considering this, our findings suggest that peripheral indices, like the cardiovascular reactivity used as a measure of physiological response in this study, may be insufficient for predicting emotional intensity. Individual differences like interoceptive ability may impact how much these bodily signals are actually received and used by the brain for mental state construction. Thus, taken together, our results lend support to the theory of constructed emotion, by suggesting that emotional experiences have their roots in more than peripheral physiological changes, but also in how the brain integrates those changes into conscious awareness to construct emotion (e.g., Chanes & Barrett, 2016).
we excluded individuals who reported relevant psychopathy, our findings are generalizable to the population of non-clinical young adults as a whole.
Additionally, the apparent significance of interoceptive ability in constructing an emotional experience has key implications for clinical psychology. In a review, Domschke et al. (2010) found that people with clinical levels of anxiety tend to perform more accurately on tasks investigating cardiovascular interoceptive ability. Greater interoceptive ability was shown by this study to be associated with greater emotional intensity, so it makes sense that individuals with anxiety disorders, which are characterized in part by excessive emotional response and distress (American Psychiatric Association, 2013), would demonstrate greater interoceptive ability. Contrastingly, individuals with anorexia nervosa exhibit significantly decreased scores on heartbeat counting tasks (Pollatos et al., 2008) and decreased insular activity when focusing on gastric sensations (Kerr et al., 2016), which may help explain these individuals’ difficulty in attending to hunger and satiety cues. Further work on the interoceptive differences between individuals with anxiety or anorexia and their healthy counterparts can help expand on these findings and possibly provide valuable insight into effective treatment paradigms for these disorders.
the peripheral versus central nervous system mechanisms that drive the embodied experience of emotion.
Table 1. Self-reported emotional intensity descriptive statistics. This table contains data from 45 participants.
Affect
Emotion Valence Arousal M SD Range
Afraid – + 2.20 1.53 1–6
Angry – + 1.87 1.49 1–7
Annoyed – + 3.44 2.08 1–7
Anxious – + 3.91 1.83 1–7
Disgusted – + 3.04 1.61 1–6
Distressed – + 3.04 1.61 1–6
Embarrassed – + 2.98 1.88 1–7
Frustrated – + 3.64 1.76 1–7
Guilty – + 1.56 1.16 1–5
Hyperactive – + 2.33 1.55 1–6
Irritable – + 2.60 1.83 1–6
Panicky – + 2.96 1.61 1–7
Stressed – + 4.02 1.78 1–7
Bored – – 2.36 1.86 1–7
Sad – – 1.24 0.65 1–6
Unhappy – – 2.33 1.85 1–7
Weary – – 2.29 1.39 1–5
Activated + 3.71 1.70 1–7
Alert + 3.91 1.70 1–7
Calm – 2.58 1.25 1–5
Quiet – 1.60 1.25 1–6
Sleepy – 1.89 1.30 1–6
Excited + + 2.22 1.24 1–5
Proud + + 2.22 1.28 1–6
Content + – 2.02 1.14 1–5
Relaxed + – 2.22 1.24 1–5
Amused + 2.38 1.50 1–6
Happy + 1.98 1.22 1–6
Interested + 2.78 1.52 1–6
Pleased + 1.89 1.13 1–5
Table 2. Self-reported somatic intensity descriptive statistics. This table contains data from 45 participants.
Sensation M SD Range
Cardiac Sensations
Blood pumping 3.18 1.81 1–6
Heart palpitations 1.56 1.22 1–6
Heart pounding in chest 2.49 1.78 1–7
Heart rate increased 3.84 1.88 1–7
Throbbing 1.53 1.20 1–7
Gastric Sensations
Butterflies in stomach 2.33 1.55 1–6
Feeling empty or hollow 1.24 0.71 1–4
Nausea or queasiness 1.13 0.63 1–5
Pit in your stomach 1.76 1.38 1–7
Sick 1.13 0.34 1–2
Stomach tense 1.84 1.48 1–7
Kinesthetic Sensations
Body or limbs feeling heavy 1.36 0.77 1–5
Dizzy or light-headed 1.47 1.01 1–6
Feeling fidgety 3.47 1.90 1–7
Feeling still or frozen 1.87 1.31 1–7
Head aching 1.07 0.33 1–3
Jittery 3.02 1.69 1–7
Knots / tension 1.96 1.41 1–6
Numbness 1.31 0.73 1–4
Pain 1.04 0.21 1–2
Shakiness or trembling 2.40 1.72 1–7
Shivering 1.29 0.76 1–5
Spine tingling 1.07 0.33 1–3
Tingling in your limbs or fingers 1.64 1.00 1–5
Respiratory Sensations
Rapid or difficulty breathing 1.24 0.91 1–6
Tightness in chest 1.73 1.34 1–7
Temperature Sensations
Blood draining out of your face (turning pale) 1.27 0.62 1–4
Face or neck turned red 1.69 1.28 1–7
Feeling cold or clammy 2.00 1.62 1–7
Flushed or hot 1.96 1.36 1–7
Skin or scalp prickling (goosebumps) 1.33 0.85 1–4
Arousal Sensations
Drained 1.91 1.18 1–5
Energized 2.64 1.65 1–6
Exhausted 1.87 1.18 1–5
Feeling faint 1.22 0.88 1–6
Feeling physically strong / powerful 1.78 1.15 1–5
Feeling physically weak 1.38 0.96 1–5
Restless 2.87 1.82 1–7
Sluggish 1.58 0.94 1–5
Weariness 1.98 1.34 1–7
Wide awake 3.42 1.76 1–7
Table 3. Self-reported intensity descriptive statistics. This table contains data from 45 participants.
Measure M SD Range
Overall emotion intensity 2.52 0.59 1.50–3.77
High arousal, negative emotion intensity 2.78 1.04 1.23–5.15
Somatic intensity 1.89 0.58 1.00–3.40
Table 4. Physiological reactivity descriptive statistics. The mean difference from baseline state for each physiological index is shown in this table. Standard deviations are in parentheses. The measures in this table are calculated from between 34 to 37 participants, depending on data missing at random.
Trier Social Stress Test
Index Mean Prep Speech Math Recovery
HR 9.54 (7.29) 10.35 (8.82) 14.79 (10.19) 11.24 (10.01) 1.78 (5.61)
IBI -96.99 (68.22) -105.75 (82.02) -144.38 (90.90) -112.32 (87.11) -25.52 (67.14)
RSA 0.19 (0.71) 0.36 (0.96) 0.10 (0.88) 0.31 (1.03) -0.01 (0.54)
CO 2.37 (3.64) 3.47 (8.40) 3.05 (3.53) 2.70 (3.43) -0.35 (2.84)
LVET 4.76 (22.02) 3.47 (27.35) 6.84 (28.61) 3.46 (25.45) 5.52 (26.17)
PEP -16.60 (17.19) -19.36 (22.49) -18.77 (19.69) -18.78 (19.41) -7.70 (15.12)
SV 6.66 (36.70) 16.64 (89.86) 5.94 (49.09) 7.49 (34.81) -6.61 (38.40)
Table 5. Heartbeat detection task score frequencies. This table contains data from 54 participants.
Measure n Percentage
25.1%–50% accuracy 18 33.33%
50.1%–75% accuracy 30 55.56%
75.1%–100% accuracy 6 11.11%
Table 6. Model A: Hypothesis testing of physiological reactivity and interoceptive ability as predictors of overall emotional intensity, using hierarchical regression analyses.
Physiological reactivity index
HR IBI RSA CO LVET PEP SV
Predictor b SE b SE b SE b SE b SE b SE b SE
Step 1
HBD 1.954* 0.641 1.365* 0.641 1.954* 0.641 2.152* 0.642 2.152* 0.642 2.152* 0.642 2.152* 0.642 Step 2
HBD 1.442 1.073 1.527 1.152 1.935* 0.651 1.762† 0.759 2.233* 0.665 1.922† 0.903 2.104* 0.689 Physio reactivity -0.012 0.056 0.000 0.006 -0.317 0.680 -0.188 0.191 -0.001 0.020 -0.003 0.022 0.005 0.024 HBD x Physio 0.049 0.089 -0.004 0.010 0.187 1.026 0.351 0.330 -0.004 0.030 -0.004 0.035 -0.010 0.043 ΔR2
.069 .078 .059 .037 .021 .034 .004
Note: For interoceptive ability measurement, HBD is heartbeat detection task score. For physiological reactivity indices, HR is heart rate; IBI is inter-beat interval; RSA is respiratory sinus arrhythmia; CO is cardiac output; LVET is left ventricular ejection time; PEP is pre-ejection period; SV is stroke volume.
Table 7. Model B: Hypothesis testing of physiological reactivity and interoceptive ability as predictors of high arousal, negative emotional intensity, using hierarchical regression analyses.
Physiological reactivity index
HR IBI RSA CO LVET PEP SV
Predictor b SE b SE b SE b SE b SE b SE b SE
Step 1
HBD 3.969* 1.138 3.969* 1.138 3.969* 1.138 4.100* 1.179 4.100* 1.179 4.100* 1.179 4.100* 1.179 Step 2
HBD 3.466‡ 1.979 3.923‡ 2.126 3.841* 1.195 3.621† 1.421 4.097* 1.240 3.580† 1.674 4.147* 1.261 Physio reactivity -0.016 0.103 -0.002 0.011 -0.755 1.249 -0.232 0.357 0.005 0.038 0.002 0.041 -0.011 0.044 HBD x Physio 0.049 0.163 -0.001 0.019 1.052 1.882 0.400 0.617 -0.006 0.056 -0.017 0.064 0.016 0.080 ΔR2
.014 .023 .010 .011 .001 .020 .008
Note: For interoceptive ability measurement, HBD is heartbeat detection task score. For physiological reactivity indices, HR is heart rate; IBI is inter-beat interval; RSA is respiratory sinus arrhythmia; CO is cardiac output; LVET is left ventricular ejection time; PEP is pre-ejection period; SV is stroke volume.
Table 8. Questionnaire descriptive statistics. This table contains data from 61 participants.
Measure M SD Range
MAIA
Overall 3.69 0.55 2.03–5.16
Noticing 3.83 0.93 1.25–6.00
Not distracting 3.07 0.97 1.00–5.33
Not worrying 3.84 0.88 1.33–5.67
Attention regulation 3.55 0.79 1.43–5.86
Emotional awareness 3.98 0.94 1.80–6.00
Self-regulation 3.54 0.94 1.25–5.75
Body listening 3.01 1.02 1.00–5.67
Trusting 4.52 0.91 2.00–6.00
BAQ 3.97 0.85 2.39–5.67
CMD-SQ 1.45 0.46 1.00–3.53
Table 9. Bivariate correlations of study variables.
Interoceptive ability Physiological reactivity TSST self-report
Measure 2 3 4 5 6 7 8 9 10 11 12 13 14
Interoceptive ability
1. HBD -.194 -.204 -.012 .033 -.031 .008 -.077 .123 -.212 -.030 .373† .385† .253
2. MAIA – .459* .052 -.032 -.135 -.257 .076 .230 -.202 -.162 -.135 -.229 -.222
3. BAQ – .150 .135 -.104 -.339† .064 .122 -.241 -.143 -.134 -.323† -.116
4. CMD-SQ – .018 -.131 -.278 -.071 -.178 .066 -.126 .417* .298† .384*
Physiological reactivity
5. HR – -.915* -.521* .464* -.529* -.314 .006 .235 .084 .310
6. IBI – .517* -.348† .421† .316 .064 -.193 -.076 -0.259
7. RSA – -.348† .000 .260 .067 -.249 -.032 -.070
8. CO – -.054 -.323 .798* .003 -.076 .297
9. LVET – -.201 .079 -.064 .089 -.168
10. PEP – -.136 -.227 -.219 -.067
11. SV – -.116 -.092 .235
TSST self-report
12. Emo intensity – .879* .696*
13. HANE intensity – .700*
14. Somatic intensity –
Note: For interoceptive ability measurement, HBD is heartbeat detection task score; MAIA is Multidimensional Assessment of Interoceptive Awareness; BAQ is Body Awareness Questionnaire; CMD-SQ is Common Mental Disorders – Screening Questionnaire. For physiological reactivity indices, HR is heart rate; IBI is inter-beat interval; RSA is respiratory sinus arrhythmia; CO is cardiac output; LVET is left ventricular ejection time; PEP is pre-ejection period; SV is stroke volume. For TSST self-report measures, emo intensity is emotional intensity; HANE intensity is high arousal, negative emotion intensity.
Table 10. Hypothesis testing of physiological reactivity and interoceptive ability as predictors of somatic intensity, using hierarchical regression analyses.
Physiological reactivity index
HR IBI RSA CO LVET PEP SV
Predictor b SE b SE b SE b SE b SE b SE b SE
Step 1
HBD 1.262 0.798 1.262 0.798 1.262 0.798 1.454‡ 0.812 1.454‡ 0.812 1.454‡ 0.812 1.454‡ 0.812
Step 2
HBD 0.152 1.313 0.194 1.429 1.149 0.834 1.191 0.928 1.630‡ 0.822 1.910 1.163 1.548‡ 0.844
Physio reactivity -0.044
0.069 0.004 0.008
-0.673
0.871 -0.127 0.233 0.008 0.025 -0.015 0.028 -0.004 0.030
HBD x Physio 0.109 0.108
-0.011
0.012 0.934 1.313 0.307 0.403 -0.022 0.037 0.025 0.045 0.015 0.053
ΔR2
.113 .102 .023 .103 .066 .011 .059
Note: For interoceptive ability measurement, HBD is heartbeat detection task score. For physiological reactivity indices, HR is heart rate; IBI is inter-beat interval; RSA is respiratory sinus arrhythmia; CO is cardiac output; LVET is left ventricular ejection time; PEP is pre-ejection period; SV is stroke volume.
References
Akinola, M., & Mendes, W. B. (2008). The dark side of creativity: Biological vulnerability and negative emotions lead to greater artistic creativity. Personality and Social Psychology Bulletin, 34(12), 1677-1686.
American Psychiatric Association. (2013). Anxiety disorders. In Diagnostic and statistical manual of mental disorders (5th ed.). Arlington, VA: Author. doi:
10.1176/appi.books.9780890425596.dsm05
Banks, W. P. (1970). Signal detection theory and human memory. Psychological Bulletin 74(2), 81-99.
Barrett, L. F. (2006). Solving the emotion paradox: Categorization and the experience of emotion. Personality and Social Psychology Review, 10, 20-46.
Barrett, L. F. (2017). The theory of constructed emotion: an active inference account of
interoception and categorization. Social Cognitive and Affect Neuroscience, 12(1), 1-23. Barrett, L. F., & Bliss-Moreau, E. (2009). Affect as a psychological primitive. Advances in
Experimental Social Psychology, 41, 167-218.
Barrett, L. F., Quigley, K. S., Bliss-Moreau, E., & Aronson, K. R. (2004). Interoceptive sensitivity and self-reports of emotional experience. Journal of Personality and Social Psychology, 87, 684–697.
Bliss-Moreau, E., Machado, C. J., & Amaral, D. G. (2013). Macaque cardiac physiology is sensitive to the valence of passively viewed sensory stimuli. Public Library of Science ONE, 8(8): e71170. doi:10.1371/journal.pone.007117
Cacioppo, J. T., Uchino, B. N., & Berntson, G. G. (1994). Individual differences in the autonomic origins of heart rate reactivity: The psychometrics of respiratory sinus arrhythmia and preejection period. Psychophysiology, 31(4), 412-419.
Chanes, L., & Barrett, L. F. (2016). Redefining the role of limbic areas in cortical processing. Trends in Cognitive Science, 20(2), 96-106.
Christensen, K. J., Fink, P., Toft, T. Frostholm, L., Ørnbol, E., & Olesen, F. (2005). A brief case-finding questionnaire for common mental disorders: The CMDQ. Family Practice, 22(4), 448-457.
Craig, A. D. (2009). How do you feel– now? The anterior insula and human awareness. Nature Reviews Neuroscience, 10, 59-70.
Craig, A. D. (2011). Significance of the insula for the evolution of human awareness of feelings from the body. Annals of the New York Academy of Sciences, 1225, 72-82.
Craig, A. D., Chen, K., Bandy, D., & Reiman E. M. (2000). Thermosensory activation of insular cortex. Nature Neuroscience, 3(2), 184-190.
Critchley, H. D., & Nagai, Y. (2012). How emotions are shaped by bodily states. Emotion Review, 4(2), 163-168.
Critchley, H. D., Wiens, S., Rotshtein, P., Öhman, A., & Dolan, R. J. (2004). Neural systems supporting interoceptive awareness. Nature Neuroscience, 7(2), 189-195.
Diener, E., Larsen, R. J., Levine, S., & Emmons, R. A. (1985). Intensity and frequency: Dimensions underlying positive and negative affect. Journal of Personality and Social Psychology, 48(5), 1253-1265.
Domschke, K., Stevens, S., Pfleiderer, B., & Gerlach, A. L. (2010). Interoceptive sensitivity in anxiety and anxiety disorders: An overview and integration of neurobiological findings. Clinical Psychology Review, 30, 1-11.
Frank, S., Colliver, J. A., & Frank, A. (1986). The electrocardiogram in obesity: Statistical analysis of 1029 patients. Journal of American College of Cardiology, 7(2), 295-299. James, W. (1884). What is an emotion? Mind, 9(34), 188-25.
Kassam, K. S., & Mendes ,W. B. (2013). The effects of measuring emotion: Physiological reactions to emotional situations depend on whether someone is asking. Public Library of Science ONE, 8(6): e64959. doi: 10.1371/journal.pone.0064959
Kirschbaum, C., Pirke, K., & Hellhammer, D. H. (1993). The ‘Trier Social Stress Test’ – A tool for investing psychobiological stress responses in a laboratory setting.
Neuropsychobiology, 28, 76-81.
Kleckner, I. R., Wormwood, J. B., Simmons, K., Barrett, L. F., & Quigley, K. S. (2015). Methodological considerations for a heartbeat detection-based measure of interoceptive sensitivity. Psychophysiology 52, 1432-1440.
Kuppens, P., Van Mechelen, I., Nezlek, J. B., Dossche, D., & Timmermans T. (2007). Individual differences in core affect variability and their relationship to personality and
psychological adjustment. Emotion, 7(2), 262-274.
Lange, C. G. (1885). The mechanisms of emotion [Trans.]. In B. Rand (Ed.), The classical psychologists (pp. 672-684). Boston: Houghton Mifflin.
Larsen, R. J., & Diener, E. (1987). Affect intensity as an individual difference characteristic: A review. Journal of Research in Personality, 21, 1-39.
Levenson, R. W. (2014). The autonomic nervous system and emotion. Emotion Review, 6(2), 100-112.
Lindquist, K. A. (2013). Emotions emerge from more basic psychological ingredients: A modern psychological constructionist model. Emotion Review, 5(4), 356-368.
Mehling, W. E., Price, C., Daubenmier, J. J., Acree, M., Bartmess, E., & Stewart, A. (2012). The Multidimensional Assessment of Interoceptive Awareness (MAIA). Public Library of Science ONE, 7(11): e48230. doi: 10.1371/journal.pone.0048230
Mendes, W. B. (2016). Emotion and the autonomic nervous system. In L. F. Barrett, M. Lewis, & J. Haviland-Jones (Eds.), Handbook of emotion (4th ed.). New York: Guilford. Ottaviani, C., Shapiro, D., Davydov, D. M., & Goldstein, I. B. (2008). Autonomic stress
response modes and ambulatory heart rate level and variability. Journal of Psychophysiology, 22(1), 28-40.
Quigley, K. S., & Barrett, L. F. (2014). Is there consistency and specificity of autonomic changes during emotional episodes? Guidance from the conceptual act theory and
psychophysiology. Biological Psychology, 98, 82-94.
Russell, J. A. (1980). A circumplex model of affect. Journal of Personality and Social Psychology, 39(6), 1161-1178.
Russell, J. A., & Barrett, L. F. (1999). Core affect, prototypical emotional episodes, and other things called emotion: Dissecting the elephant. Journal of Personality and Social Psychology, 76(5), 805-819.
Schachter, S., & Singer, J. E. (1962). Cognitive, social, and physiological determinants of emotional state. Psychological Review, 69(50, 379-399.
Schandry, R. (1981). Heart beat perception and emotional experience. Psychophysiology, 18(4), 483-488.
Scherer, K. R. (2005). What are emotions? And how can they be measured? Social Science Information, 44(4), 695-729. doi: 10.1177/0539018405058216
Shields, S. A., Mallory, M. E., & Simon, A. (1989). The Body Awareness Questionnaire: Reliability and validity. Journal of Personality Assessment, 53(4), 802-815. Sogaard, H. J., & Bech, P. (2009). Psychometric analysis of Common Mental Disorders -
Screening Questionnaire (CMD-SQ) in long term sickness absence. Scandinavian Journal of Public Health, 37, 855-863.
Thomas, A., Chess, S., & Birch, H. G. (1970). The origin of personality. Scientific American, 223, 102-109.
Verduyn, P., & Brans, K. (2012). The relationship between extraversion, neuroticism and aspects of trait affect. (2011). Personality and Individual Differences, 52(6), 664-669.
Watson, D., Clark, L. A., & Tellegen, A. (1988). Development and validation of brief measures of positive and negative affect: The PANAS scales. Journal of Personality and Social Psychology, 54(6), 1063-1070.