Article
Towards a Conceptual Framework for
Social-Ecological Systems Integrating Biodiversity
and Ecosystem Services with Resource
Efficiency Indicators
Nina Eisenmenger1,*, Stefan Giljum2, Stephan Lutter2, Alexandra Marques3,4,6, Michaela C. Theurl1, Henrique M. Pereira3,4,5and Arnold Tukker6,7
1 Institute of Social Ecology (SEC), Alpen-Adria Universitaet Klagenfurt-Wien-Graz, Schottenfeldgasse 29,
A-1070 Vienna, Austria; [email protected]
2 Institute for Ecological Economics, Vienna University of Business and Economics, Welthandelsplatz 1/D5,
1020 Vienna, Austria; [email protected] (S.G.); [email protected] (S.L.)
3 German Centre for Integrative Biodiversity Research (iDiv), Halle-Jena-Leipzig, Deutscher Platz 5e,
04103 Leipzig, Germany; [email protected] (A.M.); [email protected] (H.M.P.) 4 Institute of Biology, Martin Luther University Halle-Wittenberg, Am Kirchtor 1,
06108 Halle (Saale), Germany
5 Cátedra Infraestruturas de Portugal-Biodiversidade, CIBIO/InBIO, Universidade do Porto,
Campus Agrário de Vairão, 4485-661 Vairão, Portugal
6 Institute of Environmental Sciences (CML), Leiden University, P.O. Box 9518, 2300 RA/Einsteinweg 2,
2333 CC Leiden, The Netherlands; [email protected]
7 Netherlands Organisation for Applied Scientific Research TNO, Van Mourik Broekmanweg 6, 2628XE Delft,
The Netherlands
* Correspondence: [email protected]; Tel.: +43-1-5224000 (ext. 408); Fax: +43-463-2700-99401
Academic Editor: Vincenzo Torretta
Received: 23 October 2015; Accepted: 9 February 2016; Published: 25 February 2016
Abstract:In this article we develop a comprehensive conceptual framework for resource efficiency indicators with a consistent link of resource use to the socio-economic system and activities therein as well as to the natural system and its ecosystem functioning. Three broad groups of indicators are defined: (1) resource use indicators representing pressures on the environment; (2) resource efficiency indicators relating resource use indicators to the socio-economic side; and (3) environmental impact indicators linking resource use impacts on the state of the natural system. Based on this conceptual framework we develop a structure for possible resource efficiency indicators and conduct a RACER evaluation on the Relevance, Acceptance, Credibility, Easiness and Robustness of indicators. With the RACER evaluation, we identify areas where indicators are well established and available as well as areas where indicators still need further development or even need to be designed first.
Keywords:resource efficiency; biodiversity; ecosystem services; indicators
1. Introduction
Ecological economics and industrial ecology are interdisciplinary areas of research focused on the study of the interactions between socio-economic systems and the natural environment. Commonly, these interactions are studied by investigating and monitoring the use of resources by society (the input-side) and the amount of wastes released to nature (the output side). The underlying concept is the one of societal or industrial metabolism [1–5], which considers societies as equivalent to organisms, characterized by the resource inputs and outputs required to produce and maintain socio-economic
stocks and processes. The concept of social metabolism links into both spheres, the socio-economic system and the natural system, and societies form a hybrid of material and symbolic realm [6]. Resource use is, on the one hand, aiming at providing benefits or services to the socio-economic system and, on the other hand, interfering in ecosystem functioning in the natural system. The overall goal of sustainable development is to maximize socio-economic benefits and at the same time minimizing the effects on the natural system. Most commonly, the socio-economic benefits are expressed as economic production or growth (measured as gross domestic production (GDP)), which should be decoupled from resource use [7–9].
The physical scale of socio-economic activities and the limitations to these in terms of maintaining the processes of the Earth System operating within known and safe limits [10–12] are very much in discussion both in research and in policy debates. In recent years, concerns with sustainable development issues have led to the development of policy initiatives on resource efficiency, which aim at maximizing the economic output derived per unit of physical input needed (or physical output produced). For example, the European Union (EU) published, in 2011, a flagship initiative and a roadmap towards a “resource-efficient Europe” [13]; the United Nations Environment Programme (UNEP) launched the International Resource Panel in 2007 [14], which provides “assessment on the sustainable use of natural resources and the environmental impacts of resource use” [14]; and the Organisation for Economic Co-operation and Development (OECD) published a Recommendation on “Material Flows and Resource Productivity” in 2004 and provides regular assessments for the OECD countries [15,16]. Despite resource efficiency being used as the concept to capture sustainability problems, there is not yet a conceptual framework available that clearly puts socio-economic activities, resource use, and environmental impacts on the natural system, biodiversity and ecosystem functioning in relation to each other (see also [17]). Additionally, in these policies, the term resource is based on a very broad definition that encompasses very different physical dimensions such as material extraction or land use or biodiversity. The EU policy for example addresses materials, energy, water and land as resources and as the core focus of action needed, but in addition also requests the consideration of wastes and emissions as well as biodiversity and ecosystem services when discussing resource efficiency [18,19]. This is so far implemented by a proposal of one headline indicator (GDP per unit of material use; see [13]) complemented by a dashboard of indicators. Indicators on and methods for materials use, CO2emissions, biodiversity loss, water exploitation, expansion of
settlement area etc. are often developed in isolation and listed next to each other and lacking a clear conceptual relation or causal link between them (see also [5]). Conceptual frameworks either focus on the socio-economic system and related pressure indicators such as environmental accounting tools (SEEA) [20], Eurostat [21], OECD [22], Environmentally Extended Input-Output Models (EEIO) [23,24], or they put all socio-economic activities in a bundle side by side to ecosystem functioning without detailing the linkages between different aspects of the socio-economic activities (e.g., resource use by production and emissions by consumption) and ecosystem functioning; e.g., Millennium Ecosystem Assessment (MEA) [25], The Economics of Ecosystems and Biodiversity (TEEB) [26], IPBES [27], or the EU and UN framework on ecosystem assessment [28,29].
2. Society–Nature Interactions and Their Physical Representation
Societies extract resources from the natural system, or change the natural system in a way that it becomes more useful for societal needs [6]. These society–nature interactions can be understood as metabolic or colonizing (or managing) activities [2–4,30,31]. Metabolic activities, described by the concept of social or industrial metabolism [2,4,5,32], refer to the flows of raw materials, energy carriers and water that enter the socio-economic system in order to maintain, built up or run socio-economic stocks and leave it later again as wastes and emissions emitted to the natural system. These natural resources are processed and transformed during economic production along economic sectors and are finally “consumed” by households or governments or accumulated in anthropogenic stocks. At the end of the societal use phase, physical goods are transformed to wastes and emissions, which are emitted to the natural system (outputs from the socio-economic system) and have to be absorbed and reintegrated into natural cycles [33]. Accounting for and monitoring resource use and biophysical anthropogenic stocks (such as build infrastructure or houses as well as durable consumer goods) allows for analyzing the biophysical structures and overall dimension of a society’s activities. Material or energy flow accounts (in metric tons or Joules) are the statistical methods to monitor material and energy use in close correspondence to economic accounts. These two accounting procedures as well as the definition of derived indicators is well established and broadly implemented [20,34–40]. Water use is another physical accounting routine also implemented in the statistical reporting procedures [41,42]; however, its alignment with the system of national accounts is still in process. Societies also interfere with the natural system by colonizing or managing activities [3,43], which refer to deliberate interventions of a society in natural systems in order to make them more useful for socio-economic purposes. Management activities include changes and interference into land and biomass cycles (e.g., plowing of land, cultivating activities,etc.), water resources and water sheds (river regulation and dams). These management activities are also termed land use or water use. Metabolic and colonizing activities directly take place at the society–nature interface and represent most interventions of societies onto nature; thus, these activities are directly linked to socio-economic activities.
Society–nature interactions do not only have a biophysical dimension (the tons or Joules extracted and used) but are also determined by the socio-economic system through their cultural, social, economic and political structures and programs [6]; in turn, socio-economic structures and processes are also adapted to and shaped by the biophysical and ecological surrounding in a co-evolutionary process [44,45].
Ecosystem functioning and biodiversity are also different processes as compared to material or energy inputs so economic processes. Ecosystem functioning can be assessed using the ecosystem services framework. Ecosystem services (ES) can be defined as the direct and indirect contribution of ecosystems to human well being [48]. Four types of ecosystem services can be distinguished: provisioning, regulating, cultural and supporting services.Provisioning servicesare all the resources extracted from the natural system and that are used in socio-economic processing. They are the abiotic resources (metals, minerals, and fossil energy carriers) provided mainly by the lithosphere and the biotic resources (fish stock, freshwater body, and biomass stock) provided by ecosystems. Regulating servicescan be considered the benefits that people derive from the regulation of ecosystem processes, for example the absorption of societal outputs (wastes and emissions) by natural cycles [49]. Cultural servicesrefer to all nonmaterial “uses” of society that can produce socio-economic value (in a monetary as well as a non-monetary sense). For example, landscape available for recreational purposes and tourism, the aesthetic appreciation, inspirational and educational purposes (see Chapter 3 in [50]). Supporting servicesdescribe the basic functioning of ecosystems such as net primary production or soil formation. Supporting services can be seen as the essential basis enabling for all other ecosystem services provided to societies; for this reason, some do not consider them as services but rather a function of ecosystems [51]. Trade-offs may occur between the different categories of ecosystem services due to transformation of ecosystems: for example, increasing fishing is achieved at the cost of changes in the food web structure and the regulation of trophic cascades [52].
Ecosystems hold stocks of natural resources that become an ES when they are turned into a flow (resource use flows) to the socioeconomic system. The capacity of an ecosystem to provide ES in the long term, in a sustainable way, is called ES capacity [53,54]. ES capacity can change over time due to management decisions [53,54]. If the flow of ES is higher than capacity then there is an unsustainable use of ES. The unsustainable use of an ES over time will damage the ES capacity and reduce the available stocks of ES.
Measuring environmental impacts in the sense of changes in the natural environment driven by socio-economic activities are most commonly assessed by measures of biodiversity loss or changes in ecosystem functioning [55,56]. It is, however, difficult to link these indicators and processes to resource use or socio-economic activities. However, to understand the environmental impacts of societies on the natural system, and in particular on the ecosystem services, we have to relate resource use to processes or stocks in the natural system. The need for this integrative perspective has already been emphasized in policy initiatives in the field of biodiversity and ecosystems. For example, the Strategic Plan for Biodiversity 2011–2020, from the Convention on Biological Diversity has a set of 20 targets [57], which seek not only traditional conservation objectives but also more society oriented ones. Targets under Strategic Goal A (Aichi Targets 1 to 4) aim to address the underlying causes of biodiversity loss by mainstreaming it across governments and society. These targets have also been identified as those having the highest level of interactions with the other targets, hence having the potential to strongly contribute to the reduction of biodiversity loss and ecosystems degradation [58]. It is thus essential to develop a strong link between resource use frameworks and the natural system.
(particulate matter), ecotoxicity, ionizing radiation (human health and ecosystems), resource depletion (abiotic materials and water) and land use. LCA studies thus far have not been applied to the macro level. Currently, attempts are made to develop comprehensive indicators such as the “Environmental Pressure Index” and “Policy Performance Index” [62].
3. Proposal for an Indicator Framework Structured along Three Parts: Resource Use, Resource Efficiency and Environmental Impacts
In the following, we will propose a conceptual framework for society–nature interactions and resource use that aims at linking metabolic and colonizing activities to socioeconomic processes as well as to their environmental impacts in the natural system. In this way, we intend to contribute to a structuring of resources, resource use and resource efficiency that better supports policy programs.
Figure1illustrates the hybrid structure of the socioeconomic and the natural system as two overlapping spheres rather than one being the subset of the other [5,6]. Physical flows crossing the border between the two spheres comprise resource use in the form of material (including regenerative and non-regenerative resources), energy and water inputs as well as outputs to nature (wastes and emissions) (Pauliuk and Hertwich [5] (p.88) add a further differentiation to these interactions by introducing seven compartments). Land is a cross-cutting resource, which is not physically extracted and entering the socioeconomic system, but is the area and location of socioeconomic infrastructure, of extractive activities (e.g., mines) as well as ecosystems. Physical flows crossing the border between society and nature can be captured by environmental accounting frameworks [20,35,38] and are referred to as pressure indicators. We consider these resource use flows as the central flows between the socio-economic system and the natural system, which need to be linked to both spheres in order to capture resource efficiency and environmental impacts. The structure for the conceptual framework thus differentiates three perspectives: (1) resource use as the direct exchange between society and nature representing the total physical scale of these society–nature interactions; (2) resource efficiency as the link between resource use and socio-economic services derived; and (3) environmental impacts as the effect of socio-economic resource use on natural stocks and ecosystem functioning.
Sustainability 2016, 8, 201 5 of 14
3. Proposal for an Indicator Framework Structured along Three Parts: Resource Use, Resource
Efficiency and Environmental Impacts
In the following, we will propose a conceptual framework for society–nature interactions and
resource use that aims at linking metabolic and colonizing activities to socioeconomic processes as
well as to their environmental impacts in the natural system. In this way, we intend to contribute to
a structuring of resources, resource use and resource efficiency that better supports policy programs.
Figure 1 illustrates the hybrid structure of the socioeconomic and the natural system as two
overlapping spheres rather than one being the subset of the other [5,6]. Physical flows crossing the
border between the two spheres comprise resource use in the form of material (including regenerative
and non‐regenerative resources), energy and water inputs as well as outputs to nature (wastes and
emissions) (Pauliuk and Hertwich [5] (p.88) add a further differentiation to these interactions by
introducing seven compartments). Land is a cross‐cutting resource, which is not physically extracted
and entering the socioeconomic system, but is the area and location of socioeconomic infrastructure,
of extractive activities (e.g., mines) as well as ecosystems. Physical flows crossing the border between
society and nature can be captured by environmental accounting frameworks [20,35,38] and are
referred to as pressure indicators. We consider these resource use flows as the central flows between
the socio‐economic system and the natural system, which need to be linked to both spheres in order
to capture resource efficiency and environmental impacts. The structure for the conceptual
framework thus differentiates three perspectives: (1) resource use as the direct exchange between
society and nature representing the total physical scale of these society–nature interactions; (2)
resource efficiency as the link between resource use and socio‐economic services derived; and (3)
environmental impacts as the effect of socio‐economic resource use on natural stocks and ecosystem
functioning.
Figure 1. Conceptual framework of resource use activities linking socio‐economic processes and natural processes.
When talking about the sustainable use of resources, we want to emphasize the importance of
considering resource use in its absolute scale, and thus independent from either the impact on the
Figure 1. Conceptual framework of resource use activities linking socio-economic processes and
When talking about the sustainable use of resources, we want to emphasize the importance of consideringresource use in its absolute scale, and thus independent from either the impact on the environment or the efficiency of its use for societies. The absolute scale of all biophysical flows is a necessary measure which can be contrasted with the biophysical limits of our earth system, as previously discussed for, e.g., fossil energy related carbon emissions and water extraction [63]. This type of resource use indicators has a major advantage of directly linking to both mutually interacting systems: the socio-economic activities, which induce extractive activities in mining and agriculture, as well as the natural system. Finally, resource use indicators are easily available because they are—mostly—part of standard statistical reporting and they use physical units without any normative interpretation, such as weighting per impacts,etc., and which makes these indicators comparable across temporal and spatial scales. They are easily available in time series and are also consistent with economic thinking and reporting, for example, through the System of Integrated Economic and Environmental Accounts (SEEA) [20] and thus provide a good complement to economic reporting in monetary units.
Considering the different definitions and understanding of a natural resource, it is necessary to differentiate between potentially available resources (a stock) and resource use (a flow), which is the actual, deliberate intervention of the socio-economic system with the aim of deriving a certain use or service to society. Resource use flows (inputs to the socioeconomic system) are used to maintain and built up socioeconomic stocks (see also [5]). Resource efficiency is about using natural resources efficiently, or in other words minimizing the flow from or to the natural environment and maximizing socio-economic outputs. Consequently, resources (stocks) cannot be “efficient” themselves; resource efficiency is rather “resource use efficiency”,i.e., an efficiency in relation to the resource use flow.
Relating resource use indicators to the socio-economic side is what is commonly termed “resource efficiency”. Two perspectives can be taken in this regard: relating resource use to economic production and value added, or to the societal services provided by natural resource use [64]. The first is about relating resource use to production (intermediate use) or final consumption (in economic terms final demand). For sectors associated with specific technologies, the relation between resource use and value added reflects the sector’s specific resource efficiency. In general, these relations result in various types of resource efficiency, i.e., economic output or value added per unit of resource input or waste/emission output. GDP is the most common indicator to which resource use is related and the GDP/resource use ratio, expressing the economic value generated by the amount of used resources, is comparable to labor productivity for example. However, other macro or beyond GDP indicators, such as subjective well-being, can also be linked to resource use indicators, in order to investigate other dimensions of efficiencies [65–67]. The second perspective puts resource use,i.e., biophysical inputs or accumulated outputs, into relation with the societal service generated. Services can be adequate housing facilities, heated rooms, nutrition, possibilities for commuting (mobility), or electricity for running various appliances. These relations are difficult to tackle on the macro level but much better addressed on a rather detailed, even micro level such as total energy consumption per m2for space heating, efficiency of cars and household appliances, bathing water quality, or calorie intake per capita. The two perspectives on production and consumption fit nicely with the structure of environmentally-extended input–output tables [23,24,68], which have been increasingly and broadly used to trace resource inputs to and through the economy and thus allocating resource inputs to final demand. The environmental extensions represent the resource use indicators and data,i.e., pressure indicators in absolute values.
a qualitative perspective. The quantitative perspective captures the pressure indicators in relation to the size of the stocks of the natural resource. For example, the amount of water extraction in relation to the amounts of available water (e.g., addressed by the water exploitation index) indicates a potential quantity-related impact due to scarcity of water available for ecosystems. Other examples for the quantitative impact are carbon emissions in relation to the current carbon concentration in the atmosphere, or extraction of crude oil in relation to oil reserves. These relations are closely linked to the socio-economic system and addresses “resource depletion”,i.e., how much reduction to or change in the natural stocks is caused by societal activities.
However, this quantitative relation does not consider the different qualities of ecosystems and their capability to deal with interventions, thus demanding for a second, qualitative perspective. Examples for the qualitative impact perspective are biomass extraction in relation to the productivity of the local land area; or carbon emissions in relation to the carbon sequestration potential. This qualitative perspective goes beyond a mere evaluation of scales and natural stocks but also considers the complex functioning of ecosystems.
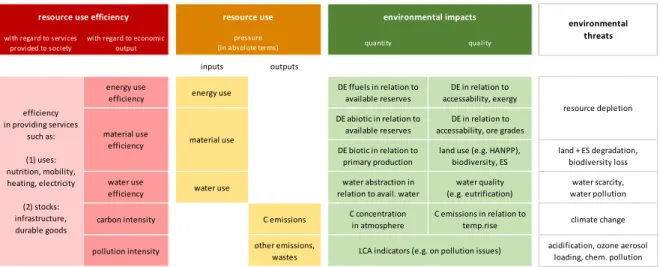
Linking the three perspectives (i.e., resource use and resource efficiency and environmental impacts) and the different resource categories, we generate a two-dimensional indicator framework, which is presented in Figure2.
Sustainability 2016, 8, 201 7 of 14
for the quantitative impact are carbon emissions in relation to the current carbon concentration in the
atmosphere, or extraction of crude oil in relation to oil reserves. These relations are closely linked to
the socio‐economic system and addresses “resource depletion”, i.e., how much reduction to or change
in the natural stocks is caused by societal activities.
However, this quantitative relation does not consider the different qualities of ecosystems and
their capability to deal with interventions, thus demanding for a second, qualitative perspective.
Examples for the qualitative impact perspective are biomass extraction in relation to the productivity
of the local land area; or carbon emissions in relation to the carbon sequestration potential. This
qualitative perspective goes beyond a mere evaluation of scales and natural stocks but also considers
the complex functioning of ecosystems.
Linking the three perspectives (i.e., resource use and resource efficiency and environmental
impacts) and the different resource categories, we generate a two‐dimensional indicator framework,
which is presented in Figure 2.
Figure 2. Comprehensive framework for resource efficiency indicators. Note: Legend: C = carbon;
ffuel = fossil fuels; HANPP = Human appropriation of net primary production (see [69]); DE =
domestic extraction; ES = ecosystem services; LCA = life‐cycle assessment.
The indicator framework presented in Figure 2 translates the conceptual framework of Figure 1
into more practical terms. In the middle, we place resource use indicators that measure physical flows
crossing the society–nature boundary (both inputs and outputs) in absolute terms. These indicators
represent the absolute physical scale of societies. The link of resource use to the socioeconomic system
represents resource efficiency. Resource use is either put in relation to the macro‐economic output
(e.g., GDP derived per unit of material use, i.e., material efficiency; or CO2 emissions per unit of GDP,
i.e., carbon intensity), or put in relation to a desired socioeconomic service (e.g., transport, housing,
nutrition, etc.).
Links to the natural system are covered in the green columns on the right. They cover on the one
hand side the quantitative relation to available natural stocks and thus address issues such as
resource depletion. The other dimension that has to be considered is a qualitative one: water use is
not just a matter of the total amount of water available in the local water shed but also relates to the
water quality, the ecosystems around and their water requirements, or possible tipping points of the
respective ecosystem interfered in. Alternatively, in the case of metals, natural reserves differ with
regard to their metal concentration (measured as ore grades) or accessibility of the metal ore.
The effects on the natural system are manifold and highly complex; they are not as static and
distinct as suggested by Figure 2. On the contrary, there are many cross‐links such as water use, which
also has an effect on land degradation, or emissions, which also have an effect on water body and
quality. A conceptual framework and a set of indicators are likely to fail in terms of covering all
possible links and causal relations. However, a reduction of the complexity is necessary. We therefore
suggest focusing on key threats identified by the Millennium Ecosystem Assessment [56] or by
with regard to services
provided to society
with regard to economic
output quantity quality
inputs outputs
energy use
efficiency energy use
DE ffuels in relation to
available reserves
DE in relation to
accessability, exergy
DE abiotic in relation to
available reserves
DE in relation to
accessability, ore grades DE biotic in relation to
primary production
land use (e.g. HANPP),
biodiversity, ES
land + ES degradation, biodiversity loss water use
efficiency water use
water abstraction in
relation to avail. water
water quality
(e.g. eutrification)
water scarcity,
water pollution
carbon intensity C emissions C concentration
in atmosphere
C emissions in relation to
temp.rise climate change
pollution intensity other emissions,
wastes
acidification, ozone aerosol
loading, chem. pollution
LCA indicators (e.g. on pollution issues)
efficiency
in providing services
such as:
(1) uses:
nutrition, mobility,
heating, electricity
(2) stocks:
infrastructure,
durable goods
material use
efficiency
resource use
pressure (in absolute terms)
environmental
threats
resource depletion
material use
resource use efficiency environmental impacts
Figure 2.Comprehensive framework for resource efficiency indicators. Note: Legend: C = carbon;
ffuel = fossil fuels; HANPP = Human appropriation of net primary production (see [69]); DE = domestic extraction; ES = ecosystem services; LCA = life-cycle assessment.
The indicator framework presented in Figure2translates the conceptual framework of Figure1 into more practical terms. In the middle, we place resource use indicators that measure physical flows crossing the society–nature boundary (both inputs and outputs) in absolute terms. These indicators represent the absolute physical scale of societies. The link of resource use to the socioeconomic system represents resource efficiency. Resource use is either put in relation to the macro-economic output (e.g., GDP derived per unit of material use,i.e., material efficiency; or CO2emissions per unit of GDP, i.e., carbon intensity), or put in relation to a desired socioeconomic service (e.g., transport, housing, nutrition,etc.).
respective ecosystem interfered in. Alternatively, in the case of metals, natural reserves differ with regard to their metal concentration (measured as ore grades) or accessibility of the metal ore.
The effects on the natural system are manifold and highly complex; they are not as static and distinct as suggested by Figure2. On the contrary, there are many cross-links such as water use, which also has an effect on land degradation, or emissions, which also have an effect on water body and quality. A conceptual framework and a set of indicators are likely to fail in terms of covering all possible links and causal relations. However, a reduction of the complexity is necessary. We therefore suggest focusing on key threats identified by the Millennium Ecosystem Assessment [56] or by Rockströmet al.[10] in their article on planetary boundaries: climate change, land degradation and land use change, biodiversity loss, freshwater use, nitrogen and phosphorus cycles, and major pollution issues (chemical pollution, aerosol loading, ocean acidification, and stratospheric ozone depletion). Pressure indicators in direct relation to these threats are biomass extraction, land use as well as CO2emissions. With regard to CO2emissions, the climate change debate and indicator
development therein is highly advanced. We can easily draw on the indicators developed there. Biomass use, water use and land use issues are highly interlinked and can be addressed by indicators related to indicators on net primary production (NPP) such as HANPP (Human Appropriation of Net Primary Production) [70,71]. High primary production (implemented as NPP) and high biodiversity are considered fundamental indications of intact ecosystems. Both are threatened by land degradation and desertification. Furthermore, biodiversity and NPP are in themselves strongly linked. Which indicators or which set of indicators best selected and put in relation to biomass extraction still needs to be developed.
We have thus far referred to the interactions of a nation state to the natural environment. However, domestic resource use induces resource use outside the economy of observation due to highly interlinked supply- and use-chains in global markets. Thus, indicators considering the total global resource demand associated with domestic production and consumption,i.e., including resources used outside the economy of observation, are increasingly requested [63,72–74]. Those indicators with a global scope allow for reflecting possible outsourcing of environmental burden from one country to other world regions. Consumption-based or footprint-type indicators are so far only weakly covered in policy programs and need to be developed.
4. Resource-Efficiency Indicators—Where Do We Stand?
We have applied our indicator classification framework to existing indicator sets in order to assess how well they cover all three aspects of resource efficiency. We investigated seven indicator sets addressing sustainable resource use and the indicator coverage therein: (1) Environmental Data Centre on Natural Resources, which includes around 40 indicators [75]; (2) EEA Core set of indicators (CSI), which includes 37 indicators [76]; (3) EEA Sustainable consumption and production indicators (SCP), which includes 39 indicators [77]; (4) Eurostat Sustainable Development Indicators (SDI) which selects ca. 46 indicators [78]; (5) Europe 2020, which has around eight indicators [79]; (6) UNEP yearbook Key Environmental Indicators, which includes 15 indicators [80]; and (7) OECD Environmental and green growth indicators with 25 indicators under “environment” [81].
In most indicator sets, the state of the environment as well as the policy effectiveness of indicators is clearly underrepresented. Finally, most indicators focus on a national (or territorial) scale while not considering the global aspect of resources use. In the case of water use, the global perspective is covered, however for energy, material and land, footprint-based indicators (or life-cycle-based indicators) only represent 10% or less of all indicators integrated in the indicator sets.
For all resource categories, around half of the indicators were given in absolute values. For material use, indicators were also used in per capita values as well as shares. Efficiency (e.g., DMC/GDP, GJ/m2,€/tonne,etc.) made up only 10% of all material use indicators. Likewise for energy use, with the only difference that shares gain higher importance as compared to per capita values. We see that absolute indicators are well represented across the material categories. The importance of the total scale of the socio-economic systems seems to be broadly covered. However, efficiencies (besides indices) are least represented. Neither technical efficiencies, nor the efficiency in relation to natural stocks are yet in the focus of indicator sets. (For more details on the indicator sets and indicator selection, see [82]).
We then grouped the available indicators in the indicator framework described above and conducted a RACER evaluation, with RACER stands for Relevant, Accepted, Credible, Easy and Robust. The European Commission specified in its publication “Impact Assessment Guidelines” [83] that indicators should not only be scientifically sound and robust but should be equally valuable for policy making. RACER is an evaluation framework applied to assess exactly this,i.e., the value of scientific tools for use in policy making. The RACER methodology evaluates indicators according to five criteria: Relevance, Acceptance, Credibility, Easiness and Robustness. Relevance is given if the indicator is closely linked to the objectives to be reached; acceptability is given if the indicator is perceived and used by policy makers and civil society; credibility is measuring the methodological transparency; easiness to compile indicates the possibility to produce readily available data; and robustness indicates high data quality. For each of the five criteria, two to five sub-criteria were identified and defined (for further details on the RACER analysis see supplementary material or [82]). Applying the RACER framework allows assessing the general value of scientific tools for their use in policy making and providing an indication on the general properties and quality standards of indicators. The RACER framework has been applied in previous studies on indicators for the Resource Strategy for DG Environment [64,84] and in research projects such as Wiedmannet al.[85].
Sustainability 2016, 8, 201 9 of 14
We see that absolute indicators are well represented across the material categories. The importance
of the total scale of the socio‐economic systems seems to be broadly covered. However, efficiencies
(besides indices) are least represented. Neither technical efficiencies, nor the efficiency in relation to
natural stocks are yet in the focus of indicator sets. (For more details on the indicator sets and
indicator selection, see [82]).
We then grouped the available indicators in the indicator framework described above and
conducted a RACER evaluation, with RACER stands for Relevant, Accepted, Credible, Easy and
Robust. The European Commission specified in its publication “Impact Assessment Guidelines” [83]
that indicators should not only be scientifically sound and robust but should be equally valuable for
policy making. RACER is an evaluation framework applied to assess exactly this, i.e., the value of
scientific tools for use in policy making. The RACER methodology evaluates indicators according to
five criteria: Relevance, Acceptance, Credibility, Easiness and Robustness. Relevance is given if the
indicator is closely linked to the objectives to be reached; acceptability is given if the indicator is
perceived and used by policy makers and civil society; credibility is measuring the methodological
transparency; easiness to compile indicates the possibility to produce readily available data; and
robustness indicates high data quality. For each of the five criteria, two to five sub‐criteria were
identified and defined (for further details on the RACER analysis see supplementary material or [82]).
Applying the RACER framework allows assessing the general value of scientific tools for their use in
policy making and providing an indication on the general properties and quality standards of
indicators. The RACER framework has been applied in previous studies on indicators for the
Resource Strategy for DG Environment [64,84] and in research projects such as Wiedmann et al. [85].
Out of the more than 160 indicators in the evaluated indicator sets, around 100 were identified
to be applicable to the conceptual framework developed (the other 60 indicators focus on socio‐
economic issues such as taxes, household size, education, etc.). The indicators were allocated to the
indicator structure (Figure 2) and entered the RACER evaluation. The results of the RACER
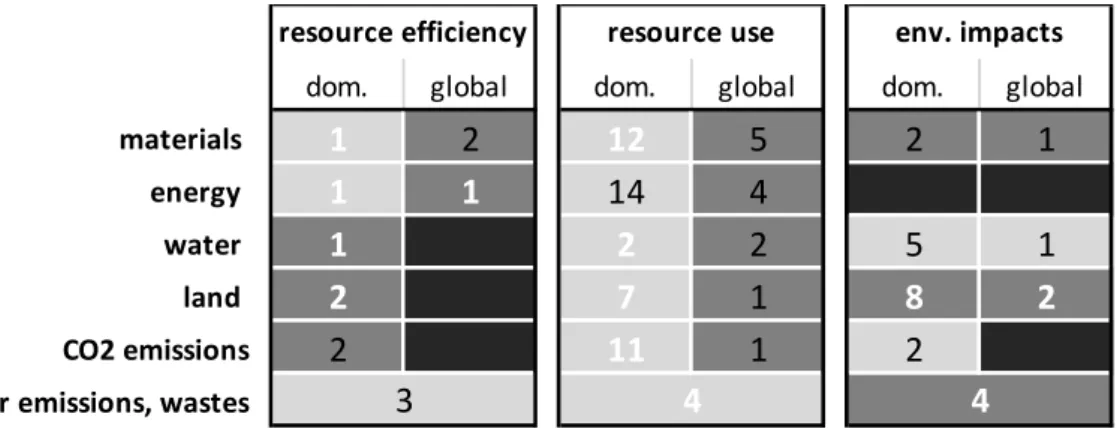
evaluation are summarized in Figure 3.
Figure 3. Evaluation of indicators according to the RACER criteria: relevance, acceptability, clarity,
easiness, robustness. Note: Legend: numbers indicate the number of indicators available. “dom.”
refers to indicators considering the national (domestic) territory of a country, “global” refers to
footprint‐type of indicators that consider global resource use. Color of cells refers to the status of
indicator development with regard to acceptability, credibility, easiness, robustness. grey: further
development needed, black: no indicator available yet, light grey: indicators well developed. Color of
font: black indicates high relevance, white indicates less relevance, i.e., indicator should be adapted to
better cover the needs of science and policy.
The RACER evaluation of available indicators showed a clear lack of footprint‐type of indicators
in all three categories. There is also a need for indicator development with regard to most indicators
in the resource efficiency and environmental impact category.
dom. global dom. global dom. global
materials
1
2
12
5
2
1
energy
1
1
14
4
water
1
2
2
5
1
land
2
7
1
8
2
CO2 emissions
2
11
1
2
other emissions, wastes
resource efficiency resource use env. impacts
3
4
4
Figure 3. Evaluation of indicators according to the RACER criteria: relevance, acceptability, clarity,
Out of the more than 160 indicators in the evaluated indicator sets, around 100 were identified to be applicable to the conceptual framework developed (the other 60 indicators focus on socio-economic issues such as taxes, household size, education,etc.). The indicators were allocated to the indicator structure (Figure2) and entered the RACER evaluation. The results of the RACER evaluation are summarized in Figure3.
The RACER evaluation of available indicators showed a clear lack of footprint-type of indicators in all three categories. There is also a need for indicator development with regard to most indicators in the resource efficiency and environmental impact category.
5. Conclusions
In this article, we propose a comprehensive conceptual framework for resource efficiency indicators. The work took its start from the gaps and needs identified in current resource efficiency programs, among those the need for indicators taking into account effects in foreign countries, the need for a better integration of biodiversity and ecosystem services as well as the limitation of natural stocks. In the article, we showed the need for a consistent link of resource use to the socio-economic system and activities therein as well as to the natural system and its ecosystem functioning. Three groups of indicators were defined: (1) Resource use indicators representing pressures on the environment are considered to be crucial because they represent the mediating flow linking socio-economic activities to natural and ecosystem functioning. Resource use indicators should be looked at in absolute values in order to capture the total scale of the society-nature interactions; (2) Relating resource use indicators to the socio-economic side is what is commonly termed “resource efficiency”. These relations have two perspectives: first, resource use related to economic products and value added. These efficiencies can be derived as direct results of an input-output framework for example. Second, resource use related to the societal services provided by natural resource use. Services can be adequate housing facilities, heated rooms, nutrition, possibilities for commuting (mobility), or electricity for running various appliances; (3) Linking resource use to the natural system (the impacts or the natural state) results in indicators that are commonly termed “environmental impacts”. We argue that these environmental impacts have a quantitative (relating pressures to the available natural stock) and a qualitative aspect (land use in relation to the land productivity). Besides that, the effects on the natural system are manifold and highly complex.
We then translated the conceptual framework into a structure for resource efficiency indicators, which is structured along the categories of resources (energy, materials, water, land on the input side, as well as CO2emissions and other wastes and emissions on the output side) and the three groups of
indicators (resource efficiency, resource use, environmental impacts quantitative and qualitative). The structure was compared to existing indicators and an RACER evaluation conducted to identify areas where indicators are well established and available as well as areas where indicators still need further development or even need to be designed first.
Findings from the conceptual and empirical work showed that in particular indicators addressing the global perspectives are not yet fully available, but efforts in providing footprint-type of indicators are increasing. Indicators on the environmental impacts are not yet well developed and in particular lack a good link to resource use and the socio-economic system. Further research is needed to address these issues.
Supplementary Materials:The following are available online at http://www.mdpi.com/2071-1050/8/3/201/s1,
Table S1: List of Indicators Entering the RACER Evaluation; Table S2: List of criteria for the “RACER” evaluation.
Acknowledgments: This research was funded by the EU-FP7 project DESIRE (FP7-ENV-2012-308552). The
authors are grateful to two anonymous reviewers whose comments have helped to improve the manuscript.
Author Contributions:Nina Eisenmenger conceived and designed the research, drafted and finalized the paper;
Conflicts of Interest:The authors declare no conflict of interest.
References
1. Ayres, R.U.; Ayres, L.W.A Handbook of Industrial Ecology; Edward Elgar: Cheltenham, UK, 2002.
2. Ayres, R.U.; Simonis, U.E.Industrial Metabolism: Restructuring for Sustainable Development; United Nations University Press: Tokyo, Japan; New York, NY, USA; Paris, France, 1994.
3. Fischer-Kowalski, M.; Haberl, H. Sustainable development: Socio-economic metabolism and colonization of nature.Int. Soc. Sci. J.1998,50, 573–587. [CrossRef]
4. Fischer-Kowalski, M.; Hüttler, W. Society’s Metabolism: The Intellectual History of Materials Flow Analysis, Part II, 1970–1998.J. Ind. Ecol.1998,2, 107–136. [CrossRef]
5. Pauliuk, S.; Hertwich, E.G. Socioeconomic metabolism as paradigm for studying the biophysical basis of human societies.Ecol. Econ.2015,119, 83–93. [CrossRef]
6. Fischer-Kowalski, M.; Weisz, H. Society as a Hybrid between Material and Symbolic Realms. Toward a Theoretical Framework of Society-Nature Interaction.Adv. Hum. Ecol.1999,8, 215–251.
7. UNEP; Fischer-Kowalski, M.; Swilling, M.; von Weizsäcker, E.U.; Ren, Y.; Moriguchi, Y.; Crane, W.; Krausmann, F.; Eisenmenger, N.; Giljum, S.;et al.Decoupling Natural Resource Use and Environmental Impacts
from Economic Growth; Report of the International Resource Panel; United Nations Environment Programme:
Paris, France, 2011.
8. Bleischwitz, R.; Welfens, P.J.J.; Zhang, Z.Sustainable Growth and Resource Productivity Economic and Global
Policy Issues; Greenleaf: Sheffield, UK, 2009.
9. Von Weizsäcker, E.U.; Hargroves, C.; Smith, M.H.; Desha, C.; Stasinopoulos, P.Factor Five: Transforming the
Global Economy through 80% Improvements in Resource Productivity; Routledge, Earthscan: London, UK, 2009.
10. Rockström, J.; Steffen, W.; Noone, K.; Persson, Å.; Chapin, F.S.; Lambin, E.F.; Lenton, T.M.; Scheffer, M.; Folke, C.; Schellnhuber, H.J.;et al. A safe operating space for humanity.Nature2009,461, 472–475. [CrossRef] [PubMed]
11. Steffen, W.; Richardson, K.; Rockstrom, J.; Cornell, S.E.; Fetzer, I.; Bennett, E.M.; Biggs, R.; Carpenter, S.R.; de Vries, W.; de Wit, C.A.;et al. Planetary boundaries: Guiding human development on a changing planet.
Science2015,347, 1259855. [CrossRef] [PubMed]
12. Liu, J.; Mooney, H.; Hull, V.; Davis, S.J.; Gaskell, J.; Hertel, T.; Lubchenco, J.; Seto, K.C.; Gleick, P.; Kremen, C.;
et al. Systems integration for global sustainability.Science2015,347, 1258832. [CrossRef] [PubMed]
13. European Commission.Roadmap to a Resource Efficient Europe; European Commission: Brussels, Belgium, 2011; pp. 1–26.
14. UNEP International Resource Panel. Available online: http://www.unep.org/resourcepanel/ (accessed on 8 April 2015).
15. OECD.Recommendation of the Council on Material Flows and Resource Productivity; OECD: Paris, France, 2004. 16. OECD.Material Resources, Productivity and the Environment; OECD Green Growth Studies; OECD Publishing:
Paris, France, 2015.
17. Huysman, S.; Sala, S.; Mancini, L.; Ardente, F.; Alvarenga, R.A.F.; de Meester, S.; Mathieux, F.; Dewulf, J. Toward a systematized framework for resource efficiency indicators.Resour. Conserv. Recycl.2015,95, 68–76. [CrossRef]
18. European Commission.A Resource-Efficient Europe–Flagship Initiative under the Europe 2020 Strategy; European Commission: Brussels, Belgium, 2011; p. 17.
19. European Commission. Thematic Strategy on the Sustainable Use of Natural Resources; Commission of the European Communities: Brussels, Belgium, 2005.
20. United Nations. System of Environmental-Economic Accounting 2012. Available online: http://ec. europa.eu/eurostat/documents/3859598/5936709/KS-01-14-120-EN.PDF/334d5c04-b630-4395-8008-94f367 12bf6bb (accessed on 15 February 2016).
21. Eurostat Environmental accounts. Available online: http://epp.eurostat.ec.europa.eu/portal/page/portal/ environmental_accounts/introduction (accessed on 3 November 2014).
23. Miller, R.E.; Blair, P.D.Input-Output Analysis: Foundations and Extensions, 2nd ed.; Cambridge University Press: Cambridge, UK; New York, NY, USA, 2009.
24. Handbook of Input-Output Economics in Industrial Ecology; Suh, S., Ed.; Eco-efficiency in Industry and Science;
Springer: Dordrecht, The Netherlands; New York, NY, USA, 2009.
25. UN. Millennium Ecosystem Assessment. Available online: http://www.millenniumassessment.org/ en/index.html (accessed on 19 April 2015).
26. UNEP. The Economics of Ecosystems & Biodiversity (TEEB). Available online: http://www.teebweb.org/ (accessed on 19 April 2015).
27. Díaz, S.; Demissew, S.; Carabias, J.; Joly, C.; Lonsdale, M.; Ash, N.; Larigauderie, A.; Adhikari, J.R.; Arico, S.; Báldi, A.;et al. The IPBES Conceptual Framework—connecting nature and people. Curr. Opin. Environ.
Sustain.2015,14, 1–16. [CrossRef]
28. EU; EEA; CHM; UN. Mapping and Assessment of Ecosystems and their Services (MAES)—Biodiversity Information system for Europe. Available online: http://biodiversity.europa.eu/maes (accessed on 23 October 2015).
29. UN. Intergovernmental Platform on Biodiversity & Ecosystem Services. Available online: http://www. ipbes.net/ (accessed on 23 October 2015).
30. Haberl, H.; Erb, K.-H.; Krausmann, F.; Loibl, W.; Schulz, N.; Weisz, H. Changes in ecosystem processes induced by land use: Human appropriation of aboveground NPP and its influence on standing crop in Austria.Glob. Biogeochem. Cycles2001,15, 929–942. [CrossRef]
31. Haberl, H.; Fischer-Kowalski, M.; Krausmann, F.; Weisz, H.; Winiwarter, V. Progress towards Sustainability? What the conceptual framework of material and energy flow accounting (MEFA) can offer.Land Use Policy 2004,21, 199–213. [CrossRef]
32. Baccini, P.; Brunner, P.H.Metabolism of the Anthroposphere: Analysis, Evaluation, Design, 2nd ed.; MIT Press: Cambridge, MA, USA, 2012.
33. Haberl, H.; Gaube, V.; Díaz-Delgado, R.; Krauze, K.; Neuner, A.; Peterseil, J.; Plutzar, C.; Singh, S.J.; Vadineanu, A. Towards an integrated model of socioeconomic biodiversity drivers, pressures and impacts. A feasibility study based on three European long-term socio-ecological research platforms.Ecol. Econ.2009,
68, 1797–1812. [CrossRef]
34. EU. Regulation on European Environmental Economic Accounts; Official Journal of the European Union;
European Parliament and of the Council: Brussels, Belgium, 2011.
35. Fischer-Kowalski, M.; Krausmann, F.; Giljum, S.; Lutter, S.; Mayer, A.; Bringezu, S.; Moriguchi, Y.; Schütz, H.; Schandl, H.; Weisz, H. Methodology and Indicators of Economy-wide Material Flow Accounting State of the Art and Reliability Across Sources.Ind. Ecol.2011,15, 855–876. [CrossRef]
36. Eurostat. Economy-Wide Material Flow Accounts and Derived Indicators. A Methodological Guide; European Commission: Luxembourg, 2001; pp. 1–85.
37. OECD. Measuring Material Flows and Resource Productivity. Volume I. The OECD Guide; OECD: Paris, France, 2008.
38. Eurostat Environmental accounts-establishing the links between the environment and the economy. Available online: http://ec.europa.eu/eurostat/statistics-explained/index.php/Environmental_accounts_-_ establishing_the_links_between_the_environment_and_the_economy (accessed on 23 October 2015). 39. Haberl, H. The Energetic Metabolism of Societies Part I: Accounting Concepts.J. Ind. Ecol.2001,5, 11–33.
[CrossRef]
40. Haberl, H.; Weisz, H.; Amann, C.; Bondeau, A.; Eisenmenger, N.; Erb, K.-H.; Fischer-Kowalski, M.; Krausmann, F. The Energetic Metabolism of the European Union and the United States: Decadal Energy Input Time-Series with an Emphasis on Biomass.J. Ind. Ecol.2006,10, 151–171. [CrossRef]
41. UN System of Environmental-Economic Accounting for Water (SEEA-Water). Available online: http://unstats.un.org/unsd/envaccounting/seeaw/ (accessed on 23 October 2015).
42. Eurostat Water statistics—Statistics Explained. Available online: http://ec.europa.eu/eurostat/ statistics-explained/index.php?title=Water_statistics&oldid=204654 (accessed on 23 October 2015). 43. Fischer-Kowalski, M.; Haberl, H.Socioecological Transitions and Global Change Trajectories of Social Metabolism
and Land Use; Edward Elgar: Cheltenham, UK; Northampton, MA, USA, 2007.
45. Foxon, T.J. A coevolutionary framework for analysing a transition to a sustainable low carbon economy.Ecol.
Econ.2011,70, 2258–2267. [CrossRef]
46. Krausmann, F.; Fischer-Kowalski, M.; Eisenmenger, N.; Schaffartzik, A.; Steinberger, J.K.; Weisz, U.Trends in the Use of Natural Resources. Annex I to the Preparatory Study for the Review of the Thematic Strategy on
the Sustainable Use of Natural Resources. Final Report prepared for the European Commission, DG Environment;
Institute of Social Ecology: Vienna, Austria, 2010.
47. Verburg, P.H.; van de Steeg, J.; Veldkamp, A.; Willemen, L. From land cover change to land function dynamics: A major challenge to improve land characterization. J. Environ. Manag. 2009,90, 1327–1335. [CrossRef] [PubMed]
48. Haines-Young, R.; Potschin, M.Common International Classification of Ecosystem Services (CICES): Consultation
on Version 4; European Environmental Agency: Kopenhagen, Denmark, 2013.
49. Cardinale, B.J.; Duffy, J.E.; Gonzalez, A.; Hooper, D.U.; Perrings, C.; Venail, P.; Narwani, A.; Mace, G.M.; Tilman, D.; Wardle, D.A.;et al. Biodiversity loss and its impact on humanity. Nature2012, 486, 59–67. [CrossRef] [PubMed]
50. Duraiappah, A.; Naeem, S.; Agardy, T.Ecosystems & Human Well-Being: Biodiversity Synthesis; World Resources Institute: Washington, WA, USA, 2005.
51. Mace, G.M.; Norris, K.; Fitter, A.H. Biodiversity and ecosystem services: A multilayered relationship.
Trends Ecol. Evol.2012,27, 19–26. [CrossRef] [PubMed]
52. Pereira, H.M.; Leadley, P.W.; Proenca, V.; Alkemade, R.; Scharlemann, J.P.W.; Fernandez-Manjarres, J.F.; Araujo, M.B.; Balvanera, P.; Biggs, R.; Cheung, W.W.L.;et al. Scenarios for Global Biodiversity in the 21st Century.Science2010,330, 1496–1501. [CrossRef] [PubMed]
53. Schröter, M.; Barton, D.N.; Remme, R.P.; Hein, L. Accounting for capacity and flow of ecosystem services: A conceptual model and a case study for Telemark, Norway.Ecol. Indic.2014,36, 539–551. [CrossRef] 54. Villamagna, A.M.; Angermeier, P.L.; Bennett, E.M. Capacity, pressure, demand, and flow: A conceptual
framework for analyzing ecosystem service provision and delivery. Ecol. Complex. 2013, 15, 114–121. [CrossRef]
55. Tittensor, D.P.; Walpole, M.; Hill, S.L.L.; Boyce, D.G.; Britten, G.L.; Burgess, N.D.; Butchart, S.H.M.; Leadley, P.W.; Regan, E.C.; Alkemade, R.; et al. A mid-term analysis of progress toward international biodiversity targets.Science2014,346, 241–244. [CrossRef] [PubMed]
56. Millennium Ecosystem Assessment.Ecosystems and Human Well-Being Synthesis; Island Press: Washington DC, USA, 2014.
57. UN Convention on Biological Diversity: Aichi Biodiversity Targets. Available online: https://www. cbd.int/sp/targets/ (accessed on 23 October 2015).
58. Marques, A.; Pereira, H.M.; Krug, C.; Leadley, P.W.; Visconti, P.; Januchowski-Hartley, S.R.; Krug, R.M.; Alkemade, R.; Bellard, C.; Cheung, W.W.L.;et al. A framework to identify enabling and urgent actions for the 2020 Aichi Targets.Basic Appl. Ecol.2014,15, 633–638. [CrossRef]
59. Fang, K.; Heijungs, R.; Duan, Z.; de Snoo, G. The Environmental Sustainability of Nations: Benchmarking the Carbon, Water and Land Footprints against Allocated Planetary Boundaries. Sustainability2015, 7, 11285–11305. [CrossRef]
60. Tukker, A.; Bulavskaya, T.; Giljum, S.; de Koning, A.; Lutter, S.; Simas, M.; Stadler, K.; Wood, R. Europe’s Environmental Footprints in a Global Context: A Structural Deficit in Resource Endowments. Better
Decis.-Mak. Sustain. Dev. Life Cycle Assess.2015, submitted.
61. DG JRC.ILCD Handbook: Analysis of Existing Environmental Impact Assessment Methodologies for Use in Life
Cycle Assessment. The International Reference Life Cycle Data System (ILCD); IES, DG Joint Research Centre,
European Commission: Brussels, Belgium, 2010.
62. German Federal Environment Agency (UBA). Ecologic Institute and Bosch & Partner Indicator-based
Environmental Reporting; German Federal Environment Agency (UBA): Dessau, Germany, 2011.
64. Mudgal, S.; Tan, A.; Lockwood, S.; Eisenmenger, N.; Fischer-Kowalski, M.; Giljum, S.; Bruckner, M.
Assessment of Resource Efficiency Indicators and Targets. Final Report Prepared for the European Commission,
DG Environment; Contract Number 07.0307/2010/580623/ETU/C1 implementing Framework Contract
number ENV.G.4/FRA/2008/0112; BIO Intelligence Service, Institute for Social Ecology, and Sustainable Europe Research Institute: Paris, France, 2012.
65. NEF.Happy Planet Index: 2012 Report. A Global Index of Sustainable Well-Being; New Economic Foundation:
London, UK, 2012; p. 25.
66. European Commission. COMMISSION STAFF WORKING DOCUMENT. Progress on “GDP and Beyond”
Actions. Volume 1 of 2; European Commission: Brussels, Belgium, 2013.
67. European Commission.GDP and Beyond. Measuring Progress in a Changing World; Communication from the Commission to the Council and the European Parliament; European Commission: Brussels, Belgium, 2009. 68. Leontief, W.Input-Output Economics; Oxford University Press: New York, NY, USA, 1986.
69. Erb, K.H. Human Appropriation of NPP (HANPP). An Accounting Framwork for ana3lysing lan3d us3e proc3esses in the Earth sys3tem 2011. Available online: https://www.google.com.hk/ url?sa=t&rct=j&q=&esrc=s&source=web&cd=1&ved=0ahUKEwik14GB54zLAhXJBiwKHWxFDOsQFggdM AA&url=https%3a%2f%2fwww.earthobservations.org%2fdocuments%2fmeetings%2f201102_ipcc_geoss%2f 28_IPCC_GEOSS_Erb.ppt&usg=AFQjCNGXjd0zxrczgrUKovm01m3QIzN9MQ&sig2=6IJvQo-pyAwdMYZr AGZy5A&cad=rjt (accessed on 22 February 2016).
70. Haberl, H.; Kastner, T.; Erb, K.H. HANPP and Embodied HANPP: A consistent accounting system to trace internal and trade-related pressures on ecosystems 2012. In Proceedings of the Institut de Ciència i Tecnologia Ambientals (ICTA), Catalonia, Spain, 31 October 2012.
71. Erb, K.H.; Krausmann, F.; Gaube, V.; Gingrich, S.; Bondeau, A.; Fischer-Kowalski, M.; Haberl, H. Analyzing the global human appropriation of net primary production-processes, trajectories, implications. An introduction.Ecol. Econ.2009,69, 250–259. [CrossRef]
72. Wiedmann, T.O.; Schandl, H.; Lenzen, M.; Moran, D.; Suh, S.; West, J.; Kanemoto, K. The material footprint of nations.Proc. Natl. Acad. Sci. USA2015,112, 6271–6276. [CrossRef] [PubMed]
73. Hertwich, E.G.; Peters, G.P. Carbon Footprint of Nations: A Global, Trade-Linked Analysis.Environ. Sci.
Technol.2009,43, 6414–6420. [CrossRef] [PubMed]
74. Hoekstra, A.Y.; Chapagain, A.K. Water footprints of nations: Water use by people as a function of their consumption pattern.Water Resour. Manag.2006,21, 35–48. [CrossRef]
75. EEA Eurostat: Environmental Data Centre on natural resources. Available online: http://www.eea. europa.eu/themes/waste/links/eurostat-environmental-data-centre-on (accessed on 23 October 2015). 76. EEA Indicators. Available online: http://www.eea.europa.eu/data-and-maps/indicators/#c5=&c0=
10&b_start=0 (accessed on 23 October 2015).
77. EIONET. Towards a Set of Indicators on Sustainable Consumption and Production (SCP) for EEA reporting. Available online: http://scp.eionet.europa.eu/publications/SCP_Indicator_frame (accessed on 23 October 2015).
78. Eurostat Sustainable Development Indicators. Available online: http://ec.europa.eu/eurostat/c/portal/ layout?p_l_id=6938029&p_v_l_s_g_id=0 (accessed on 23 October 2015).
79. European Commission. Europe 2020—Europe’s growth strategy. Available online: http://ec.europa.eu/ europe2020/index_en.htm (accessed on 23 October 2015).
80. UNEP. UNEP Year Book. Available online: http://www.unep.org/yearbook/ (accessed on 23 October 2015). 81. OECD. OECD Statistics-Environment. Available online: http://stats.oecd.org/Index.aspx?themetreeid=7
(accessed on 23 October 2015).
82. Eisenmenger, N.; Theurl, M.; Gierlinger, S.; Giljum, S.; Lutter, S.; Bruckner, M.; Deetman, S.; de Koning, A.; Kleijn, R.; Acosta-Fernández, J.;et al.DESIRE Development of a System of Indicators for a Resource Efficient Europe.
D4.2 Final Report on Indicator Framework; Institute of Social Ecology: Vienna, Austria; Vienna University of
Business and Economics: Vienna, Austria; CML Leiden University: Leiden, The Netherlands; Wuppertal Institute: Wuppertal, Germany, 2013.
84. Best, A.; Giljum, S.; Simmons, C.; Blobel, D.; Hammer, M.; Lewis, K.; Cavalieri, S.; Lutter, S.; Maguire, C.
Potential of the Ecological Footprint for Monitoring Environmental Impacts from Natural Resource Use: Analysis of the Potential of the Ecological Footprint and Related Assessment Tools for Use in the EU’s Thematic Strategy on the
Sustainable Use of Natural Resources; European Commission: Brussels, Belgium, 2008.
85. Wiedmann, T.; Wilting, H.; Lutter, S.; Palm, V.; Giljum, S.; Wadeskog, A.; Nijdam, D. Development of a methodology for the assessment of global environmental impacts of traded goods and services. Available online: www.eipot.eu (accessed on 23 October 2015).
![Figure 1 illustrates the hybrid structure of the socioeconomic and the natural system as two overlapping spheres rather than one being the subset of the other [5,6]](https://thumb-us.123doks.com/thumbv2/123dok_us/8314265.2202505/5.892.185.707.698.1068/figure-illustrates-hybrid-structure-socioeconomic-natural-overlapping-spheres.webp)