DEVELOPMENT AND APPLICATIONS OF A MICROCHIP CAPILLARY ELECTROPHORESIS-HIGH PRESSURE MASS SPECTROMETRY PLATFORM
William M. Gilliland, Jr.
A dissertation submitted to the faculty at the University of North Carolina at Chapel Hill in partial fulfillment of the requirements for the degree of Doctor of Philosophy in the Department
of Chemistry.
Chapel Hill 2017
ABSTRACT
William M. Gilliland, Jr.: Development and Applications of a Microchip Capillary Electrophoresis-High Pressure Mass Spectrometry Platform
(Under the direction of J. Michael Ramsey)
This work describes the pairing of electrospray ionization (ESI) with high pressure mass spectrometry (HPMS) with the goal of developing a miniature analytical platform as an
alternative to traditional liquid chromatography-MS (LC-MS) systems. LC-MS systems are the standard for many chemical analyses and are used for a wide range of applications, but their size and complexity limits them to centralized labs. Microchip capillary electrophoresis (CE) coupled with HPMS presents an opportunity to provide an inexpensive, simple, and targeted separations-MS system. The work here demonstrates the initial steps for coupling ESI and HPseparations-MS,
improvements for the analysis of small molecules, and strategies and applications for ESI-HPMS of intact proteins.
The first step for ESI-HPMS was designing an interface to conduct ions from
found to be more effective for small molecules than the “gate” lens. The RF drive frequency was increased to 30 MHz to improve resolution, and the trap size was decreased to critical
dimensions of about 100 µm to maintain mass range. A SLIT trap was used to increase ion storage capacity. With these improvements, the twenty common amino acids were infused and detected with a 28-fold improvement in S/N and a 2.6-fold improvement in peak width over the previous HPMS analysis. Microchip CE-HPMS was then used for two applications: the analysis of amino acids in cell growth medium and the detection of opiates in urine.
“Piglet noticed that even though he had a very small heart, it could hold a rather large amount of gratitude” – A.A. Milne
ACKNOWLEDGEMENTS
I would first like to thank Professor Mike Ramsey for his advisement and the opportunity to do research in his laboratory. There are many current and former members of the lab who I would to thank as well. Derek Wolfe, Kenion Blakeman, Kevin Schultze, Andrew Hampton, and Craig Cavanaugh were all helpful in training me when I first joined the lab. A special thank you to Craig for many early morning and weekend conversations about both science and life. Nick Batz, Erin Redman, and Scott Mellors were all gracious with their time when I was learning the ins and outs of microchip CE (especially in microchip fabrication). Thank you to Oscar McCrate for his help with bacterial cell culture and overall biological knowledge. I’d like to thank our collaborators at 908 Devices, specifically Glenn Harris and Mike Goodwin, who provided many phone conversations and several visits that helped me along the way. I’d like to thank J.P. Alarie and Tina Stacy both for their guidance and for revisions of many, many documents, including this dissertation. The last members of the lab I would like thank are Davey West, Kristina Herrera, and Esme Candish who were great friends and support throughout my time at UNC.
TABLE OF CONTENTS
LIST OF TABLES ... xii
LIST OF FIGURES ... xiii
LIST OF ABBREVIATIONS AND SYMBOLS ... xviii
Chapter 1: Introduction ... 1
1.1 Background and Motivation ... 1
1.2 High Pressure Mass Spectrometry ... 3
1.2.1 Miniature Mass Analyzers ... 3
1.2.2 Quadrupole Ion Traps (QITs) ... 4
1.2.3 Considerations for High Pressure Operation ... 6
1.2.4 Miniature Cylindrical Ion Traps (CITs) ... 7
1.2.5 Previous Work in High Pressure Mass Spectrometry ... 9
1.3 Microchip Capillary Electrophoresis and Electrospray Ionization ... 13
1.3.1 Capillary Electrophoresis ... 13
1.3.2 Microchip Capillary Electrophoresis ... 14
1.8 References ... 34
Chapter 2: Initial Development of Electrospray Ionization Coupled with High Pressure Mass Spectrometry ... 41
2.1 Introduction ... 41
2.2 Experimental ... 44
2.2.1 Materials and Reagents ... 44
2.2.2 Microchip Design and Operation ... 45
2.2.3 Microchip ESI-MS ... 46
2.3 Results and Discussion ... 47
2.3.1 Atmospheric Interface ... 47
2.3.2 CE-ESI-MS of Peptides ... 51
2.3.3 Tandem Mass Spectrometry ... 54
2.4 Conclusions ... 56
2.5 Figures and Tables ... 58
2.6 References ... 73
Chapter 3: Investigation of ESI-HPMS for Small Molecule Analysis ... 76
3.1 Introduction ... 76
3.2 Experimental ... 80
3.2.1 Materials and Reagents ... 80
3.2.2 Microchip Design and Operation ... 81
3.2.3 Microchip ESI-HPMS ... 82
3.3.4 Amino Acid Consumption and Cell Growth ... 90
3.3.5 CE-HPMS of Opiate Standards ... 92
3.3.6 CE-HPMS of Codeine in Urine Samples ... 93
3.4 Conclusion ... 95
3.5 Figures and Tables ... 96
3.6 References ... 113
Chapter 4: Investigation of ESI-HPMS for the Analysis of Proteins ... 115
4.1 Introduction ... 115
4.1.1 Background and Motivation ... 115
4.1.2 Mass Range Extension ... 116
4.1.3 Printed Circuit Board Ion Funnel ... 116
4.1.4 High m/z Applications of a CE-ESI-HPMS Platform ... 117
4.1.5 Summary ... 119
4.2 Experimental ... 119
4.2.1 Materials and Reagents ... 119
4.2.2 Microchip Design and Operation ... 120
4.2.3 Microchip ESI-HPMS ... 121
4.3 Results and Discussion ... 123
4.3.1 SIMION Simulations of PCB Ion Funnel ... 123
Chapter 5: Conclusions and Future Directions ... 154
5.1 Conclusions ... 154
5.2 Future Directions ... 157
5.3 References ... 160
Appendix I: ESI Device Fabrication and Coating ... 161
A1.1 Microfabrication Procedure ... 161
A1.2 Device Coating Procedure ... 162
A1.2.1 Chemical Vapor Deposition of APS Coating ... 162
A1.2.2 PEGylation of APS Coating ... 162
Appendix II: Microchip Device Operation ... 164
A2.1 Instrument Hardware ... 164
A2.2 CE-ESI Device Injection and Operation... 164
A2.2.1 Electrokinetic Injections ... 164
A2.2.2 Hydrodynamic Injections ... 165
A2.3 Infusion Device Operation ... 166
LIST OF TABLES
Table 2.1: Operational voltages for CE-ESI device at each reservoir during CE run and
injections. ... 72
Table 3.1: HPMS improvements in S/N and FWHM for the 20 common amino acids before and after system optimization. ...101
Table 4.1: Parameters Used for SIMION Simulations. ... 138
Table 4.2: Ion injection times used for different concentrations of myoglobin. ... 144
Table A2.1: Sample operational voltages for electrokinetic injections. ... 168
LIST OF FIGURES
Figure 1.1: A) Picture of quadrupolar ion trap electrodes and B) Cross-sectional schematic of quadrupolar ion trap. The trap consists of a ring electrode and two endcaps. The
dimensions of the trap are defined by the radial (r0) and axial (z0) dimensions shown in the
schematic. ... 25 Figure 1.2: Theoretical regions of radial (r) and axial (z) stability for a quadrupolar
ion trap, ploted in az, qz space. The areas labeled A and B correspond to important
overlapping regions of r and z stability, where ions are stably trapped (reprinted from
reference 120). ... 26 Figure 1.3: Zoom of region A from Figure 1.2, shown with iso-b lines, a parameter
corresponding to the motion of the ion in the trap. Ions are stably trapped in the region bounded by the solid black lines. Under normal ion trap operational conditions with no DC
voltage, ions lie along the qz axis. The voltage can be ramped and ions become unstable in
order of increasing m/z at the point where qz is 0.908, labeled in the figure (reprinted from
reference 120). ... 27 Figure 1.4: Equipotential lines for A) Quadrupole ion trp with hyperbolic electrodes where
r0 = 10 mm, z0 = 7.07 mm and B) Cylindrical ion trap with planar electrodes and
r0 = z0 = 5.0 mm. Near the center of the CIT, the field is largely quadrupolar (reprinted
from reference 19). ... 28 Figure 1.5: Effects of pressure on mass spectra of 2-chloroethyl ethyl sulfide (CEES) in
helium buffer gas with CIT r0 = 500 µm and RF at 6.73 MHz (reprinted from reference 46). . 29
Figure 1.6: Effects of buffer gas composition on mass spectra of p-xylene at 1 Torr with a
CIT of r0 = 500 µm and RF at 10.0 MHz (reprinted from reference 46). ... 30
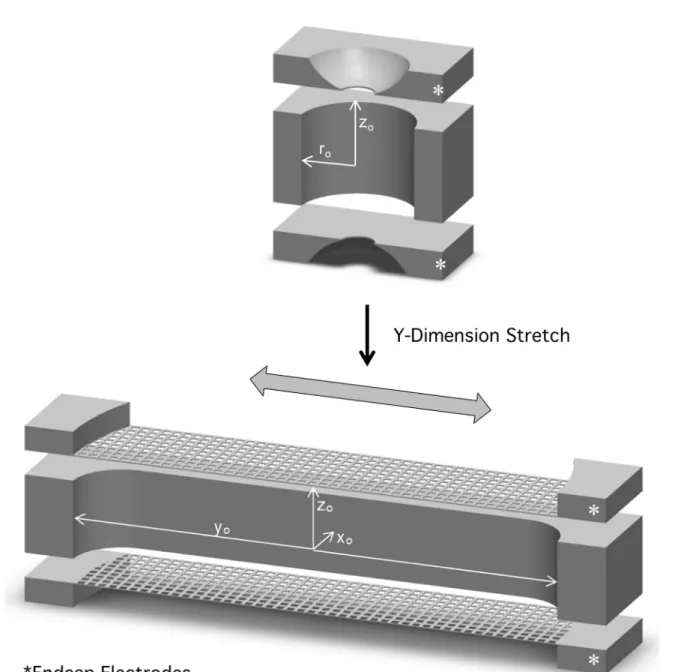
Figure 1.7: 3D cross-section of CIT (top) and SLIT (bottom). Both traps consist of a ring electrode and two endcap electrodes. The SLIT operates the same as the CIT but is stretched in the y-dimension labeled in the figure (reprinted from reference 52). ... 31 Figure 1.8: Traditional setup for capillary electrophoresis. Two buffer reservoirs are
connected by a capillary, and high voltage is applied between the inlet and the outlet. Species migrate and optical detection (green circle) is performed near the outlet of the
circles and indicate sample (S), background electrolyte (BG), sample waste (SW), and electroosmotic pump (EO). The microchip in A consists of an injection cross, a 46-cm serpentine separation channel, and an electroosmotic pumping channel. The infusion device (B) consists of a 5.5-cm channel and an electroosmotic pumping channel, and both
reservoirs are filled with the sample. ... 58 Figure 2.2: Experimental setup (not to scale) for ESI-HPMS with (1) Glass microchip with
electrospray, (2) stainless steel capillary and UltraTorr fitting, (3) accelerating electrode, (4) gate electrode, (5) trap electrodes; two endcaps (BeCu) and ring (Cu), (6) electron multiplier detector, and (7) vacuum pumps. ... 59 Figure 2.3: Timing diagram for HPMS experiments. The voltage applied to the gate electrode
(gate voltage) is high during the ion injection portion and low during the rest of the scan. After ion injection, the RF amplitude is constant while the trapped ions are given time to cool. The RF amplitude is then ramped to perform the mass analysis scan. The RF amplitude is then reduced to near-zero and any ions remaining after the ramp are cleared from the trap
before the next scan begins. ... 60 Figure 2.4: Ion gating with the gate electrode using background electrolyte as the sample. The
black trace shows ion signal, and the red trace shows the RF ramp (arbitrary units). The signal from 0 to 4 ms shows that ions can be efficiently gated with the electrode; the voltage on the gate electrode is high during this point and low during the rest of the scan. The spikes at the beginning of the pulse are a turn-on feature from the detector. ... 61 Figure 2.5: Infusion-ESI-HPMS spectra of the twenty common amino acids. Each amino acid
was infused separately at 100 µM in BGE. The drive RF was 10.2 MHz, and the buffer gas was ambient air at 1.2 Torr. *indicates (M+H)+ ... 62
Figure 2.6: Infusion-ESI-HPMS spectra of four amino acids (100 µM) shown in Figure 2.5. The drive RF was 10.2 MHz, and buffer gas was ambient air at 1.2 Torr. ... 63 Figure 2.7: Infusion-ESI-HPMS spectrum of 5 µM thymopentin in BGE. The drive RF was
7.1 MHz, and the buffer gas was ambient air at a pressure of 1.3 Torr. ... 64 Figure 2.8: BPI electropherograms of a peptide mixture with a 46-cm long separation channel
CE microchip with HPMS (black) and Synapt G2 (red) detection. Fluorescein (*),
red trace shows the HPMS scan result after isolation and excitation of the dimer with a
small axial potential (4.8 Vp-p). ... 68
Figure 2.12: Isolation and excitation of acetaminophen clusters at MS stages up to MS4. A) Initial MS scan without isolation or excitation. B) Isolation of Peak 1 and fragmentation. C) Isolation of Peak 2 and fragmentation. D) Isolation of Peak 3 and fragmentation to
Peak 4. ... 69 Figure 2.13: Stages of MS and scan functions for acetaminophen clusters/adducts up to MS4. The last ramp in each sequence is the mass analysis scan, and the previous ramps (partial
instability scans) are used to isolate the highest mass ion. ... 70 Figure 2.14: Infusion-ESI-HPMS and MS/MS of leucine enkephalin. Some of the fragment
features in the MS scan (black trace) are reproduced after the protonated molecule is isolated and fragmented. A shoulder on the protonated molecule also appears after
excitation. ... 71 Figure 3.1: Instrument diagram (CAD) in A) isometric and B) cross-section view. Similar to the previous instrument design, there are two vacuum chambers, one for mass analysis at
>1 Torr, and one for detection at <50 mTorr. The trap resides in the mass analysis chamber and acts as the conductance limit between the chambers. ... 96 Figure 3.2: Results of SIMION simulations. A) Potential energy surface with capillary and gate lens. B) Ion trajectories using voltages applied to the capillary and gate lens without gas flow. C) Ion trajectories with 300 m/s gas flow in the y-direction (toward the trap). D) Potential energy surface with capillary and tube lens. E) Ion trajectories using voltages
applied to the capillary and tube lens without gas flow. ... 97 Figure 3.3: Effects of tube lens ID on mass spectra with A) Sample mass spectra of histidine and B) S/N of histidine protonated molecule at various tube lens IDs. ... 98 Figure 3.4: Infusion-ESI-HPMS spectra of each of the twenty common amino acids at
50 µM. ... 99 Figure 3.5: Sample amino acid mass spectra taken with a tube lens (red, top) compared to a gate lens (spectra from Chapter 2; black, bottom) of A) proline and B) arginine. ... 100 Figure 3.6: CE-HPMS separation and detection of amino acid standards in A) a standard
Figure 3.9: Sample electropherogram time points over the course of cell growth. The migration times were adjusted to correspond with the 0 h time point for visualization. The
starred peaks represent components that were consumed of the course of this experiment. ... 105 Figure 3.10: Sample arginine mass spectra over the time points shown in Figure 3.9. ... 106 Figure 3.11: Relative peak areas of four amino acids referenced to the internal standard
shown with the cell growth as measured by OD600. ... 107
Figure 3.12: Electropherograms of opiate standards (5 µg/mL) detected on Synapt G2 (black, top) and HPMS (red, bottom). 1 – meperidine, 2 – hydrocodone, 3 – cis-tramadol* , 4 – hydromorphone, codeine, methadone*, 5 – oxycodone, 6 – morphine,
7 – oxymorphone, 8 – naloxone, fentanyl (0.5 µg/mL), 9 – naltrexone, 10 – buprenorphine. Starred components were not detected with HPMS. ... 108 Figure 3.13: 2D plot of CE-HPMS of opiate standards. Codeine, hydrocodone, and
hydromorphone are labeled to highlight the need for both CE separation and MS detection. . 109 Figure 3.14: Workflow for detection of codeine in urine. 1) 1 mL of urine is spiked with
codeine. 2) Spiked urine sample is loaded onto to Waters HLB SPE cartridge. 3) Sample is eluted from SPE cartridge in 100 µL of BGE. 4) Analysis by CE-HPMS. ... 110 Figure 3.15: Sample electropherograms of urine blank (black, bottom) and spiked with
100 ng/mL codeine (red, top). ... 111 Figure 3.16: 2D plots of CE-HPMS of codeine spiked urine at A) 100 ng/mL and
B) 10 ng/mL. ... 112 Figure 4.1: Instrument diagram (CAD) in A) isometric and B) cross-sectional view. The
instrument consists of two chambers. The first chamber is operated at high pressure (>1 Torr) and contains the PCB ion funnel and the ion trap, and the second chamber is
Figure 4.4: Ion % transmission as a function of m/z from SIMION simulations with ions of three different masses. ... 140 Figure 4.5: Pictures of PCB ion funnel A) mounted to bulkhead with trap and PCB
mounting plate and B) in axial view. The largest electrode is 6 mm in diameter, and the smallest is 2 mm in diameter. Surface mount resistors and capacitors are mounted to tabs on the PCBs. ... 141 Figure 4.6: ESI infusions of A) cytochrome c and B) myoglobin with HPMS and a
commercial mass spectrometer (Synapt G2). ... 142 Figure 4.7: Ion focusing optics comparison for an infusion of myoglobin using the PCB ion
funnel and DC optics (Tube Lens). ... 143 Figure 4.8: Adjusted S/N plotted for different concentrations of myoglobin. The inset shows the lowest seven concentrations with a linear fit to determine the limit of the detection. ... 145 Figure 4.9: ESI-HPMS infusion spectrum of bovine serum albumin (BSA). A deconvoluted
spectrum of BSA is shown in the inset. ... 146 Figure 4.10: ESI infusion spectra of an IgG2 with both HPMS and a commerical mass
spectrometer (LCT Premier). A deconvolution of the lowest charge states (highest m/z) is shown in the inset. ... 147 Figure 4.11: Electropherograms from CE-HPMS runs of whole blood lysate with normal
levels of HbA1c (bottom) and spiked with 10% HbA1c (top). ... 148 Figure 4.12: Sample HPMS spectra of the subunits of hemoglobin from a microchip CE
separation. ... 149 Figure 4.13: Sample CE-HPMS electropherograms of clinical blood samples with varying
concentrations of HbA1c. The peak corresponding to the glycated b subunit is shown with an arrow. ... 150 Figure 4.14: Correlation of glycated b subunit to unmodified b subunit from CE-HPMS with
clinically measured HbA1c. ... 151 Figure A2.1: Schematics for capillary electrophoresis (A) and infusion (B) glass
LIST OF ABBREVIATIONS AND SYMBOLS
2D Two dimensional
3D Three dimensional
h Viscosity
µapp Apparent electrophoretic mobility
µEO Electroosmotic mobility
µEP Electrophoretic mobility
µg Microgram
µm Micrometer
µM Micromolar
W Angular drive frequency
AC Alternating current
APDIPES (3-Aminopropyl)di-isopropylethoxysilane
APS Aminopropyl silane
au Mathieu stability parameter in u dimension
CID Collision induced dissociation CIT Cylindrical ion trap
cm Centimeter
CVD Chemical vapor deposition CZE Capillary zone electrophoresis
Da Dalton
DC Direct current
DRIE Deep reactive ion etching Dz Pseudopotential well depth
e Ion charge in Coulombs
EI Electron ionization
EO Electroosmotic
EOF Electroosmotic flow ESI Electrospray ionization FWHM Full width at half maximum
GC Gas chromatography
GDEI Glow discharge electron ionization
GND Ground
HbA1c Glycated hemoglobin
K Kelvin
kW Kiloohm
kDa Kilodalton
kV Kilovolt
LB Luria-Bertani
LC Liquid chromatography
LOD Limit of detection LOQ Limit of quantitation
m Ion mass
(M+H)+ Protonated molecule
mAb Monoclonal antibody
MALDI Matrix assisted laser desorption/ionization
MHz Megahertz
min Minute
mm Millimeter
MS Mass spectrometry
MS/MS Tandem mass spectrometry
OD Outer diameter
OD600 Optical density at 600 nm
P Pressure
PCB Printed circuit board
PE Potential energy
PEG Polyethylene glycol
PTFE Teflon
q Ion charge in solution
QA/QC Quality assurance/quality control QIT Quadrupolar ion trap
qu Mathieu stability parameter in u dimension
r0 Ion trap radius
rh Hydrodynamic radius
RIT Rectilinear ion trap
RF Radio frequency
s Second
SDS Statistical diffusion simulation SLIT Stretched length ion trap
S/N Signal-to-noise
UV Ultraviolet
V Volt
V0-p Zero-to-peak AC voltage
Vp-p Peak-to-peak AC voltage
Chapter 1: Introduction 1.1 Background and Motivation
Mass spectrometry (MS) is a powerful analytical technique due to its sensitivity,
versatility, and ability to provide chemical and structural information of molecules and has long been the ‘gold standard’ for many types of chemical analyses. However, most MS systems are limited to centralized or academic laboratories because of their complexity and their size, weight, and power (SWaP) requirements. Because of the ability of MS to rapidly and reliably detect and identify molecules, there are many applications that would benefit from having an MS on-site. To that end, many research groups have developed miniature mass spectrometers for
environmental monitoring,1–3 explosives4 and chemical warfare agent detection,5,6 forensics,7,8 and clinical analyses.9 The primary limitation to the miniaturization/portability of these systems is the strenuous vacuum requirements to operate the mass analyzer at pressures much below atmosphere (<1 mTorr).
all undesirable qualities for a miniature mass spectrometer. Thus, moving to higher operational pressures and using mechanical pumps facilitates miniaturization.
The centerpiece of HPMS is the miniature ion trap mass analyzer. The use of miniature ion traps maintains practical voltage and power requirements for the high radio frequency (RF) drive signal required for HPMS. The development of mini-CITs and HPMS has led to a
commercially available hand-held mass spectrometer from 908 Devices, Inc., primarily developed for threat detection of various gaseous and volatile analytes.
separation and detection of biomolecules, including surface chemistries for the microfluidic devices. Microfluidic CE-MS has been demonstrated for many biological and biochemical applications from the analysis of small molecules to intact antibodies. While the usefulness of microfluidic CE-ESI devices coupled with commercial mass spectrometers is proven, the small footprint, simplicity, and wide range of applications for these devices also make them excellent candidates for pairing with a miniature mass spectrometer.
The marriage of microfluidic CE and HPMS presents an opportunity for a fully miniature analysis platform for biomolecule analysis, which could provide a simple and inexpensive alternative to conventional LC-MS systems. The following sections detail the principles and strategies underlying HPMS and microfluidic CE, as well as considerations for an ESI interface to HPMS and its combination with microfluidic CE into a single analytical platform.
1.2 High Pressure Mass Spectrometry
1.2.1 Miniature Mass Analyzers
The miniaturization of the mass analyzer is central to the reduction in the overall size of the mass spectrometer. Nearly all types of common mass analyzers have been reduced in size to varying extents, including time-of-flight (TOF),11,12 sector-type analyzers,13,14 linear
but still produce useful MS data.24,25 Third, ion traps have the ability to perform tandem mass spectrometry (MS/MS) with a single analyzer, which reduces the overall footprint of the instrument, reduces chemical noise, and increases the selectivity of the instrument. Finally, ion traps have significantly higher operating pressures than other mass analyzers (~1 mTorr compared to 10-4 Torr or lower). Operation at higher pressures is important for reducing the vacuum requirements in a miniature instrument. Because of their favorable scaling, simple geometry, and ability to perform MS/MS, ion traps were chosen as the mass analyzer for our miniaturization efforts.
1.2.2 Quadrupole Ion Traps (QITs)
The quadrupole ion trap was first introduced by Paul and Steinwedel in the 1950s26 and became commercially available as a mass analyzer and detector for gas chromatography in 1983 from Finnigan, Corp.27 A picture and a schematic of a QIT are shown in Figure 1.1 with the trap’s size defined by the r0 and z0 dimensions labeled in Figure 1.1b. The r0 parameter is the
radius of the ring electrode, and z0 is half the distance of the space between endcaps. The field in
the trap is produced by voltages applied to the three electrodes, a ring and two endcaps. Ions enter and exit the trap via holes in each of the endcap electrodes. The hyperbolic shape of the electrodes produces a field that is largely quadrupolar.
az= - 16eU m(r02+ 2z
0
2)W2 1.1
qz= 8eV m(r02+ 2z 0
2)W2 1.2
𝑎#=
8eU m(r02+ 2z 0
2)W2 1.3
𝑞#= - 4eV m(r02+ 2z
0
2)W2 1.4
where U is a DC potential applied to the ring electrode, e is the elementary charge of the ion, m is the mass of the ion, r0 is the radius of the ring electrode, 2z0 is the endcap spacing, V is the
drive RF voltage (0-p) amplitude applied to the ring electrode, and W is the angular RF frequency applied to the ring (2pf). Because the trapping parameters in each dimension are related to each other by a factor of two and opposite in sign, regions of radial (upward pointing) and axial stability (downward pointing) can be plotted in qz and az space (Figure 1.2). Areas
amplitude of the RF voltage, scanning the ions along the qz axis until they reach the boundary of
the stability region at qz = 0.908 (shown in Figure 1.3). At qz > 0.908, ions no longer have a
stable trajectory in the axial dimension and are ejected through holes in the endcap electrodes. This type of scan is known as a mass-selective instability scan. The time and voltage at the point of ejection can be used to determine an ion’s m/z.
1.2.3 Considerations for High Pressure Operation
As the pressure of the mass analyzer is increased to facilitate miniaturization, it is important to take into account the effects of pressure on MS performance. Two important measures for a mass spectrometer’s analytical performance are its resolving power and its mass range. Resolving power for QIT, assuming slow scan conditions, can be expressed as:29
m
∆m∝
Ωτ
4 3 1.5
where m is the ion mass, Dm is the width of the mass spectral peak, W is the applied angular RF frequency, and t is the collisional relaxation time, which is inversely proportional to the pressure (P) of the buffer gas. As a result, the resolving power can be expressed proportionally:
be considered using the maximum mass that can be ejected from a trap (rearranged from Equation 1.2):
(m z )max=
8Vmax qmaxW2(r02+2z
0
2) 1.7
where z is the charge, m is the ion mass, Vmax is the maximum amplitude of the RF voltage, qmax
is the trapping parameter and constant (usually 0.908), and r0 and z0 are the dimensional
parameters of the trap. To make up for the loss of mass range at increased frequencies, the drive RF voltage can be increased or the dimensions of the trap can be decreased. There are, however, practical limits to increasing the voltage, both due to the overall power constraints of a miniature mass spectrometer and the possibility of electrical breakdown (arcing). Thus, decreasing the trap size is necessary in order to increase the frequency and maintain practical voltages. For
comparison, typical QITs have r0 of 1 cm and operate with a frequency around 1 MHz.
Therefore, an increase in frequency to 10 MHz would require a decrease in the size of the trap to an r0 of about 1 mm to maintain similar operating voltage.
1.2.4 Miniature Cylindrical Ion Traps (CITs)
often an intentional axial stretch to a non-ideal geometry. The trapping field in CITs is largely similar to QITs but has more significant components of higher than quadrupolar order (due to geometry simplifications), especially near the edges of the trap. To illustrate this point, simulated equipotential lines for a QIT and CIT are shown in Figure 1.4.30 Near the center of the trap, the field in a CIT closely resembles that of a QIT, where higher order fields are weakest, and where ions are typically found when trapped. At the edges of the CIT, deviation from quadrupolar character are expected and higher order fields are strongest. These higher order fields can contribute to a reduction in stability at higher qz values.
Although they result in instability at higher qz, higher order multipole fields can be used for
what is known as double resonance ejection.31 A small axial RF voltage (with frequency w) may be applied to one or both endcaps to take advantage of these multipole fields. When the secular frequency (or a harmonic) of the ions is doubly resonant with the frequency of the axial RF signal and the frequency of nonlinear resonances in the trap, ions can be ejected from the trap. The resonances occur at specific fractions of the drive RF frequency, most notably at w = W/3 and 2W/3 (hexapolar), and W/4 (octopolar). The application of an axial RF voltage for resonant ejection expands the mass range by reducing the ejection qz and voltage necessary for ejection
traps in the early 2000s.19,35 At Oak Ridge, miniature ion traps were developed with sub-mm dimensions,18,34,36 with ion traps as small as r
0 = 20 µm fabricated and operated.37
1.2.5 Previous Work in High Pressure Mass Spectrometry
Operation of an ion trap mass spectrometer at higher than traditional pressures
(>1 mTorr) would facilitate miniaturization by reducing the pumping requirements to reach the desired pressure. Cooks and Ouyang demonstrated that a rectilinear ion trap could be operated at pressures up to 50 mTorr with helium as the buffer gas38 and theoretically characterized mass spectral performance at pressures up to 250 mTorr.39 Other work from Cooks and Ouyang has shown that ions can be trapped at high pressure (~1 Torr), but mass analysis was still performed at low pressures (<10 mTorr) using a discontinuous atmospheric pressure interface (DAPI).40
The work described here aims to operate CITs at pressures near 1 Torr, where turbomolecular pumps are no longer needed. As discussed in Section 1.2.3 and described theoretically,41 the frequency applied to the ion trap must be increased at higher pressures in order to maintain reasonable mass resolution, with a corresponding decrease in trap size to maintain practical voltages. Before operation at high pressure, the first steps in high frequency operation of miniature ion traps were initially demonstrated at traditional buffer gas pressures (~1 mTorr), to ensure that CITs could function as mass analyzers with higher frequencies. Miniature cylindrical ion traps with radii between 0.5 and 2.5 mm were tested at low pressures (~1 mTorr) by several research groups at frequencies from 1.6 to about 8 MHz.17,31,34,36,42,43
as the buffer gas, and the CIT had r0 of 500 µm and was operated at up to 9.5 MHz. A filament
or yttria coated disc was used as an electron ionization (EI) source. Spectra of 2-chloroethyl ethyl sulfide, a common chemical warfare agent simulant for mustard gas, at three pressures are shown in Figure 1.5. As the helium buffer gas pressure was increased from 0.062 to 1.21 Torr, the peaks broaden slightly, but the primary peaks in the spectrum remain visible at m/z 124 (molecular ion), 89 (loss of chlorine), and 75 (loss of methyl chloride).
While the demonstration of HPMS in helium is a good step toward miniaturization, operation of HPMS with ambient air as the buffer gas would eliminate the need for an external gas source and further reduce the final size of the instrument. HPMS was demonstrated with another r0= 500 µm CIT with a glow discharge ionization source in nitrogen and air buffer
gases.45 Figure 1.6 shows mass spectra of p-xylene in helium, nitrogen and air buffer gases. The peaks in nitrogen and air were significantly broader than those in helium. Isotopic features were not visible in nitrogen and air, but three major features of p-xylene were observable around m/z 106, 91, and 77, demonstrating that useful molecular information could still be obtained using HPMS with air as a buffer gas.
A major concern with the miniaturization of CITs is the loss of ion trapping capacity incurred at smaller dimensions, which in turn decreases the dynamic range of the mass analyzer. Dehmelt introduced an approximation for ion storage in a QIT:49
Nmax= 2.8 x 10⁷ D
zz0 1.8
where Nmax is the maximum number of ions that can be stored in the trap, z0 is the axial
dimension of the trap, and Dz is the pseudopotential well depth in the z direction, at low values of
qz given by:
Dz= qzV
8 1.9
where qz is the Mathieu parameter introduced in Equation 1.2 and V is the 0-to-peak trapping
voltage applied to the ring electrode. From Equation 1.8, the capacity of the trap decreases linearly with trap size. One way to make up for lost ion trapping capacity and increase dynamic range of miniature CITs is to operate an array of CITs in parallel.37,50,51 While arrays of CITs can
increase the sensitivity, the primary drawback is the possibility of heterogeneity between each of the individual trapping elements, which could result in significant loss of mass resolution.
volume. SLITs have been successfully operated as mass analyzers, and, at low pressure, SLITs have been demonstrated to have an order of magnitude better sensitivity than CITs without loss of resolution. In the same work, SLITs were shown to operate at 1 Torr with nitrogen as the buffer gas. To further improve the sensitivity of the mass analyzer, arrays of SLITs or a serpentine geometry could be implemented.
In addition to improving the sensitivity of miniature ion traps, improving the selectivity, or the ability to distinguish similar chemical components, is also of interest, especially at high buffer gas pressures, where mass resolution degrades. Ion traps have the ability to perform tandem mass spectrometry, and it has recently been demonstrated that MS/MS can be performed with both microscale CITs and SLITs at pressures up to 1 Torr with air as the buffer gas.54 Hampton’s work focused primarily on small organic analytes such as bromobenzene, trichlorbenzene, and N,N-dimethylaniline.
1.3 Microchip Capillary Electrophoresis and Electrospray Ionization
The primary goal of this work is to optimize HPMS operation with ESI as the ion source, specifically microchip ESI devices. Because many of the applications for ESI-HPMS involve coupling HPMS with microchip capillary electrophoresis, a brief introduction to CE, microchip CE-ESI devices, and previous applications of microchip CE-ESI-MS is presented here.
1.3.1 Capillary Electrophoresis
Electrophoresis can be defined as the movement of electrically charged species in a conductive liquid medium under the influence of an electric field.55 Initial developments using electrophoresis as the separation mechanism needed a solid support such as paper or gels to prevent convectional distortion of analyte bands.56 While gel electrophoresis has been an extremely valuable asset to biological and biochemical research, its primary disadvantage is the speed of the separation, which is limited by Joule heating. In the early 1980s, Jorgenson and Lukacs showed that electrophoresis could be performed in free solution using narrow-bore, open tubular capillaries, termed capillary zone electrophoresis (CZE).57–59 The high surface area-to-volume ratio gave these capillaries the ability to efficiently dissipate heat, and CZE separations could be performed with up to 30 kV applied at ambient temperature.
µapp= µEP+ µEO 1.10
The electrophoretic mobility of an analyte ion is dependent on the charge of the ion (q), the viscosity of the solution (h), and the hydrodynamic radius of the ion (rh):
µEP= q
6πη𝑟& 1.11
Thus, CZE separates analytes based on their charge to size ratio and conformation in solution. A smaller, more highly charged particle will migrate faster than a larger, less charged particle.
The electroosmotic mobility of an analyte depends on the electroosmotic flow (EOF) produced in the capillary. EOF arises from the formation of an electrical double layer at the wall of the capillary. Briefly, the double layer consists of an immobile layer of counter ions of
semiconductor industry.61–67 Performing CE in planar microchannels (10-100 µm) with high aspect ratios (width to height) provided the same Joule heat dissipation advantages of small-bore capillaries.68,69 One of the primary advantages of microchip CE over traditional CZE is the ability to incorporate many steps of analysis on a single device, and for this reason, initial devices were termed µ-total analysis systems.69,70
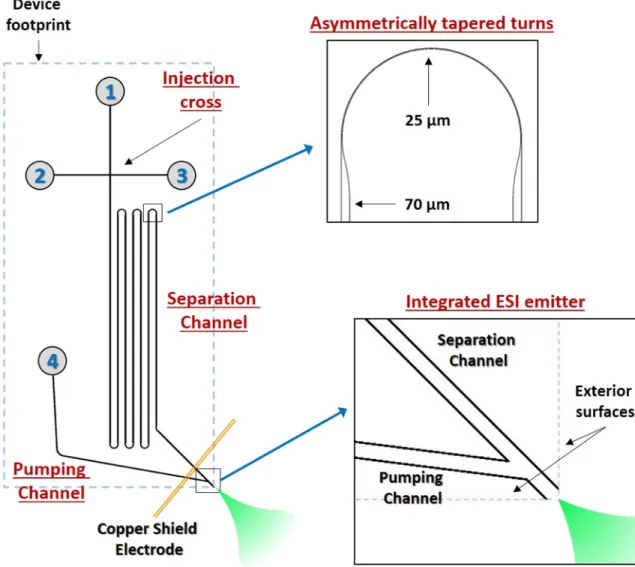
The devices used for this work are adapted from this initial work on microchips, with the primary difference being the monolithic integration of an ESI emitter onto the device. A typical device is shown in Figure 1.9.60 The channels are created in glass using photolithography and wet etching, and the fabrication process is described in detail in Appendix I. The device incorporates four important elements onto a single platform: an injection cross, the separation channel, the pumping channel, and the integrated ESI emitter.
The injection cross provides a simple method for sample handling and injection prior to CE separation. This strategy has been used previously and is common for microfluidic
perform the separation. Electrokinetic injections are simple and very fast but can result in sample injection bias if analytes have significantly different electrophoretic mobilities. In contrast, hydrodynamic injections are slower but do not produce any sample introduction bias. For hydrodynamic injections, all voltages are turned off and pressure is applied to reservoirs 2 (sample) and 1 (buffer) resulting in sample being directed into the separation channel. After a short time, pressure is only applied to reservoir 1 to load the sample band completely into the separation channel. Voltages are then applied to reservoirs 1 and 4 and pressure removed from reservoir 2 and normal zone electrophoresis occurs.
The separation channel pictured in Figure 1.9 is typically 23 cm in length with six turns to minimize the footprint of the device. The turns are asymmetrically tapered (see inset) in order to minimize geometric dispersion known as the “racetrack effect.”71–73 The racetrack effect refers to turns with uniform channel dimensions where analytes on the inside of the turn migrate
significantly faster than analytes on the outside of the turn, resulting in a wider overall band. The effect can be reduced by increasing the turn radius or as done here reducing the width of the channel. The separation channel and pumping channel join just before terminating at the corner of the device, which acts as the integrated ESI emitter.
Many research groups have worked to interface microchip platforms with ESI. Strategies for developing this interface include spraying from the flat surface of a microchip,74,75 inserting
the glass substrate.81 The sensitivity and stability of the ESI source using this strategy was found to be comparable to typical pulled capillary emitters with no detectable band broadening. Thus, the portion of the device involving the ESI emitter has remained relatively unchanged since its introduction in 2008.
The final element of the microfluidic ESI device is the pumping channel, labeled in Figure 1.9. To perform ESI, bulk fluid flow and an emitter with an applied voltage are necessary. For these microchips, the pumping channel intersects the separation channel near the
electrospray emitter and serves both of these purposes. The voltage applied at reservoir 4 completes the circuit for performing CE and simultaneously provides the voltage necessary for ESI to occur. The pumping channel also provides the bulk fluid flow necessary for ESI, either via an applied head pressure or using an electroosmotic pumping strategy involving different surface coatings in the separation and pumping channels.74,81
The architecture shown in Figure 1.9 has remained relatively unchanged since its initial development and has been used for many applications, providing high efficiency separations with the added benefit of MS detection. Efficient surface coatings82 have enabled the use of these microfluidic devices for many biological applications including 2D separations (LC-CE) of peptides and proteins,83 characterization of monoclonal antibodies and antibody drug conjugates,84,85 study of hemoglobin glycation for diabetes diagnostics,86 and hydrogen-deuterium exchange to study protein structure.87 Because of their small platform, simple
1.4 Design Considerations for CE-ESI-HPMS
Because all previous HPMS analysis has involved an EI or GDEI ion/ionization source, there are additional design considerations for ESI-HPMS analysis. First, ions must be efficiently transported from atmospheric pressure into the vacuum chamber containing the mass analyzer. Previously, ions were generated in the same chamber as the mass analyzer or already in the trapping volume. After transport into the chamber containing the mass analyzer, externally generated ions must be trapped, so the reduced pseudopotential well depth of miniature ion traps may be of concern. Finally, parameters for operation of the mass analyzer must be adjusted to accommodate significantly higher mass and higher m/z ions. Thus far, mass analysis has focused on small organic ions of less than about 150 m/z, and those ions are usually singly charged, meaning the masses are also usually less than 150 Da. One of the advantages of ESI is the ability to volatilize and ionize large species that are often multiply charged, so HPMS conditions will have to be optimized to accommodate analysis of these species.
1.4.1 Ion Source and Ion Transport to the Mass Analyzer
Despite improvements in the ion source and ionization efficiency, the primary limitation of the sensitivity of ESI-MS systems is in the transport of ions to the mass analyzer. A significant portion of analyte ions are lost due to limited flow or collisions with surfaces at the inlet or other conductance limits in the instrument.93–95 Ion transmission efficiencies from ESI source to detector are reported in the 0.01 – 0.1% range.96–100 Strategies to improve sensitivity include using larger bore capillaries or apertures,101 multiple inlet capillaries and/or nESI sources,102,103 different capillary or aperture geometries,104,105 performing nESI in the first vacuum stage of the mass spectrometer (sub-ambient ESI),95,106–108 and improved ion optics in each vacuum region of the mass spectrometer. Large ID capillaries and multiple ESI emitters improve sensitivity but significantly increase the pumping requirements of the mass spectrometer. Special capillary geometries can be difficult to fabricate, and performing ESI below atmospheric pressure becomes complex with a microchip as the ionization source. For these reasons, ESI-HPMS development has focused on the ion optics that transport ions throughout the mass spectrometer.
are ideal candidates to use with ESI-HPMS. It is important to note that ion funnels, while extremely efficient for many large species, suffer from poor ion transmission of low m/z (<200) species. For small molecule applications of HPMS, other ion transport strategies, such as DC-only optics, will be investigated.
1.4.2 External Ion Trapping
All HPMS work to date has used an EI or GDEI source, targeting gaseous and volatile analytes. Analytes are introduced into the mass spectrometer and ionized after entering the vacuum chamber. Because the analytes are already in the vacuum chamber (and often already in the trapping volume) when ionized, they have only a small amount of kinetic energy and can be easily trapped by the oscillating field of the CIT. For ESI, ions are generated at atmospheric pressure and must be transported into the vacuum chamber and the mass analyzer. Because the ions must be transported to the mass analyzer, they will likely have significantly more kinetic energy than ions generated inside the vacuum chamber. Recalling Equation 1.9, the
pseudopotential well depth is a function of the dimension of the trap (via qz), and miniature CITs
efficiently trap ions.110–113 Other methods to increase the number of trapped ions include simply increasing the flux of ions entering the trap with better optics (ion transfer efficiency, as in Section 1.4.1) and increasing the mass or pressure of the buffer gas to reduce the kinetic energy of the ions.112,114 The strategy of increasing the pressure of the buffer gas is of particular interest for HPMS. In this case, if ions can be efficiently transported to the mass analyzer, the increased pressure of HPMS may aid in the trapping of externally generated ions by reducing their kinetic energy.
Externally generated ions have been trapped and analyzed under HPMS conditions both with glow discharge and EI. Cavanaugh demonstrated that ions could be produced and trapped with a filament 90 degrees off-axis from the axial dimension of the trap. Cavanaugh and Blakeman have both shown that the polarity of the glow discharge source can be reversed from EI operation to produce and accelerate ions toward the trap for mass analysis.46,115 While
trapping externally generated ions in these cases shows promise, ions were still always produced in the same chamber as the mass analyzer. In contrast, ions produced by ESI outside of the vacuum chamber must undergo an additional transport step.
1.4.3 Trapping and Analyzing Ions of High Mass and m/z
The frequency can be decreased but must be sufficiently high (enough RF cycles per collision) to trap ions at HPMS pressures. Finally, the size of the trap can be decreased further. Blakeman used traps as small as r0 = 100 µm but increased the frequency to have roughly the same mass
range and improve resolution.46 Traps of that size could be used for ESI-HPMS of larger
molecules if the frequency were decreased, with the likely tradeoff of decreased mass resolution. For example, an order of magnitude decrease in frequency (i.e. 60 to 6 MHz) would result in a 100-fold increase in the largest mass possible to be ejected, all else being equal. Thus, ESI-HPMS analysis will consist of appropriately scaling the size of the trap, frequency, and voltage depending on the mass and m/z of the analyte.
for direct infusion of analytes, without a separation step beforehand. Many of the miniature systems use ambient ionization techniques such as desorption electrospray ionization (DESI) or paper spray ionization, which can provide useful information but would be difficult to use for complex mixtures.9,117 In addition, these systems still operate the mass analyzer at <10 mTorr pressures so the strenuous pumping requirements for an atmospheric inlet necessitates the use of a turbo pump for all of these platforms. One proposed solution to breaking the pumping barrier is to introduce ions discontinuously with a technique called discontinuous atmospheric pressure ionization, or DAPI.9,118 DAPI instruments use a pinch valve in the center of a capillary so that ions are collected and trapped in a linear ion trap at high pressure when the valve is opened. The valve is then closed, the mass analysis chamber is pumped down to a low pressure (<10 mTorr), then mass analysis is performed. Instruments developed using DAPI show promise, but they suffer from poor sampling rates (~1 Hz) and a power-hungry turbo pump is still required for mass analysis.
A miniature CE separation has been coupled to a miniature mass spectrometer using a DAPI inlet, using a short capillary and nESI source.119 This system uses conventional silica capillaries for CE, and migration times were slow, so the low sampling rate of the DAPI configuration was adequate for their analysis. In addition, the system suffers from the
conventional complexities of CE-ESI including injection and a sheath-flow interface. Finally, the system still requires a turbo pump and low pressures for mass analysis.
sampling, increasing the duty cycle of the instrument. The microchip CE platform is simple to operate, has a small footprint, and produces high efficiency and rapid separations.
1.6 Objectives
1.7 Figures
Figure 1.2: Theoretical regions of radial (r) and axial (z) stability for a quadrupolar ion trap, ploted in az, qz space. The areas labeled A and B correspond to important overlapping regions of
Figure 1.3: Zoom of region A from Figure 1.2, shown with iso-b lines, a parameter
corresponding to the motion of the ion in the trap. Ions are stably trapped in the region bounded by the solid black lines. Under normal ion trap operational conditions with no DC voltage, ions lie along the qz axis. The voltage can be ramped and ions become unstable in order of increasing
Figure 1.4: Equipotential lines for A) Quadrupole ion trp with hyperbolic electrodes where r0 = 10 mm, z0 = 7.07 mm and B) Cylindrical ion trap with planar electrodes and
r0 = z0 = 5.0 mm. Near the center of the CIT, the field is largely quadrupolar (reprinted from
1.8 REFERENCES
(1) Pulliam, C. J.; Bain, R. M.; Wiley, J. S.; Ouyang, Z.; Cooks, R. G. J. Am. Soc. Mass Spectrom. 2015, 26 (2), 224–230.
(2) Bell, R. J.; Davey, N. G.; Martinsen, M.; Collin-Hansen, C.; Krogh, E. T.; Gill, C. G. J. Am. Soc. Mass Spectrom. 2015, 26 (2), 212–223.
(3) Mach, P. M.; Wright, K. C.; Verbeck, G. F. J. Am. Soc. Mass Spectrom. 2015, 26 (2), 281–285.
(4) Dalgleish, J. K.; Hou, K.; Ouyang, Z.; Cooks, R. G. Anal. Lett. 2012, 45 (11), 1440–1446. (5) Nagashima, H.; Kondo, T.; Nagoya, T.; Ikeda, T.; Kurimata, N.; Unoke, S.; Seto, Y. J.
Chromatogr. A 2015, 1406, 279–290.
(6) Smith, J. N.; Noll, R. J.; Cooks, R. G. Rapid Commun. Mass Spectrom. 2011, 25 (10), 1437–1444.
(7) Ifa, D. R.; Jackson, A. U.; Paglia, G.; Cooks, R. G. Anal. Bioanal. Chem. 2009, 394 (8), 1995–2008.
(8) Sanders, N. L.; Kothari, S.; Huang, G.; Salazar, G.; Cooks, R. G. Anal. Chem. 2010, 82 (12), 5313–5316.
(9) Li, L.; Chen, T.-C.; Ren, Y.; Hendricks, P. I.; Cooks, R. G.; Ouyang, Z. Anal. Chem. 2014, 86 (6), 2909–2916.
(10) Whitehouse, C. M.; Dreyer, R. N.; Yamashita, M.; Fenn, J. B. Anal. Chem. 1985, 57 (3), 675–679.
(11) Bryden, W. A.; Benson, R. C.; Ecelberger, S. A.; Phillips, T. E.; Cotter, R. J.; Fenselau, C. Johns Hopkins Apl Tech. Dig. 1995, 16 (3), 296–310.
(12) Cornish, T. J.; Bryden, W. A. Johns Hopkins APL Tech. Dig. Appl. Phys. Lab. 1999, 20 (3), 335–341.
4896–4901.
(18) Kornienko, O.; Reilly, P. T. A.; Whitten, W. B.; Ramsey, J. M. Rapid Commun. Mass Spectrom. 1999, 13 (1), 50–53.
(19) Ouyang, Z.; Wu, G.; Song, Y.; Li, H.; Plass, W. R.; Cooks, R. G. Anal. Chem. 2004, 76 (16), 4595–4605.
(20) Ouyang, Z.; Noll, R. J.; Cooks, R. G. Anal. Chem. 2009, 81 (7), 2421–2425.
(21) J. Mitchell Wells; Ethan R. Badman, A.; Cooks, R. G.; Wells, J. M.; Badman, E. R.; Cooks, R. G. Anal. Chem. 1998, 70 (3), 438–444.
(22) Bonner, R. F.; Fulford, J. E.; March, R. E.; Hamilton, G. F. Int. J. Mass Spectrom. Ion Phys. 1977, 24 (3), 255–269.
(23) Chaudhary, A.; van Amerom, F. H. W.; Short, R. T. Int. J. Mass Spectrom. 2014, 371, 17– 27.
(24) Kaiser, R. E.; Graham Cooks, R.; Stafford, G. C.; Syka, J. E. P.; Hemberger, P. H. Int. J. Mass Spectrom. Ion Process. 1991, 106, 79–115.
(25) Kaiser, R. E.; Cooks, R. G.; Moss, J.; Hemberger, P. H. Rapid Commun. Mass Spectrom. 1989, 3 (2), 50–53.
(26) Paul, W.; Steinwedel, H. Zeitschrift für Naturforsch. A 1953, 8 (7), 448–450. (27) March, R. E. Mass Spectrom. Rev. 2009, 28 (6), 961–989.
(28) March, R. E. J. Mass Spectrom. 1997, 32 (4), 351–369.
(29) Goeringer, D. E.; Whitten, W. B.; Ramsey, J. M.; McLuckey, S. A.; Glish, G. L. Anal. Chem. 1992, 64 (13), 1434–1439.
(30) Ouyang, Z.; Wu, G.; Song, Y.; Li, H.; Plass, W. R.; Cooks, R. G.; Zheng Ouyang; Wu, G.; Song, Y.; Li, H.; Wolfgang R. Plass, A.; Cooks, R. G. Anal. Chem. 2004, 76 (16), 4595– 4605.
(35) Gao, L.; Song, Q.; Patterson, G. E.; Cooks, R. G.; Ouyang, Z. Anal. Chem. 2006, 78 (17), 5994–6002.
(36) Moxom, J.; Reilly, P. T. A.; Whitten, W. B.; Ramsey, J. M. Anal. Chem. 2003, 75 (15), 3739–3743.
(37) Pau, S.; Pai, C. S.; Low, Y. L.; Moxom, J.; Reilly, P. T. A.; Whitten, W. B.; Ramsey, J. M. Phys. Rev. Lett. 2006, 96 (12), 120801.
(38) Song, Q.; Xu, W.; Smith, S. A.; Gao, L.; Chappell, W. J.; Cooks, R. G.; Ouyang, Z. J. Mass Spectrom. 2010, 45 (1), 26–34.
(39) Xu, W.; Song, Q.; Smith, S. A.; Chappell, W. J.; Ouyang, Z. J. Am. Soc. Mass Spectrom. 2009, 20 (11), 2144–2153.
(40) Gao, L.; Cooks, R. G.; Ouyang, Z. Anal. Chem. 2008, 80 (11), 4026–4032.
(41) Whitten, W. B.; Reilly, P. T. A.; Ramsey, J. M. Rapid Commun. Mass Spectrom. 2004, 18 (15), 1749–1752.
(42) Moxom, J.; Reilly, P. T. A.; Whitten, W. B.; Ramsey, J. M. Rapid Commun. Mass Spectrom. 2004, 18 (6), 721–723.
(43) Pau, S.; Whitten, W. B.; Ramsey, J. M. Anal. Chem. 2007, 79 (17), 6857–6861.
(44) Blakeman, K. H.; Wolfe, D. W.; Cavanaugh, C. A.; Ramsey, J. M. Anal. Chem. 2016, 88 (10), 5378–5384.
(45) Blakeman, K. H.; Cavanaugh, C. A.; Gilliland, W. M.; Ramsey, J. M. Rapid Commun. Mass Spectrom. 2016, 31 (1), 27–32.
(46) Blakeman, K. Development of High Pressure Mass Spectrometry for Handheld Instruments, University of North Carolina at Chapel Hill, 2015.
(47) Blain, M. G.; Riter, L. S.; Cruz, D.; Austin, D. E.; Wu, G.; Plass, W. R.; Cooks, R. G. Int. J. Mass Spectrom. 2004, 236 (1–3), 91–104.
Trap Mass Spectrometer, University of North Carolina at Chapel Hill, 2014.
(53) Ramsey, J. M.; Schultze, K. P. Miniature charged particle trap with elongated trapping region for mass spectrometry. US8878127B2, 2014.
(54) Hampton, A. Improving the Selectivity of High Pressure Mass Spectrometry, University of North Carolina at Chapel Hill, 2016.
(55) Baker, D. R. Capillary electrophoresis; Wiley, 1995.
(56) Landers, J. P. Handbook of capillary electrophoresis; CRC Press, 1997. (57) Jorgenson, J.; Lukacs, K. Science (80-. ). 1983, 222 (4621), 266–272. (58) Jorgenson, J. W.; Lukacs, K. D. J. Chromatogr. A 1981, 218, 209–216. (59) Jorgenson, J. W.; Lukacs, K. D. Anal. Chem. 1981, 53 (8), 1298–1302.
(60) Redman, E. A. Development of a Microfluidic Capillary Electrophoresis-Mass
Spectrometry Platform for the Characterization of Biotherapeutic Proteins, University of North Carolina at Chapel Hill, 2016.
(61) Manz, A.; Harrison, D. J.; Verpoorte, E. M. J.; Fettinger, J. C.; Paulus, A.; Lüdi, H.; Widmer, H. M. J. Chromatogr. A 1992, 593 (1), 253–258.
(62) Seiler, K.; Harrison, D. J.; Manz, A. Anal. Chem. 1993, 65 (10), 1481–1488.
(63) Harrison, D. J.; Manz, A.; Fan, Z.; Luedi, H.; Widmer, H. M. Anal. Chem. 1992, 64 (17), 1926–1932.
(64) Jacobson, S. C.; Koutny, L. B.; Hergenroeder, R.; Moore, A. W.; Ramsey, J. M. Anal. Chem. 1994, 66 (20), 3472–3476.
(65) Jacobson, S. C.; Hergenroder, R.; Koutny, L. B.; Warmack, R. J.; Ramsey, J. M. Anal. Chem. 1994, 66 (7), 1107–1113.
(66) Jacobson, S. C.; Hergenroeder, R.; Koutny, L. B.; Ramsey, J. M. Anal. Chem. 1994, 66 (14), 2369–2373.
(71) Culbertson, C. T.; Jacobson, S. C.; Ramsey, J. M. Anal. Chem. 1998, 70 (18), 3781–3789. (72) Griffiths, S. K.; Nilson, R. H. Anal. Chem. 2001, 73 (2), 272–278.
(73) Molho, J. I.; Herr, A. E.; Mosier, B. P.; Santiago, J. G.; Kenny, T. W.; Brennen, R. A.; Gordon, G. B.; Mohammadi, B. Anal. Chem. 2001, 73 (6), 1350–1360.
(74) Ramsey, R. S.; Ramsey, J. M. Anal. Chem. 1997, 69 (6), 1174–1178.
(75) Xue, Q.; Foret, F.; Dunayevskiy, Y. M.; Zavracky, P. M.; McGruer, N. E.; Karger, B. L. Anal. Chem. 1997, 69 (3), 426–430.
(76) Li, J.; Kelly, J. F.; Chernushevich, I.; Harrison, D. J.; Thibault, P. Anal. Chem. 2000, 72 (3), 599–609.
(77) Lazar, I. M.; Ramsey, R. S.; Sundberg, S.; Ramsey, J. M. Anal. Chem. 1999, 71 (17), 3627–3631.
(78) Svedberg, M.; Pettersson, A.; Nilsson, S.; Bergquist, J.; Nyholm, L.; Nikolajeff, F.; Markides, K. Anal. Chem. 2003, 75 (15), 3934–3940.
(79) Licklider, L.; Wang, X.-Q.; Desai, A.; Tai, Y.-C.; Lee, T. D. Anal. Chem. 2000, 72 (2), 367–375.
(80) Kameoka, J.; Orth, R.; Ilic, B.; Czaplewski, D.; Wachs, T.; Craighead, H. G. Anal. Chem. 2002, 74 (22), 5897–5901.
(81) Mellors, J. S.; Gorbounov, V.; Ramsey, R. S.; Ramsey, J. M. Anal. Chem. 2008, 80 (18), 6881–6887.
(82) Batz, N. G.; Mellors, J. S.; Alarie, J. P.; Ramsey, J. M. Anal. Chem. 2014, 86 (7), 3493– 3500.
(83) Mellors, J. S.; Black, W. A.; Chambers, A. G.; Starkey, J. A.; Lacher, N. A.; Ramsey, J. M. Anal. Chem. 2013, 85 (8), 4100–4106.
(89) El-Faramawy, A.; Siu, K. W. M.; Thomson, B. A. J. Am. Soc. Mass Spectrom. 2005, 16 (10), 1702–1707.
(90) Schmidt, A.; Karas, M.; Dülcks, T. J. Am. Soc. Mass Spectrom. 2003, 14 (5), 492–500. (91) Smith, R. D.; Shen, Y.; Tang, K. Acc. Chem. Res. 2004, 37 (4), 269–278.
(92) Ibrahim, Y.; Tang, K.; Tolmachev, A. V.; Shvartsburg, A. A.; Smith, R. D. J. Am. Soc. Mass Spectrom. 2006, 17 (9), 1299–1305.
(93) Lin, B.; Sunner, J. J. Am. Soc. Mass Spectrom. 1994, 5 (10), 873–885.
(94) Page, J. S.; Kelly, R. T.; Tang, K.; Smith, R. D. J. Am. Soc. Mass Spectrom. 2007, 18 (9), 1582–1590.
(95) Cox, J. T.; Marginean, I.; Smith, R. D.; Tang, K. J. Am. Soc. Mass Spectrom. 2015, 26 (1), 55–62.
(96) Kebarle, P.; Tang, L. Anal. Chem. 1993, 65 (22), 972A–986A.
(97) Zook, D. R.; Bruins, A. P. Int. J. Mass Spectrom. Ion Process. 1997, 162 (1), 129–147. (98) Zhou, L.; Yue, B.; Dearden, D. V.; Lee, E. D.; Rockwood, A. L.; Lee, M. L. Anal. Chem.
2003, 75 (21), 5978–5983.
(99) Page, J. S.; Tang, K.; Smith, R. D. Int. J. Mass Spectrom. 2007, 265 (2), 244–250. (100) Yu, Q.; Diao, Z.; Ni, K.; Qian, X.; Tang, F.; Wang, X. Rapid Commun. Mass Spectrom.
2015, 29 (11), 1055–1061.
(101) Schneider, B. B.; Javaheri, H.; Covey, T. R. Rapid Commun. Mass Spectrom. 2006, 20 (10), 1538–1544.
(102) Kelly, R. T.; Page, J. S.; Marginean, I.; Tang, K.; Smith, R. D. Current 2008, 80 (14), 5660–5665.
(103) Jiang, L.; Moini, M. Anal. Chem. 2000, 72 (1), 20–24.
(108) Marginean, I.; Page, J. S.; Tolmachev, A. V.; Tang, K.; Smith, R. D. Anal. Chem. 2010, 82 (22), 9344–9349.
(109) Schaffer, S. A.; Tang, K.; Anderson, G. A.; Prior, D. C.; Udseth, H. R.; Smith, R. D. Rapid Commun. Mass Spectrom. 1997, 11 (16), 1813–1817.
(110) Doroshenko, V. M.; Cotter, R. J. Rapid Commun. Mass Spectrom. 1993, 7 (9), 822–827. (111) Chambers, D. M.; Goeringer, E.; Mcluckey, S. A.; Glisht, G. L. Anal. Chem. 1993, 65
(15), 14–20.
(112) McLuckey, S. A.; Van Berkel, G. J.; Goeringer, D. E.; Glish, G. L. Anal. Chem. 1994, 66 (13), 689A–696A.
(113) Qin, J.; Chait, B. T. Anal. Chem. 1996, 68 (13), 2102–2107.
(114) Louris, J. N.; Amy, J. W.; Ridley, T. Y.; Cooks, R. G. Int. J. Mass Spectrom. Ion Process. 1989, 88 (2), 97–111.
(115) Cavanaugh, C. A. The Microionizer - A Solid State Ion Source for High Pressure Mass Spectrometry, University of North Carolina at Chapel Hill, 2016.
(116) Snyder, D. T.; Pulliam, C. J.; Ouyang, Z.; Cooks, R. G. Anal. Chem. 2016, 88 (1), 2–29. (117) Adam Keil; Nari Talaty; Christian Janfelt; Robert J. Noll; Liang Gao; Zheng Ouyang,
and; Cooks*, R. G.; Keil, A.; Talaty, N.; Janfelt, C.; Noll, R. J.; Gao, L.; Ouyang, Z.; Cooks, R. G. Anal. Chem. 2007, 79 (20), 7734–7739.
(118) Gao, L.; Sugiarto, A.; Harper, J. D.; Cooks, R. G.; Ouyang, Z. Anal. Chem. 2008, 80 (19), 7198–7205.
(119) He, M.; Xue, Z.; Zhang, Y.; Huang, Z.; Fang, X.; Qu, F.; Ouyang, Z.; Xu, W. Anal. Chem. 2015, 87 (4), 2236–2241.
Chapter 2: Initial Development of Electrospray Ionization Coupled with High Pressure Mass Spectrometry
2.1 Introduction
Since its initial development, electrospray ionization (ESI) has significantly expanded the range of mass spectrometric analysis from gas phase and volatile molecules to include
biomolecules and other liquid-borne analytes.1,2 ESI provides a facile method for coupling liquid phase separations, such as liquid chromatography (LC) or capillary electrophoresis (CE) with mass spectrometry (MS) detection.3,4 As a result, LC-MS has become a widely used analytical tool in fields such as proteomics,5 environmental monitoring,6,7 drug discovery and
development,8 and clinical diagnostics.9,10 Despite their usefulness, conventional LC-MS systems
are usually confined to dedicated laboratories because they are large, expensive, complex, and require significant amounts of power. The development of a smaller, less expensive, and simpler liquid phase separation/MS analytical platform could be applied to many of the same fields as traditional LC-MS systems, with the added potential for on-site analysis. The miniaturization of LC systems is limited by the need for a rugged system of pumps, valves, and tubing, while mass spectrometers are limited by low pressure operation, which requires bulky, fragile, and expensive turbomolecular pumps. Many recent efforts have been made towards the miniaturization of both
With the goal of a fully miniature separation-MS analysis system, this chapter describes the first steps in coupling microfabricated ESI devices with high pressure mass spectrometry (HPMS).
Microfluidic-based ESI devices have small sample volumes, short analysis times, flow rates easily coupled to MS, and a small form factor that fits within the goal of a miniature analytical platform.14 Previous work from the Ramsey lab produced glass microchips with high performance, monolithically integrated ESI emitters that are also simple to fabricate. These devices were used to perform CE separations for many biomolecule analyses, with the separation channel terminating at the corner of the device that acts as an ESI emitter, resulting in a
microchip-MS interface with no detectable band broadening.15–17 These microchips can be controlled with only DC voltage, have a small footprint (~2.5 x 6 cm), and give high efficiency separations, making them excellent candidates for a miniature CE-MS system.
Recently, high pressure mass spectrometry has been demonstrated as a viable method for the miniaturization of mass spectrometry.18,19 The strategy for HPMS utilizes miniature
where Vmax is the maximum RF drive voltage, qmax = 0.908 is a trapping parameter and constant,
WRF is the drive frequency (2pf), r0 is the radius of the trap, and z0 is the axial dimension of the
trap. If practical voltages are maintained (<1000 V0-p), the drive frequency and the size of the
trap can be adjusted to tune the mass range of the instrument.21 This has been previously investigated where traps with r0 of 500 µm and frequencies between 6 and 10 MHz were used
resulting in a mass range of about 70 to 140 m/z.18,19 With the goal of improving mass resolution, smaller traps (r0 < 500 µm) have been used, but the frequency was increased simultaneously so
the mass range was roughly maintained.22 For many common analyses by ESI, the mass range may need to extend up to as much as 2000 m/z. The frequency of the trap may need to be adjusted, the trap size reduced, or both to generate the desired mass range.
one or more regions of differential pressure.
In this chapter, the initial developments in coupling microchip ESI sources with high pressure mass spectrometry via an atmospheric inlet and direct current (DC) optics are explored. Initial work here focuses on small biomolecules including amino acids and peptides. These are of interest as one application of a CE-HPMS system could be monitoring of amino acids for process control of bioreactors used to produce biopharmaceuticals. Monitoring amino acid concentration can be used to optimize growth conditions and monitor cellular activity in a cell culture or bioreactor.25 Analysis of peptides is of importance for QA/QC of biopharmaceuticals,
identification and characterization of proteins, or to gain greater insight into cellular functions.26 Parameters for miniature CIT operation are adjusted and optimized to create the desired mass range for the analysis of amino acids and peptides. CE-ESI-HPMS analysis is performed on peptide molecules and compared with CE-ESI-MS with a commercial mass spectrometer (Synapt G2). In addition, multiple stages of tandem mass spectrometry (MS/MS) up to MS4 are investigated as a tool for increasing the selectivity of an ion trap mass spectrometer operated under HPMS conditions.
2.2 Experimental
were obtained from American Peptide Company (Sunnyvale, CA). Leucine enkephalin and acetaminophen used for MS/MS experiments were obtained from Sigma (St. Louis, MO). The background electrolyte (BGE) for all experiments was 50% acetonitrile, 49.9% water, and 0.1% formic acid (v/v/v, pH = 3.1).
2.2.2 Microchip Design and Operation
Two microchip devices were used for this work: an infusion-ESI device and a CE-ESI device with a 46-cm serpentine separation channel, schematics of which are shown in Figure 2.1. Fabrication of these devices is described in detail in Appendix I. Channels for both devices were isotropically wet-etched to 10 µm deep and 70 µm wide. Devices were coated according to the coating procedures outlined in Appendix I. Briefly, devices were coated with APDIPES via chemical vapor deposition (CVD) using a LabKote CVD system (Yield Engineering Systems, Livermore, CA). The pumping (EO) channels for both devices were then functionalized with a 20 kDa polyethylene glycol (PEG) reagent (NanoCS, Boston, MA). The PEG reagent terminates with an N-hydroxysuccinimide ester that reacts with the primary amine of the APDIPES surface, forming a covalent bond between the PEG chain and the surface coating.
2.2.3 Microchip ESI-MS
Electrospray ionization-high pressure mass spectrometry (ESI-HPMS) experiments were performed with a custom atmospheric interface and differentially pumped vacuum system. A schematic of a typical experimental setup is shown in Figure 2.2.
The microchip-ESI device (CE or infusion) was mounted on an adjustable x-y-z stage and positioned approximately 5-10 mm from the HPMS inlet capillary (items 1 and 2 in Figure 2.2). A single-sided copper clad circuit board (M.G. Chemicals, Burlington, Ontario, Canada) was used to shield the ESI orifice on the chip from the voltages applied to the reservoirs (not shown). The corner of the microfluidic device extended about 5 mm through a slit in the board. The copper board was held at +1 kV for CE experiments and GND for infusion experiments.