DISSOLVED INORGANIC NITROGEN RECYCLING IN FLORIDA BAY
Caleb Daniel King
A thesis submitted to the faculty at the University of North Carolina at Chapel Hill in partial fulfillment of the requirements for the degree of Master of Science in the Department of Marine
Sciences in the College of Arts and Sciences.
Chapel Hill 2015
Approved by:
Christopher S. Martens Marc J. Alperin
ABSTRACT
Caleb King: Dissolved Inorganic Nitrogen Recycling in Florida Bay (Under the guidance of Christopher S. Martens)
Florida Bay, a shallow, subtropical estuary bounded by the Everglades and Florida Keys, is a semi-enclosed ecosystem that has been heavily altered by changes in water management, surrounding land use, and industrialization. In particular, alterations to its nitrogen cycle from numerous environmental and anthropogenic stressors have resulted in water quality degradation and subsequent reoccurring cyanobacteria blooms responsible for mass die-offs of seagrasses and sponges. This research sought to quantify the microbial processes controlling water-column dissolved inorganic nitrogen transformations in Florida Bay and constrain previously unknown components of its nitrogen budget. To accomplish the research’s goals, in situ 15N isotope tracer techniques were used to measure potential rates of ammonium assimilation and ammonia + nitrite oxidation (nitrification) in the water column at three sites representative of nearshore environments and restricted circulation basins. In September of 2013, a coincidental
Synecochoccus picocyanobacterium bloom provided a unique opportunity to explore the detrimental impacts of such phenomena on surface-water DIN transformations.
competition with ammonium-assimilating communities. This effect was amplified under dense cyanobacteria bloom conditions where ammonia oxidation rates approached our detection limits. However, rates were elevated in the excurrent plumes of six marine sponges that expelled
copious amounts of ammonium, confirming the existence of ephemeral hotspots of nitrification in oligotrophic environments. Nitrite conversion to nitrate (NO!! oxidation) unexpectedly
proceeded seven times faster than its prior step (NH!!oxidation) in every non-bloom
For Kenneth Godwin Sr.
ACKNOWLEDGEMENTS
The research presented in this thesis is a collaborative product that would not have been possible without my two main advisors, Dr. Christopher Martens and Dr. Brian Popp. While I was an undergraduate at the University of Hawai‘i at Mānoa, Brian noticed my interests in stable isotope biogeochemistry and directed me to the research he and Chris were actively conducting in the Florida Keys. My interest in stable isotopes was only further enriched while a graduate student at UNC by attending the University of Utah’s “IsoCamp” summer course and by working alongside members of the Popp Lab. Both Chris and Brian’s dedication to my education and research will remain invaluable.
I would also like to thank my committee members, Dr. Marc Alperin and Dr. Carol Arnosti, for their unique and significant contributions to the interpretation of my collected data. A special thank you to Marc for his time in reviewing the models used in this research and for generously allowing me to give lectures to his undergraduate classes as preparation for my future career in academia. A special thank you to Howard Mendlovitz and Dr. Daniel Hoer for their expertise/creativity in the laboratory, planning in the field, and guidance in preparing this thesis. All of the data collected would not have been possible without the dedicated efforts of the following students and postdocs: Dr. Meredith Kintzing, Tara Williams, Emily Davidson, Tim Wahl, Hansen French, Elijah Lackey, Jake Tommerdahl, and Tanya Witlen. I would like to express my gratitude to Natalie Wallsgrove and Cassie Lyons at the Popp Laboratory for their time and efforts in providing the training and technical support of the mass spectrometry
collaborators at the Florida Fish and Wildlife Conservation Commission Southeast Regional Lab and our major funding organization, the National Science Foundation.
In conclusion, thank you to my friends and cohort at UNC Chapel Hill and IMS for your endless encouragement and continued perseverance. The future of oceanography looks
promising because of your efforts. I would like to especially thank my parents, Dr. Kathleen Piker-King and Fred King, my siblings and their spouses, and my second family (the Godwins) for your interest in my research, emotional support, and inspiration throughout my graduate school studies. Finally, thank you to my wife, Anastasia Godwin King, and four furry companions for listening (or not listening) and providing unconditional love throughout my educational journey.
TABLE OF CONTENTS
LIST OF TABLES ... ix
LIST OF FIGURES ... x
LIST OF ABBREVIATIONS AND VARIABLES ... xi
Introduction ... 1
Methods ... 4
Study Sites ... 4
Seawater Sample Collections ... 6
15N In Situ Incubations ... 6
Dissolved Nutrient Analyses ... 10
Elemental and Stable Isotope Analyses ... 11
Rate Calculations ... 12
Results ... 16
Nutrient Characteristics ... 16
Assimilation and Nitrification Variability ... 18
Nitrification within Sponge Excurrents ... 21
Impacts of a Phytoplankton Bloom ... 23
Discussion ... 25
Florida Bay’s Pelagic DIN Cycle ... 25
Sponge Excurrents as Potential Nitrification “Hotspots” ... 28
LIST OF TABLES
Table 1 – Mean concentrations of DIN species determined before, during, and after a
Synecochoccus bloom in Mystery Basin ... 17 Table 2 – Rates of ammonia oxidation within and surrounding the excurrent plumes of five
LIST OF FIGURES
Figure 1 – General map of Florida Bay and the three study sites in this research ... 3 Figure 2 – GIS map of Florida Bay and its categorized benthic coverage. Adapted from Prager
and Halley, 1997 ... 5 Figure 3 – Detailed GIS map of Mystery Basin and its categorized benthic coverage in
addition to identification of specific sampling sites ... 5 Figure 4 – Identification of sponge species from which the excurrent water was collected for
ammonia oxidation rate measurements ... 7 Figure 5 – Summarized change in ammonium and nitrate concentrations from various sites
inside and outside Mystery Basin before, during, and after a Synechococcus bloom ... 18 Figure 6 – Comparison of mean ammonium assimilation rates for three major study sites
examined ... 19 Figure 7 – Comparisons of average ammonia oxidation and nitrite oxidation rates conducted
before, during, and after a Synecochoccus bloom in Mystery Basin ... 24 Figure 8 – Relationship between the rates of ammonia and nitrite oxidation that were run in
parallel incubations ... 27 Figure 9 – Linear relationships of ammonia and nitrite oxidation rates compared to ambient
associated concentrations of nitrite ... 30 Figure 10 – Linear relationships of ammonia and nitrite oxidation rates compared to ambient
LIST OF ABBREVIATIONS AND VARIABLES
Variable Definition Unit
𝑈! Potential NH!! photosynthetic uptake rate nmol N L-1 d-1 𝑈! Potential NH!! bacterial uptake rate nmol N L-1 d-1
𝑈! Apparent NH!! uptake rate nmol N L-1 d-1
R Potential NH!! regeneration rate nmol N L-1 d-1
𝑂𝑥! Ammonia oxidation rate nmol N L-1 d-1
𝑂𝑥! Nitrite oxidation rate nmol N L-1 d-1
𝐼𝑠(!)
𝐼𝑝(!)
15N atom % of NH
!! at incubation start
15N atom % of ambient PON
% %
𝐼𝑝(!) 15N atom % of incubation end PON %
𝑁(!) 15N atom % of ambient NOx %
𝑁(!) 15N atom % of incubation end NOx %
𝑁(!") 15N atom % of incubation end NO!! % 𝐼𝑒(!) 15N atom % of NO
!
! at incubation start %
𝐼𝑠 Mean 15N atom % of NH!! during incubation %
15n Natural level of 15N atom % 0.3663%
[𝑁𝐻!!]A Ambient NH!! concentration nmol L-1
[𝑁𝐻!!]T Concentration of 15NH!! tracer nmol L-1
[𝑁𝐻!!]
F Incubation end NH!! concentration nmol L-1
[PON]A Ambient particulate organic nitrogen concentration nmol L-1
[NOx]A Ambient [NO!!] + [NO!!] concentration nmol L-1
[𝑁𝑂!!]
A Ambient [NO!!] concentration nmol L-1
T Total incubation time h
a NH!! regeneration to uptake ratio, R / 𝑈
b Apparent NH!!consumption _
x True to apparent uptake ratio, 𝑈!/ 𝑈! _
HMA High Microbial Abundance _
LMA Low Microbial Abundance _
DIN Dissolved Inorganic Nitrogen _
TN Total Nitrogen _
Dissolved Inorganic Nitrogen Recycling in Florida Bay Introduction
Florida Bay is a subtropical estuary that is compartmentalized into shallow (~2m) basins that impede water exchange via surrounding carbonate mudbanks. Median water turnover times in select basins range between 6 and 63 days (Cosby et al., 2005), potentially allowing for quantitative assessment of the pelagic cycling rates of nitrogen by heterotrophic,
chemoautotrophic, and photoautotrophic communities. This study, conducted in conjunction with related research on the role of sponges in N cycling, sought to quantify the rates of microbial-mediated ammonium transformations that occur within the oligotrophic water column of Florida Bay in order to understand their role in the budget for dissolved inorganic nitrogen (DIN) and their overall influence on the spatial heterogeneities of ammonium (NH!!), nitrite (NO
! !), and nitrate (NO!!) concentrations. A special emphasis was given to measuring both steps of nitrification, ammonia oxidation (NH3 →NO!!) and nitrite oxidation (NO
!
! →NO ! !), to investigate a previously unknown component of Florida Bay’s nitrogen budget.
directly exposed to the Gulf of Mexico, is characterized as nitrogen limited (Boyer et al., 1999), while the eastern bay is phosphorus limited (Boyer et al., 1999; Burd and Jackson, 2002;
Fourqurean et al., 1993). Variations from these conditions can occur during the rainy season as inorganic and organic-bound nitrogen is added in the northeastern and central bay from Florida Everglades and Florida Keys runoff (Boyer et al., 1999; Sutula et al., 2003). However, the addition of new nitrogen to Florida Bay from runoff pales in comparison to the total annual DIN (6,200 MT y-1) that may be introduced via groundwater intrusions and atmospheric deposition (Hunt and Nuttle, 2007). Long-term monitoring (SERC-FIU WQMN Program) and single time point studies have revealed spatial and temporal trends in the chemical speciation of DIN in Florida Bay. Broadly, the northeastern and portions of the central bay are characterized as high NOx (NO!! + NO
!
!) environments where concentrations reach their maxima from November-March and minima in the wetter summer and early fall months (Boyer et al., 1999; Burd and Jackson, 2002). In contrast, ammonium concentrations are greatest in the central and western portions of the bay where NH!! to NO
!
ecosystems and other coastal environments (Diaz and Ward, 1997; Jiménez and Ribes, 2007; Southwell et al., 2008). Sponges, present at high biomass in Florida Bay (Peterson, 2006), have recently been suggested to dominate all other inputs of recycled N to the bay with a DIN flux greater than 215 mmol N m-2 y-1 (Hoer, 2015). This flux likely represents an underestimate because of the large unquantified biomass of the species Chondrilla nucula associated with seagrasses (Martens et al., unpublished data). The release of DIN from High Microbial Sponges (HMA’s) is generally as NOx (Hoer, 2015; Southwell et al., 2008) and as NH!! from Low Microbial Abundance sponges
(LMA's; Hentschel et al., 2006). Therefore, sponge-generated N is partially responsible for the spatial variability of DIN speciation that occurs in Florida Bay, particularly under relatively stable, evaporative conditions (Hoer, 2015).
High rates of DIN transformation should result
from high fluxes of NH!! from LMA sponges as well as other sources including pelagic and
benthic ammonification as previously observed in the backwaters of the subtropical Kochi Estuary in India (Miranda et al., 2008). While phytoplankton preference is for reduced nitrogen (NH4) compared to oxidized forms (NOx), the dominance of large diatoms (Lavrentyev et al., 1998) and previous evidence for significant pelagic nitrate uptake in Florida Bay (Heil et al.,
0 5 10 Mi
Figure 1-Map of the three Florida Bay locations (black diamonds) where in situ rates were measured in this study.
2007) suggests that NOx derived from water column nitrification and HMA sponges may be of importance for primary productivity in the central and western portions of the bay. However, reoccurring picocyanobacterial (Synechococcus) blooms in Florida Bay disrupt the normal rates of pelagic and benthic DIN supply and demand, thus significantly altering surface water
concentrations (Glibert et al., 2009; Hoer, 2015; Phlips et al., 1999). Prolonged blooms, such as those that occurred from 2005-2008 and 1991-1992, can result in extensive mortality of sponges, seagrasses, and macroalgae that are collectively important for the recycling of DIN (Butler et al., 1995; Glibert et al., 2009). Therefore, this thesis sought to evaluate the potential impacts of cyanobacterial blooms on microbial DIN transformations, determine the fate of ammonium exported from sponges, and define the relationship between water-column nitrogen
transformations and local water column concentrations in Florida Bay. Methods
The assessment of water-column DIN transformations in Florida Bay presented here is based on a series of field campaigns to conduct in situ experiments and collect discrete water samples for an array of nutrient analyses. Post-field measurements of dissolved inorganic and organic carbon and nitrogen concentrations were conducted at the University of North Carolina at Chapel Hill, while particulate and dissolved carbon and nitrogen stable isotopic compositions were analyzed under the guidance of Dr. Brian Popp at the University of Hawai‘i – Mānoa’s Biogeochemical Stable Isotope Facility.
Study Sites
0 4 8 mi
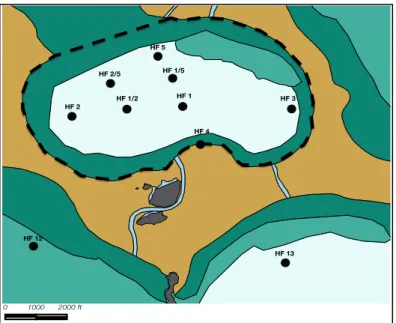
Figure 3 - Adapted map of Mystery Basin bottom types (see Figure 1 legend) with an outline of the basin (dashed line) and all experimental sites (black circles) labeled. Map scale is 1:13,000.
Figure 2 - Adapted map of Florida Bay benthic coverage from site surveys, boat
At Mystery Basin (MB), nine sub-localities (Figures 2 & 3) were chosen and categorized by the following major bottom-types: sea grass-dominated, sponge-dominated, and sandy hard bottom.
Seawater Sample Collections
Ambient seawater samples from each location were collected prior to in situ incubations for measurements of ammonium (NH!!), nitrite (NO
!
!), nitrate (NO !
!), non-purgeable dissolved
organic carbon (NPDOC), δ18O of NOx, and δ15NOx. Ambient collections were made at the identical depths from which incubations were conducted using SCUBA and triplicate acid-washed 60-mL syringes. Each syringe was fitted with an acid-acid-washed stopcock, 0.25mm polypropylene 2-piece cassette lined with a Teflon® O-ring, and a narrow length of silicon tubing. Syringes and precombusted 0.25mm GF/F (Whatman) filters were rinsed with 60-180mL of seawater from the same depth/location prior to sample collection. Both filters and water samples were stored on ice until returning to the lab where aliquots from each syringe were used as follows: 15mL immediately analyzed for ammonium, 20mL refrigerated (4°C) after the addition of 100 µL of 50% H3PO4 for NPDOC, and the rest frozen (-60°C) in scintillation vials for quantification of NOx or HDPE bottles for nitrogen and oxygen stable isotope analyses. Ambient collections from sponge excurrents (Figure 4) were taken slowly (~ 2 mL s-1) in order to obtain only water from the excurrent plume. Fluorescein dye was used to confirm that a sponge was pumping after excurrent samples were collected.
15N In Situ Incubations
A B C
D E
Figure 4 – Photographs of sponge species from which the excurrent water was collected for ammonia oxidation rate measurements. Genus and species were identified visually from taxonomic databases and previous publication descriptions
morning hours, with the exception of one nighttime incubation at the Florida Fish and Wildlife Conservation Commission locality (FWC). Each incubation bottle was enriched with enough 99 atom % 15NH!! (Cambridge Isotope Laboratories, Inc.) to increase overall ammonium
concentrations by ~10%. Consequently, initial isotope enrichments ranged between 3 and 30 atom % 15N (at %) as calculated from a mass balance equation that assumed ambient 15NH!!
activity was 0.3663 at %. Incubation bottles were returned to their collection depth and secured to the lines of anchored buoys for 4 hours. Incubations were concluded by immediately storing bottles in the dark and on ice until returning to the laboratory where samples were syringe filtered through precombusted 0.25mm GF/F filters and divided for nutrient analyses. Filters with particulate matter were frozen (-60°C) in scintillation vials and the volume of filtrate recorded.
Bacterial Ammonium Assimilation – In order to distinguish between autotrophic and heterotrophic ammonium assimilation a size-fractionation method was employed. In previous work, the central and southern portions of Florida Bay have been characterized by photosynthetic biomass consisting of micro and nanodiatom communities greater than 2µm in diameter
(Lavrentyev et al., 1998). Therefore, seawater was initially filtered through a 0.7µm GF/F filter to remove the majority of autotrophs and the filtrate retained in a new acid-washed
polycarbonate bottle. Due to the potential presence of some picocyanabacterial communities, such as Synecochoccus, we chose to conduct these incubations in the absence of light (dark bottles) to reduce any potential phytoplankton NH!! assimilation. Similar to the photoautotrophic
incubations, seawater was collected 50cm from the bottom and enriched with enough 99 atom % 15NH
!! to increase overall ammonium concentrations by ~10%. Initial isotope enrichments did
and allowed to incubate for 4 hours before termination and subsequent filtration on
precombusted 0.3µm glass fiber filters. Filters with particulate matter were frozen (-60°C) in scintillation vials and the filtrate divided for nutrient analyses. Photoautotrophic and bacterial assimilation measurements are only available from the 2014 field campaign.
Ammonia and Nitrite Oxidation - Rates of ammonia and nitrite oxidation were measured via the enrichment of incubation bottles with 100nM of either 99 atom % 15NH!! or 98 atom %
15NO
!
! (Cambridge Isotope Laboratories, Inc.), respectively. In situ incubations were conducted
in transparent acid-washed polycarbonate bottles at either 100 or 50cm off the bottom. Randomly selected incubation bottles were completely covered in electrical tape in order to determine if 24-hour dark bottles reduced assimilation/uptake of ammonium and nitrite by competing
phytoplankton communities. The initial enrichment of ammonium for all incubations ranged between 1.7 and 89.7 atom % (median = 9.9 atom %), with greater enrichments in seawater samples collected at localities experiencing a dense Synecochoccus bloom in September 2013.
Uniformly low NO!! in Florida Bay resulted in initial enrichment of nitrite oxidation
bottles to be between 29.5 and 97.6 atom % (median = 48.5 atom %), which was greater than the recommended 10% enrichment but necessary for analytical purposes. After termination of nitrite oxidation incubations and subsequent filtration, excess 15NO!! was removed using the
methodology described in Granger and Sigman (2009) in which the addition of 0.4M sulfamic acid to a final pH < 3 for 15 minutes yields N2, sulfuric acid, and water. Samples were then frozen (-60°C) after the addition of NaOH that neutralized each sample to a pH of ~7. The efficiency of this method was tested in the laboratory on a standard solution of IAEA USGS 35 with varying concentrations of label (15NO!!) that spanned the range of starting nitrite values in
can be successfully removed by sulfamic acid without compromising the δ15N and δ18O of the standard solution.
Dissolved Nutrient Analyses
Ammonium Concentrations – The concentration of ammonium ([NH!!]) in filtered
seawater samples was determined according to the method of (Holmes et al., 1999). Briefly, 15mL was aliquoted in to three acid-washed amber Nalgene bottles that had been copiously rinsed with 18.2 MΩ ultrapure water. Standards were made daily and ranged from 10 to 2,000 nM via serial dilutions from a 1,000 mg/L stock solution of ammonium (Ricca Chemical). Three replicates of samples and standards were allowed to incubate for greater than 3 hours after the addition of 5mL of o-phthalaldehyde working reagent. Fluorescence was measured with a Turner Designs fluorometer, model TD-700, fitted with an ammonium optical kit. Linearity of standard curves always exceeded an R2 > 0.9, and ultrapure water blanks never exceeded the detection limit of 10 nM determined by repeated standard measurements.
Nitrite and Nitrate Concentrations – Nitrite ([NO!!]) plus nitrate ([NO !
!]) concentrations
of filtered seawater samples were assessed spectrophotometrically using a second generation Spectrophotometric Elemental Analysis System (SEASII) equipped with peristaltic pumps and a 15cm pathlength liquid-core waveguide (Adornato et al., 2005; Byrne, 2009). The determination of NOx concentrations was based upon the Griess Reaction, via cadmium reduction with
[NO!!] to [NO !
!] at non-bloom MB localities measured the following day. Nitrite and nitrate
standards were diluted from new 1,000µg/mL stock solutions (©SPEX CertiPrep.) daily and interspersed with samples. Seawater blanks from surface waters at station ALOHA never exceeded the detection limit of 25 nM determined from multiple analyses of standard solutions. All reported sample values are the average and standard deviation of either two or three
replicates.
Dissolved Organic Carbon – NPDOC was measured via combustion catalytic oxidation and non-dispersive infrared (NDIR) detection on a Shimazdu TOC-L instrument that was coupled to a Shimazdu TNM-L utilizing catalytic thermal decomposition and
chemiluminescence to assess TDN concentrations. NPDOC standards were generated from the dilution of a potassium pthallate stock solution and TDN standards were prepared from the dilution of a urea stock solution with 18.2 MΩ ultrapure water. Standards were interspersed for quality control and the linearity of all standard curves exceeded an R2 > 0.992. Each replicate sample vial was dispensed into two analysis tubes and concentrations reported for the subsequent three to five instrument injections. Therefore, all reported sample values are an average of 24 measurements. Ultrapure water from the field (i.e., field blanks) was treated identically with resulting concentrations < 20 µM for NPDOC.
Elemental and Stable Isotope Analyses
Particulate Organic Nitrogen – Frozen filters were lyophilized and folded in to large silver capsules prior to combustion on a Costech ECS 4010 Elemental Combustion System coupled to a Thermo Finnigan Delta XP mass spectrometer. Reported values are from one filter measurement and have analytical uncertainties of ± 2‰ and ± 0.2‰ for 15
N-labeled and
corrected delta values to atom %15
N for calculations. The reporting standard is AIR-N2 with an R
= 15N/14N = 0.0036782.
NOx Isotopic Composition - The δ15N and δ18O of N2O generated from nitrite + nitrate using the “denitrifier method” was determined using the methods described in Sigman et al. (2001) with modifications discussed in McIlvin and Casciotti (2011). Briefly, N2O was produced using the denitrifying bacteria Pseudomonas aureofaciens, which lacks the enzyme nitrous oxide (N2O) reductase. This N2O was then stripped from the reaction vial, cryofocused, separated on a PoroPLOT Q capillary column, and injected into a Finnigan MAT252 mass spectrometer. Samples and international reference materials (NIST 3, USGS 32, USGS 34, USGS 35) were treated identically. Accuracy of this methodology was previously determined to be < ±0.5 (± 0.00018 atom % 15N) for samples containing >2.5 nmol of NOx. However, for samples
containing <2.5 nmol NOx, linearity corrections were necessary as determined from references at varying low concentrations (Werner and Brand, 2001), and blank corrections calculated from an indirect regression method described in Ohlsson (2013).
Rate Calculations
Since the introduction of apparent 15N uptake (𝑈!) tracer experiments in marine
environments by Dugdale and Georing (1967), where 𝐼𝑝(!) is the 15N atom % of PON at time T,
𝐼𝑝(!) is the measured 15N atom % of ambient PON, 𝐼𝑠(!) is the 15N atom % of ammonium tracer
at time T, 15n is the 15N atom % of ambient NH!! (0.3663%), and [PON]A is the ambient
(1)
Kanda et al. (1987) appropriately noted the unrealistic complexities of measuring
dissolved inorganic nitrogen species, such as 15NH!!, at various time points and instead provided
a mathematical alternative (Equations 2,3, and 4) that utilizes the relative regeneration (R) to potential uptake (UP) ratio of ammonium to determine its average enrichment (𝐼𝑠)throughout an incubation and thus the isotope dilution effect as initially defined by Laws (1984). In many open ocean and coastal environments, the regeneration and uptake of inorganic nutrients is generally in steady-state (a = 1, Equation 2), but can range between 0.5 and 2 (Kanda et al., 1987) as defined by:
(2)
To determine a quotient appropriate for calculating 𝐼𝑠, previously published daytime
NH!! uptake and regeneration rates for Florida Bay waters were utilized. Specifically, from
McCarthy et al. (2009), the average ratio for four sites across Florida Bay during the month of August (0.8 ± 0.2) was used for bacterial and photoautotrophic assimilation incubations in which the gross change in ammonium concentrations (final [NH!!] – initial [NH
!!]) was less than zero
(N=11). In the event that the change in [NH!!] was greater than zero (N=5), the average ratio of
Equation 3, where [𝑁𝐻!!]A is the ambient and [𝑁𝐻
!!]T is the tracer concentration of ammonium,
and with the approximate ratio (a) from Equation 2, the isotope dilution effect can be derived using the value of x (Equation 4).
(3)
(4)
The value of 𝐼𝑠 in the incubations can also be determined by using the average daytime or nighttime regneration and uptake rates extracted from McCarthy et al. (2009) via Equation 5. (5)
second and third assumptions (Laws, 1985). Therefore, upon using the ambient concentration of PON to minimize the possible impacts of NOx assimilation, the isotope dilution-corrected potential rate for either phytoplankton (UP) or bacterial (UB) uptake of 15NH!! becomes:
(6)
The identical theoretical framework was applied when calculating the rates of ammonia oxidation (Equation 7) as initially described by Ward et al. (1989) and successfully employed by Beman et al., (2008, 2011, and 2012). In the present study, the average daily autotrophic plus bacterial uptake and regeneration rates determined for each of the three localities in this study were utilized to derive an approximate 𝐼𝑠. Again, the ambient instead of the final concentration of NOx was applied in order to minimize the underestimation resulting from NOx assimilation. Therefore, the presented ammonia oxidation rates (𝑂𝑥!) are considered “potential” values.
(7)
The rate of the second step of nitrification, nitrite oxidation (𝑂𝑥!), was determined via
the calculation specified in Beman et al., 2013 (Equation 8). Briefly, the atom % enrichment of
NO!! at the beginning of an incubation (𝐼𝑒
(!)) was calculated by isotope mass balance based on
the ambient nitrite concentration, assuming that the 15N activity of the unlabeled fraction was 0.3663 atom %, and 𝑁(!") representing the 15N atom % of NO!! at time T after the sulfamic acid
unlabeled nitrite determined from parallel ammonia oxidation incubations (see Figures 9 & 10). All values of nitrite oxidation are considered “potential” rates that utilize the ambient
concentrations of NO!! ([𝑁𝑂
!!]A , Equation 8).
(8)
Results
Nutrient Characteristics
Consistent with previous studies of central Florida Bay nutrients, ammonium was the dominant species of DIN present in the water-column at the three major localities, except under phytoplankton bloom conditions, within seagrass dominated sites, and at more ocean-influenced FWC and BP locations where concentrations of nitrate + nitrite often exceeded NH!!
concentrations. Ambient average NH!! to NOx ratios for all MB sites during normal, non-bloom,
conditions ranged between 0.01 and 7.3 (mean = 2.0 ± 2.4, N = 14 discrete collections), while ratios at FWC and BP were narrower between 0.5 and 1.0 (mean = 0.7 ± 0.2, N= 7 discrete collections). In addition, ambient NO!! to NO
!
! ratios at MB and BP were approximately 5:1, with
one Mystery Basin locality (HF 2/5) having an nitrite concentration greater than nitrate. Variability in MB ambient NH!! values in early September of 2013 were pronounced,
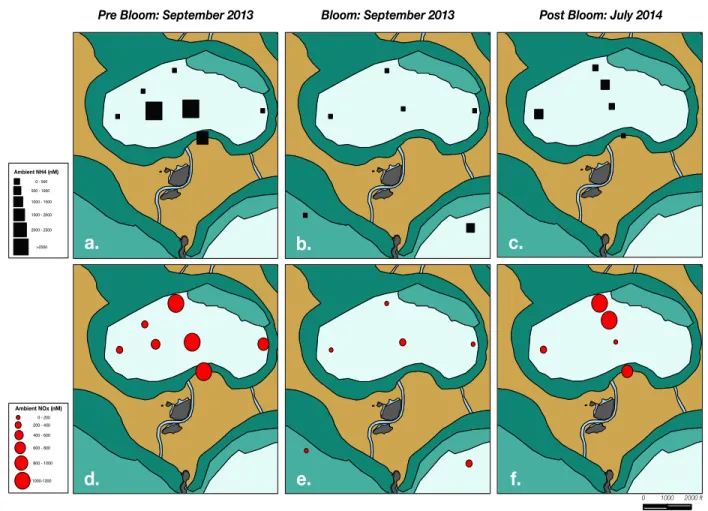
northwest to southeast (HF 5 to HF 4) along the typical direction of water flow (Martens et al., unpublished data). In the subsequent sampling season, July 2014, MB ambient NOx values were on average lower than the previous year (Table 1) but not significantly different, with similar basin-wide patterns as before the bloom except for the anomalously low (< 200 nM)
concentrations observed at HF 1 (Figure 5f). However, ambient NH!! concentrations within MB
showed a decrease from 2013 to 2014 (Table 1) as site-averaged values ranged between 273 and 1,892 nM (basin mean = 1,049 ± 632, N = 5) with no apparent spatial trends. Ambient
ammonium at BP did not vary between sampling years with discrete values ranging between 787 and 1,083 nM (mean = 938 ± 124 nM, N = 5), while NOx concentrations from individual
samples ranged from 955 to 2,652 (mean = 1,672 ± 589 nM, N = 6). Similar to Burnt Point, FWC average NOx and NH!! concentrations were 902 ± 448 (N = 3) and 802 ± 227 (N = 3),
respectively.
Pre Bloom Bloom Post Bloom
Mystery Basin Ammonium
Mystery Basin Nitrate + Nitrite
1,356 ± 1,259 (N=7 Sites)
838 ± 378 (N=7 Sites)
224 ± 454 (N=6 Sites)
125 ± 101 (N=6 Sites)
1,049 ± 632 (N=5 Sites)
692 ± 418 (N=5 Sites)
Table 1 – Average 15NH!! and NOx concentrations (nM) from discrete water column
samples before, during, and after a Synecochoccus bloom in Mystery Basin. Data
Assimilation and Nitrification Variability
Isotope dilution corrected ammonium assimilation rates from 2014 at tidally influenced BP and FWC were as expected significantly greater than the bacterial incorporation rates (Figure 6). The reverse was observed at MB where NH!! bacterial assimilation was greater than the
averages measured at both nearshore BP and FWC sites. Moreover, Mystery Basin’s bacterial assimilation rate of 573 nmol N L-1 d-1 was more than two of its three individual
photoautotrophic 15N incubations (Figure 6). This elevated bacterial assimilation rate at HF 2 (Figure 3) should be viewed with caution as no replicate incubations were completed within
Pre Bloom: September 2013 Bloom: September 2013 Post Bloom: July 2014
a. b. c.
d. e. f.
Figure 5 – Concentrations of 15NH!! (a-c) and NOx (d-f) in and around Mystery Basin during
Mystery Basin. Nonetheless, McCarthy et al. (2009) and Williams et al. (2008) noted from dark bottle 15NH4 incubations and net bacterial growth rates the potential dominance of heterotrophic ammonium assimilation within Florida Bay. Therefore, bacterial NH!! assimilation at MB will be
considered accurate, but not statistically precise for the remainder of this thesis. No trends were observed between assimilation rates and concentrations of ammonium.
Burnt
Point DockFWC
Mystery Basin
Ammonium Assimilation Rates (
nmol
N L
-1 d -1) Day Photoautotrophic Assimilation Night Photoautotrophic Assimilation Bacterial Assimilation
n = 4
n = 2
n = 1
n = 1
n = 3
n = 2
n = 3
Ambient potential rates of ammonia oxidation at all experimental locations were surprisingly low (mean = 0.4 ± 0.5 nmol N L-1 d-1, N = 41) despite sufficient ammonium substrate. Previous research suggests that competition for substrate with phytoplankton communities is responsible for the low rates of ammonia oxidation in well-lit surface waters (Smith et al., 2014). In an attempt mitigate this effect, select incubation bottles at all
experimental sites were covered to allow less than 1% light transmission. Interestingly, this had no statistical effect on ammonia oxidation rates (Mann–Whitney U test, P = 0.285), and in many instances rates were lower in dark incubations than under normal 24-hour day/night conditions. Combined, average ambient ammonia oxidation rates at Burnt Point (mean = 0.4 ± 0.2 nmol N L -1 d-1, N = 6) and Mystery Basin pre and post phytoplankton bloom (mean = 0.4 ± 0.3 nmol N L-1 d-1, N = 24) were not significantly different from each other. However, within each sampling season, differences appeared in which mean rates of ammonia oxidation at BP were greater than MB in 2013, but three times less than MB in 2014. Therefore, it is plausible that such annual changes observed in this study may be a result of limited sampling capabilities, thus suggesting long-term nitrification rates may be fairly constant throughout the central and southern portions of the bay. Due to the unique proximity of the FWC site to the Florida Key’s inter-island channel between Big Pine Key and Marathon, frequent large fluctuations in current velocities (personal observation) allow for exchange between bay and offshore oceanic water. Thus, the
anonymously high ammonia oxidation measurement of 2.7 nmol N L-1 d-1 observed at FWC, in addition to the observed background δ15N (5.1‰) and δ18O (3.4‰) of nitrate, suggests a
nitrification rate that is representative of offshore Florida Keys reef track rather than Florida Bay (Leichter et al., 2007).
oxidation under phytoplankton bloom free water-column conditions (Figures 8). Individual rates of potential nitrite oxidation determined parallel to potential ammonia oxidation incubations were between 5 and 150 times greater. We suspect that the necessary addition of 15NO!! may
have minimally stimulated nitrite oxidizing bacterial activity as result of greater than the recommended 10% tracer addition (median = 48.5 at %), but can only explain a fraction of the observed decoupling. While September 2013 was the only sampling season where nitrite
oxidation rates were determined, no significant difference was observed between the rates at BP (mean = 4.5 ± 0.9 nmol N L-1 d-1, N = 4) and at MB (mean = 4.2 ± 2.5 nmol N L-1 d-1, N = 16) under bloom free conditions (Mann–Whitney U test, P = 0.450); again, suggesting that an averageof 4.3 ± 2.3 nmol N L-1 d-1 (N = 20) for both localities is appropriate.
Nitrification within Sponge Excurrents
Accumulation of the two dominant species of DIN, NH!! and NOx, in the excurrents of
numerous demosponges from Florida Bay has lead to categorization of these sponges as either HMA or LMA (Hoer, 2015). Species comprising the greatest biomass at all three locations in this study before and after the phytoplankton bloom were chosen (Figure 4). Ammonium enriched sponge excurrent plumes (LMA + HMA sponges), determined by the concentration difference between the NH!! of the sponge’s excurrent and the NH
!! of the ambient surrounding
water, was observed in 8 of the 11 individuals assessed. Conversely, nitrate and nitrite enriched sponge excurrent plumes (HMA sponges only), determined by the concentration difference between a sponge’s excurrent and its surrounding water NOx, was noted in 3 of the 11
However, within sponge excurrents, rates of ammonia oxidation were greater than the corresponding ambient oxidation rates for only 6 of the 11 organisms assessed (Table 2).
Replicate analyses of both the concentration of NOx and the enriched isotopic composition of the greatest observed rate in Table 2 (Burnt Point, S. vesparium), confirms the analytical validity of this data point despite a ~22,000-fold difference between it and the other observed values. This remarkable ammonia oxidation rate (91 nmol N L-1 hr -1) was a result of incorporating a small
Sponge Specie Sponge Excurrent Ammonia Oxidation Rate
(nmol N L-1 d-1)
Ambient
Ammonia Oxidation Rate (nmol N L-1 d-1)
Burnt Point
I. compana 0.3 0.5 ± 0.1(n=2)
I. compana B.D. 0.2 ± 0.004
(n=2)
S. vesparium B.D. 0.5 ± 0.1
(n=2)
S. vesparium ‡ 2.1 x 10³ 0.5 ± 0.1
(n=2)
S. vesparium 0.5 0.2 ± 0.004(n=2)
S. graminea 1.1 0.5 ± 0.1(n=2)
FWC Dock
C. nucula 0.5 2.7
(n=1)
Mystery Basin
S. vesparium * 0.1 0.01 ± 0.001
(n=2)
S. vesparium 0.4 0.04
(n=1)
S. vesparium 0.3 (n=1)0.04
H. melendocia 0.6 0.8 ± 0.3
(n=3)
Table 2 –Individual rate incubations of ammonia oxidation occurring in the excurrent plumes of five distinct sponge species evaluated. Background water column rates from incubations
conducted alongside sponge excurrent measurements provided in the far right column. A statistical variability of ± 1 standard deviation was used.
* Indicates an incubation in which Synecochoccus bloom conditions were present ‡ Sponge excurrent incubation with an anomalously high rate value.
piece of the sponge’s tissue in to the incubation bottle after accidentally disturbing the organism with a sampling syringe. Collectively, this unique dataset represents the first know quantification of potential nitrogen cycling that occurs in the excurrent plumes of marine sponges prior to vertical or horizontal advection and should be replicated in environments replete in DIN such as the deep sea.
Impacts of a Phytoplankton Bloom
Prior to the entrance of a dense cyanobacterial bloom in MB during our 2013 field season, two fishermen noted its presence in Rabbit Key Basin, north of Mystery Basin (William Sharp, personal communication 2013). Discrete water samples and nitrification incubations were completed in MB before noticing the bloom’s southward expansion into the basin beginning on September 20, 2013. Bloom conditions were not measured or observed at either the FWC or BP sites. For simplicity, water-column conditions in Mystery Basin have been split in to three categories: “pre bloom” (September 18-19, 2013), “bloom” (September 20-27, 2013), and “post bloom” (July 2014). For a more detailed description of the bloom’s density and two-month growth and decay in Florida Bay (i.e. chlorophyll a concentrations), please refer to the concomitant research in Hoer et al. (2015).
Water-column DIN decreased remarkable at nearly every sublocation in MB as a result of greater N demand by the Synechococcus community between mid and late September (Figure 5 & Table 1). The pronounced reduction in water-column DIN persisted until late November and early September when NH!! and NOx concentrations began to steadily increase (Hoer, 2015).
(Figure 7). Regardless, nitrite oxidation remained decoupled from ammonia oxidation except when DIN concentrations approached the limit of detection (NH!! < 10 nM, NOx < 25nM),
where both rates were essentially zero. Despite slightly lower substrate concentrations in the 2014 sampling season as a result of significantly less sponge-derived DIN production in the basin (Hoer, 2015), the average water-column ammonia oxidation rate recovered to its pre bloom value. Rates of nitrite oxidation in MB were not determined following the bloom, but we
speculate that they also recovered concomitantly with elevated ammonia oxidation rates and
substrate concentrations.
Pre Bloom Bloom Post Bloom
Ammonia Oxidation
(nmol
N L
-1 d -1)
Nitrite Oxidation
(nmol
N L
-1 d -1)
N/A
Figure 7 – Average rates of ammonia oxidation and nitrite oxidation from ambient
Discussion
Florida Bay’s Pelagic DIN Cycle
The chemoautotrophic nature of both steps of nitrification, in addition to their importance for sustaining global primary productivity, has lead to further investigations of coastal and open-ocean studies (Beman et al., 2011; Fussel et al., 2012; Ward, 2005). However, water-column nitrification in subtropical estuarine environments has been largely uncharacterized and has remained an unanswered question in Florida Bay since extensive nutrient surveys began decades ago (Burd and Jackson, 2002).
Results from this study indicated that ambient pelagic rates of ammonia oxidation did not exceed 3 nmol N L-1 d -1 even when ammonium concentrations were greater than 1 µM.
However, September nitrification rates in India’s Kochi estuary were greater than those measured in this study, ranging between 1.4 and 9.6 nmol N L-1 d -1 despite concentrations of
NH!! greater than 2 µM (Miranda et al., 2008). Our results mimicked winter surface rate
measurements at the Bermuda Atlantic Time Series (BATS) that were below 1 nmol N L-1 d -1 and only begin to increase at depths over 75 meters (Newell et al., 2013). Recent suggested controls on nitrification in photic environments include salinity (Carini et al., 2010; Miranda et al., 2008) and competition for substrate with phytoplankton communities (Smith et al., 2014). While neither of those controls was directly assessed in this study, one can infer that either one or both were partially responsible for the low rates observed because on average, greater than 34% of the 15NH!! label was measured in the final PON pool while a mere 0.02% of the 15NH
! !
work that observed enhanced DON production in the Southern California Bight and Chesapeake Bay estuaries (Bronk et al., 1994). Assimilation of 15NH!! in this study confirms the rapid cycling
of DIN through autotrophs and heterotrophs as turnover times of ammonium from all three sites ranged between 21 hours and 3 days. Bronk et al. (1994) also noted that during dense
phytoplankton blooms, uptake of DIN is followed by an even more rapid PON mineralization to DON. The observed Synechococcus bloom of Mystery Bain indicates rapid assimilation and suggests that the “missing” label was lost to the DON fraction, as concentrations of DIN approached zero and on average 68% of the 15NH!! and 90% of the 15NO
!
! labels were retrieved
in the final PON pool
To my knowledge, this study is the first attempt to measure 15NO!! oxidation rates in an
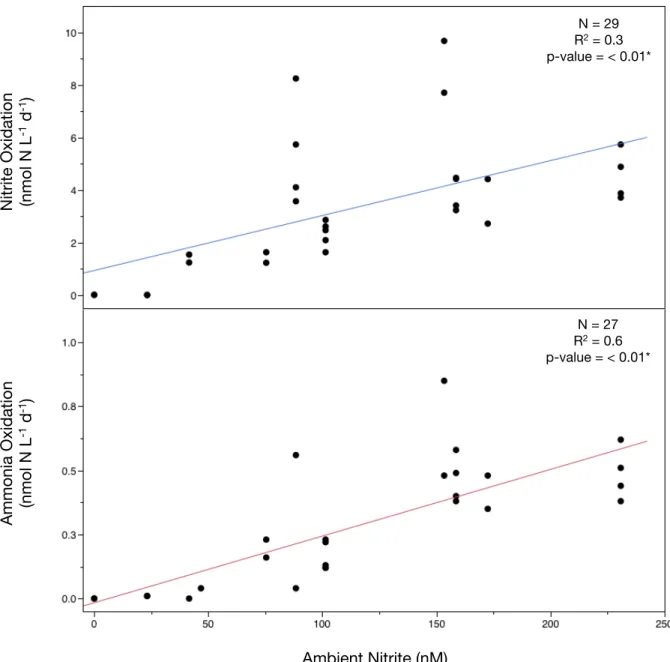
estuarine environment. The results challenge the prevailing assumption that ammonia oxidation rates always dictate total water-column nitrification and thus new nitrate formation. As in previous other studies that measured nitrite concentrations in Florida Bay (Boyer et al., 1999; Fourqurean et al., 1993; Heil et al., 2007), we consistently observed concentrations between 41 and 281 nM at BP and MB under oxygenated and bloom-free conditions. Moreover, ambient concentrations of NO!! were significantly correlated with nitrite oxidation rates (Figure 9) despite
the molecule’s rare accumulation in oligotrophic surface waters due to its strong redox potential. Corresponding rates of nitrite oxidation exceed those of ammonia oxidation in all non-bloom impacted incubations regardless of sampling location, with an approximate stoichiometric NH!!
While rare, this uncoupling phenomenon has been observed in the oxygen minimum zones of the Eastern Tropical North Pacific (Beman et al., 2013) and the Bengula upwelling region of Namibia (Fussel et al., 2012). In both environments, ammonia oxidation was
supplemented with suboxic nitrate reduction that was responsible for this decoupling. However, western and central Florida Bay waters remain well-oxygenated year-round (Boyer et al., 1999; Hoer, 2015), thus limiting NO!! reduction to tightly regulated microanerobic environments and
sediments. Therefore, answering the puzzling question as to how both steps of nitrification could remain decoupled requires further studies that replicate this research, measure the sediment-water flux of nitrite, and examine the possibility of novel oxidizing pathways responsible for generating nitrite. In recent experiments, Thaumarchaeota communities were responsible for the oxidation of polyamines, amino acids, and urea to significant concentrations of NOx without
Ammonia Oxidation (nmol N L-1 d-1)
Nitrite Oxidation (
nmol
N L
-1 d -1)
N = 12 R2 = 0.4 p-value = 0.03*
Figure 8 – Rates of ammonia and nitrite oxidation run in parallel incubations at Burnt Point and Mystery Basin under Synecochoccus bloom and non-bloom conditions. Black circles represent the average of replicate
prior degradation to ammonia (Hollibaugh et al., 2014; Hollibaugh et al., 2015). Given the
nanomolar concentrations of polyamines at the South Atlantic Bight (Liu et al., 2014) and urea in Florida Bay (Heil et al., 2007), the possibility of an alternate nitrite-producing pathway was theorized.
We hypothesized that locally elevated ambient water-column concentrations of NOx (primarily as NO!!) in Florida Bay were representative of ammonia oxidation and nitrite
oxidation rates. The data presented in this study do not entirely support this assertion, as rapid assimilation and regeneration of ammonium by bacterial and phytoplankton communities, in conjunction with seagrass uptake, and sponge-mediated N cycling exert a greater control on water column DIN concentrations in Florida Bay’s restricted basins. Nonetheless, the unique opportunity to observe and measure the effects of a detrimental cyanobacterial bloom provided valuable insights as to how nitrifying organisms respond when substrates become limiting. Such harmful cyanobacterial blooms are ubiquitously found in aquatic and marine ecosystems, often as a result of anthropogenic forcing (Paerl and Otten, 2013). Therefore, improper management of these events in bloom-prone ecosystems, such as Florida Bay, could be detrimental to dissolved C and N cycles.
Sponge Excurrents as Potential Nitrification “Hotspots”
Enhanced rates of ammonia oxidation in the excurrent plumes of sponges were observed
in half of the sponges assessed in this study. These sponges have recently been documented as
significant NH!! producers, with excurrent concentrations six times ambient concentrations in
Mystery Basin (Hoer, 2015). We suspected LMA sponge excurrents to have greater rates of
nitrification than HMA sponges given their consistent release of ammonium. However, while
not all organisms examined in this study supported this hypothesis. Recent evidence suggests
that tropical sponges periodically regenerate their filtering system by expelling choanocytes in to
the water column (de Goeij et al., 2013). Therefore, ammonia oxidizing bacteria and/or archaea
living in symbiosis with choanocytes could be also released into these excurrent plumes where
their population can be sustained by the ammonium waste. We suspect that the inconsistent
observations were due to opportunity sampling error and thus we may have missed these
choanocyte + microbial expulsion events. Further investigations of nitrifying organisms in
nutrient replete environments could reveal that sponges, in addition to other benthic
invertebrates, could be responsible for sustaining microbial populations that fix significant
Figure 9 – Bottom graph: Relationship of ammonia oxidation rates and nitrite concentrations (final product) for individual incubations.
Top graph: Dependency of nitrite oxidation rates on NO!! concentrations (substrate) determined
from individual incubation bottles.
Nitrite Oxidation
(nmol
N L
-1 d -1)
Ambient Nitrite (nM)
N = 29
R2 = 0.3
p-value = < 0.01*
Ammonia Oxidation
(nmol
N L
-1 d -1)
N = 27
R2 = 0.6
Figure 10 – Bottom graph: Relationship of ammonia oxidation rates and NOx concentrations (final products) for individual incubations.
Top graph: Nitrite oxidation rates and NOx concentrations (primarily product) determined from individual incubation bottles.
Ammonia Oxidation
(nmol
N L
-1 d -1)
Nitrite Oxidation
(nmol
N L
-1 d -1)
N = 29 R2 = 0.3 p-value = < 0.01*
N = 41 R2 = 0.3 p-value = < 0.01*
REFERENCES
Adornato, L. R., Kaltenbacher, E. A., Villareal, T. A., and Byrne, R. H., 2005, Continuous in situ determinations of nitrite at nanomolar concentrations: Deep Sea Research Part I:
Oceanographic Research Papers, v. 52, no. 3, p. 543-551.
Beman, J. M., Chow, C. E., King, A. L., Feng, Y., Fuhrman, J. A., Andersson, A., Bates, N. R., Popp, B. N., and Hutchins, D. A., 2011, Global declines in oceanic nitrification rates as a consequence of ocean acidification: Proceedings of the National Academy of Sciences of the United States of America, v. 108, no. 1, p. 208-213.
Beman, J. M., Leilei Shih, J., and Popp, B. N., 2013, Nitrite oxidation in the upper water column and oxygen minimum zone of the eastern tropical North Pacific Ocean: The ISME Journal.
Blackburn, T. H., 1979, Method for measuring rates of NH4+ turnover in anoxic marine sediments, using a 15N-NH4+ dilution technique: Applied and Environmental Microbiology, v. 37, no. 4, p. 760-765.
Boyer, J., Fourqurean, J., and Jones, R., 1999, Seasonal and long-term trends in the water quality of Florida Bay (1989–1997): Estuaries, v. 22, no. 2, p. 417-430.
Bronk, D. A., Glibert, P. M., and Ward, B. B., 1994, Nitrogen Uptake, Dissolved Organic Nitrogen Release, and New Production: Science, v. 265, no. 5180, p. 1843-1846.
Burd, A. B., and Jackson, G. A., 2002, An analysis of water column distributions in Florida Bay: Estuaries, v. 25, no. 4, p. 570-585.
Butler, M. J., Hunt, J. H., Herrnkind, W. F., Childress, M. J., Bertelsen, R., Sharp, W., Mathews, T., Field, J. M., and Marshall, H. G., 1995, Cascading disturbances in Florida Bay, USA: cyanobacteria blooms, sponge mortality, and implications for juvenile spiny lobsters Panulirus argus: Marine Ecology Progress Series, v. 129, p. 119-125.
Byrne, N., 2009, Presence and activity of anaerobic ammonium-oxidizing bacteria at deep-sea hydrothermal vents: The ISME Journal, v. 3, no. 1, p. 117-123.
Caperon, J., Schell, D., Hirota, J., and Laws, E., 1979, Ammonium excretion rates in Kaneohe Bay, Hawaii, measured by a 15N isotope dilution technique: Marine Biology, v. 54, no. 1, p. 33-40.
Carini, S. A., McCarthy, M. J., and Gardner, W. S., 2010, An isotope dilution method to measure nitrification rates in the northern Gulf of Mexico and other eutrophic waters: Continental Shelf Research, v. 30, no. 17, p. 1795-1801.
de Goeij, J. M., van Oevelen, D., Vermeij, M. J., Osinga, R., Middelburg, J. J., de Goeij, A. F., and Admiraal, W., 2013, Surviving in a marine desert: the sponge loop retains resources within coral reefs: Science, v. 342, no. 6154, p. 108-110.
Diaz, M. C., and Ward, B. B., 1997, Sponge-mediated nitrification in tropical benthic communities: Marine Ecology Progress Series, v. 156, p. 97-107.
Dugdale, R. C., and Goering, J. J., 1967, Uptake of new and regenerated forms of nitrogen in primary productivity: Limnology and Oceanography, v. 12, no. 2, p. 196-206.
Fourqurean, J. W., Jones, R. D., and Zieman, J. C., 1993, Process Influencing Water Column Nutrient Characteristics and Phosphorus Limitation of Phytoplankton Biomass in Florida Bay, FL, USA:Inferences from Spatial Distributions: Estuarine, Coastal and Shelf
Science, v. 36, no. 3, p. 295-314.
Fussel, J., Lam, P., Lavik, G., Jensen, M. M., Holtappels, M., Gunter, M., and Kuypers, M. M., 2012, Nitrite oxidation in the Namibian oxygen minimum zone: ISME J, v. 6, no. 6, p. 1200-1209.
Glibert, P. M., Heil, C. A., Rudnick, D. T., Madden, C. J., Boyer, J. N., and S.P., K., 2009, Florida Bay: Water quality status and trends, historic and emerging algal bloom problems: Contributions in Marine Science, v. 38, p. 5-17.
Glibert, P. M., Lipschultz, F., McCarthy, J. J., and Altabet, M. A., 1982, Isotope dilution models of uptake and remineralization of ammonium by marine plankton1: Limnology and Oceanography, v. 27, no. 4, p. 639-650.
Granger, J., and Sigman, D. M., 2009, Removal of nitrite with sulfamic acid for nitrate N and O isotope analysis with the denitrifier method: Rapid Communications in Mass
Spectrometry, v. 23, no. 23, p. 3753-3762.
Heil, C. A., Revilla, M., Gilbert, P. M., and Sue, M., 2007, Nutrient quality drives differential phytoplankton community composition on the southwest Florida shelf: Limnology Oceanography, v. 53, no. 3, p. 1067-1078.
Hentschel, U., Usher, K. M., and Taylor, M. W., 2006, Marine sponges as microbial fermenters: FEMS microbiology ecology, v. 55, no. 2, p. 167-177.
Hoer, D. R., 2015, The role of marine sponges in carbon and nitrogen cycles of coral reef and nearshore environments: THE UNIVERSITY OF NORTH CAROLINA AT CHAPEL HILL.
Hollibaugh, J. T., Tolar, B. B., Popp, B. B., and Wallsgrove, N. J., Evidence for the direct oxidation of polyamine nitrogen by Thaumarchaeota-dominated marine nitrifying communities, in Proceedings Conference Abstract-Aquatic Sciences Meeting2015. Holmes, R. M., Aminot, A., Kérouel, R., Hooker, B. A., and Peterson, B. J., 1999, A simple and
precise method for measuring ammonium in marine and freshwater ecosystems: Canadian Journal of Fisheries and Aquatic Sciences, v. 56, no. 10, p. 1801-1808. Hunt, J., and Nuttle, W., 2007, Florida Bay Science Program: A Synthesis of Research on
Florida Bay: Fish and Wildlife Research Institute.
Jiménez, E., and Ribes, M., 2007, Sponges as a source of dissolved inorganic nitrogen:
Nitrification mediated by temperate sponges: Limnology and Oceanography, v. 52, no. 3, p. 948-958.
Kanda, J., Laws, E. A., Saino, T., and Hattori, A., 1987, An evaluation of isotope dilution effect from conventional data sets of 15N uptake experiments: Journal of Plankton Research, v. 9, no. 1, p. 79-90.
Lavrentyev, P. J., Bootsma, H. A., Johengen, T. H., Cavaletto, J. F., and Gardner, W. S., 1998, Microbial plankton response to resource limitation: insights from the community
structure and seston stoichiometry in Florida Bay, USA: Marine Ecology Progress Series, v. 165, p. 45-57.
Laws, E., 1984, Isotope dilution models and the mystery of the vanishing 15N: Limnology and Oceanography, v. 29, no. 2, p. 379-386.
Laws, E. A., 1985, Analytic models of NH4+ uptake and regeneration experiments1: Limnology and Oceanography, v. 30, no. 6, p. 1340-1350.
Lee, T. N., Johns, E., Melo, N., Smith, R. H., Ortner, P., and Smith, D., 2006, On Florida Bay hypersalinity and water exchange: Bulletin of Marine Science, v. 79, no. 2, p. 301-327. Leichter, J. J., Paytan, A., Wankel, S., Hanson, K., Miller, S., and Altabet, M. A., 2007, Nitrogen
and oxygen isotopic signatures of subsurface nitrate seawaterof the Florida Keys reef tract: Limnology and Oceanography, v. 52, no. 3, p. 1258-1267.
Liu, Q., Lu, X., Tolar, B. B., Mou, X., and Hollibaugh, J. T., 2014, Concentrations, turnover rates and fluxes of polyamines in coastal waters of the South Atlantic Bight:
Biogeochemistry, v. 123, no. 1-2, p. 117-133.
McCarthy, M. J., Gardner, W. S., P.J., L., F.J., J., and C.J., W., 2009, Water column nitrogen cycling and microbial plankton in Florida Bay: Contributions in Marine Science, v. 38, p. 49-62.
Miranda, J., Balachandran, K. K., Ramesh, R., and Wafar, M., 2008, Nitrification in Kochi backwaters: Estuarine, Coastal and Shelf Science, v. 78, p. 291-300.
Newell, S. E., Fawcett, S. E., and Ward, B. B., 2013, Depth distribution of ammonia oxidation rates and ammonia-oxidizer community composition in the Sargasso Sea: Limnology and Oceanography, v. 58, no. 4, p. 1491-1500.
Ohlsson, K. E., 2013, Uncertainty of blank correction in isotope ratio measurement: Anal Chem, v. 85, no. 11, p. 5326-5329.
Paerl, H. W., and Otten, T. G., 2013, Harmful cyanobacterial blooms: causes, consequences, and controls: Microb Ecol, v. 65, no. 4, p. 995-1010.
Peterson, B. J., Chester, C.M., Jochem, F.J., Fourqurean, J.W., 2006, Potential role of sponge communities in controlling phytoplankton blooms in Florida Bay: Marine Ecology Progress Series, v. 328, p. 93-103.
Phlips, E. J., Badylak, S., and Lynch, T. C., 1999, Blooms of the picoplanktonic cyanobacterium Synechococcus in Florida Bay, a subtropical inner-shelf lagoon: Limnology and
Oceanography, v. 44, no. 4, p. 1166-1175.
Sigman, D. M., Casciotti, K. L., Andreani, M., Barford, C., Galanter, M., and Bohlke, J. K., 2001, A Bacterial Method for the Nitrogen Isotopic Analysis of Nitrate in Seawater and Freshwater: Anal. Chem, v. 73, no. 17, p. 4145-4153.
Smith, J. M., Chavez, F. P., and Francis, C. A., 2014, Ammonium uptake by phytoplankton regulates nitrification in the sunlit ocean: PLoS One, v. 9, no. 9, p. e108173.
Southwell, M. W., Weisz, J. B., Martens, C. S., and Lindquist, N., 2008, In situ fluxes of dissolved inorganic nitrogen from the sponge community on Conch Reef, Key Largo, Florida: Limnol. Oceanogr, v. 53, no. 3, p. 986-996.
Sutula, M. A., Perez, B. C., Reyes, E., Childers, D. L., Davis, S., Day, J. W., Rudnick, D., and Sklar, F., 2003, Factors affecting spatial and temporal variability in material exchange between the Southern Everglades wetlands and Florida Bay (USA): Estuarine, Coastal and Shelf Science, v. 57, no. 5-6, p. 757-781.
Ward, B. B., 2005, Temporal variability in nitrification rates and related biogeochemical factors in Monterey Bay, California, USA: Marine Ecology Progress Series, v. 292, p. 97-109. Ward, B. B., Kilpatrick, K. A., Renger, E. H., and Eppley, R. W., 1989, Biological nitrogen
cycling in the nitracline: Limnology and Oceanography, v. 34, no. 3, p. 493-513. Werner, R. A., and Brand, W. A., 2001, Referencing strategies and techniques in stable isotope
Williams, C. J., Boyer, J. N., and Jochem, F. J., 2008, Microbial activity and carbon, nitrogen, and phosphorus content in a subtropical seagrass estuary (Florida Bay): evidence for limited bacterial use of seagrass production: Marine Biology, v. 156, no. 3, p. 341-353. Yarbro, L., and Carlson, P., Jr., 2008, Community Oxygen and Nutrient Fluxes in Seagrass Beds