EVALUATION OF ENHANCED COAGULATION FOR THE REMOVAL OF DISSOLVED ORGANIC NITROGEN AND THE CONTROL OF NITROGENOUS
DISINFECTION BYPRODUCT FORMATION
Ryan B. Gustafson
A thesis submitted to the faculty of the University of North Carolina at Chapel Hill in partial fulfillment of the requirements for the degree of Master of Science in the Department of Environmental Sciences and Engineering, Gillings School of Global Public Health.
Chapel Hill 2012
Approved by:
Dr. Philip C. Singer
Dr. Stephen C. Whalen
ii
ABSTRACT
RYAN B. GUSTAFSON: Evaluation of Enhanced Coagulation for the Removal of Dissolved Organic Nitrogen and the Control of Nitrogenous Disinfection Byproduct Formation
(Under the direction of Dr. Philip C. Singer)
Enhanced coagulation is widely acknowledged as the best available conventional
technology for removal of total and dissolved organic carbon (TOC/DOC) and control of
regulated trihalomethane (THM4) and haloacetic acid (HAA5) disinfection byproducts
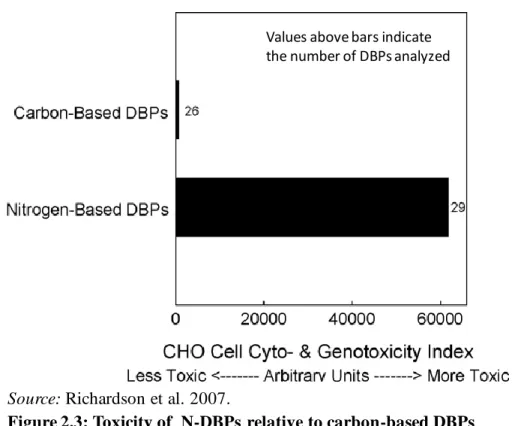
(DBPs). Recent DBP toxicity research has indicated that many nitrogen-containing DBPs
(N-DBPs) are more cytotoxic and genotoxic than THM4 and HAA5. The objectives of this study
were to evaluate the capacity of enhanced coagulation to remove dissolved organic nitrogen
(DON) and to reduce formation of dichloroacetonitrile (DCAN) and dichloroacetamide
(DCAM), representative species of two important N-DBP classes. Thirteen raw drinking
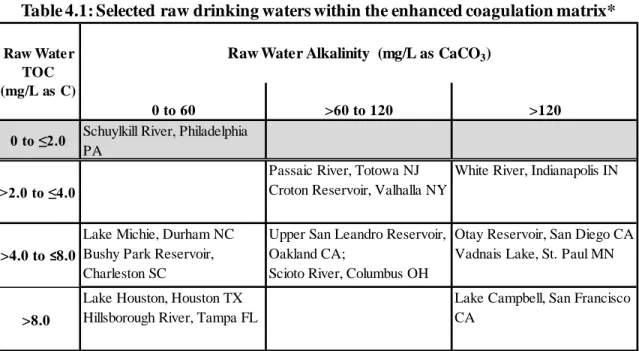
waters from across the U.S., encompassing the range of TOC and alkalinities within the
enhanced coagulation matrix, were investigated. This thesis presents and discusses
relationships between observed precursor surrogate measures, DBP formation, and results of
treatment by enhanced coagulation, which demonstrate greater removal of DOC and
iii
ACKNOWLEDGEMENTS
First and foremost, I owe a debt of gratitude to Dr. Singer for allowing me to study and conduct research under his guidance, for his patience, and for “never giving up.” I feel lucky
to have been part of an exciting research project in an excellent atmosphere and I am
humbled to have a link to his remarkable legacy and contribution to the drinking water field. I would also like to thank Dr. Whalen and Dr. Cory for agreeing to sit on my Master’s
committee as well as for their individual contributions to my research. I would also like to
thank Dr. Leith for taking a special interest in me; he was pivotal in my early career at UNC.
Many thanks are owed to my Singer Lab colleagues Mitch Dyrdahl, Ryan Kingsbury, and
Riley Flowers for their assistance, insights, support, and most important, for their friendship.
For their expertise and assistance, I would like to thank: Bonnie Lyon, Rory Polera, Katie
Harrold, Angela Wang, Eric Staunton, and Dr. Howard Weinberg. I am grateful to them for
their countless contributions to my project. Thanks also to water treatment facility personnel
for their help obtaining raw drinking water samples.
In recognition of the people that helped me to be where I am today, I would like to also
thank my wonderful family and friends, without the support of whom I would be lost. Thanks
are also due to those particularly instrumental in the course of my earlier education, Mike
Lindsey, Mike Williams, and Drs. Rich Scamehorn and Colleen Byron. Finally—because I
am uncertain that I would have completed my studies at UNC without him—a big thanks is
iv
TABLE OF CONTENTS
LIST OF TABLES ... viii
LIST OF FIGURES ... ix
CHAPTER 1: INTRODCTION ... 1
CHAPTER 2: BACKGROUND AND LITERATURE REVIEW ... 5
2.1. DISSOLVED ORGANIC MATTER ...5
2.1.1. Origin and Composition of DOM ...5
2.1.2. Characterization of Dissolved Organic Matter: Fundamental Techniques ...8
2.1.3. Characterization of Dissolved Organic Matter by Fluorescence Spectroscopy ... 11
2.1.4. Removal of DOM ...13
2.2. DISINFECTION OF DRINKING WATER ...16
2.2.1. Disinfection with Free Chlorine ...16
2.3. DISINFECTION BYPRODUCTS...17
2.3.1. Discovery and Overview of DBP Formation ...17
2.3.2. Health Effects ...18
2.3.3. Regulation ...18
2.3.4. DBP Science ...21
2.3.5. Precursors: Reactivity of DOM with Chlorine ...24
v
2.4.1. Occurrence of DON ...28
2.4.2. Drinking Water Treatment Implications of DON ...30
CHAPTER 3: MATERIALS AND METHODS ... 36
3.1. GENERAL APPROACH ...36
3.2. EXPERIMENTAL PROCEDURES ...37
3.2.1. Laboratory-Grade Water ...37
3.2.2. Glassware and Reagents ...38
3.2.3. Sample Collection, Handling and Care ...40
3.2.4. Preliminary Jar-Testing with Alum ...41
3.2.5. Bulk Coagulation of Raw Water ...42
3.2.6. Chlorine Demand and Chlorination under Uniform Formation Conditions ...43
3.3. ANALYTICAL METHODS ...45
3.3.1. Turbidity ...45
3.3.2. Alkalinity ...45
3.3.3. pH ...46
3.3.4. UV-Visible Absorbance ...46
3.3.5. Organic Carbon and Total Dissolved Nitrogen Analysis ...47
3.3.6. Inorganic Nitrogen ...49
3.3.7. Dissolved Organic Nitrogen ...52
3.3.8. Residual Chlorine ...52
3.3.9. Dissolved Organic Matter Characterization by XAD-8 Fractionation ...52
3.3.10. Excitation-Emission Fluorescence Spectroscopy...54
vi
3.3.12. DBP Data Validation ...61
CHAPTER 4: RESULTS AND DISCUSSION ... 63
4.1. RAW DRINKING WATER SELECTION ...63
4.2. RAW WATER CHARACTERISTICS ...65
4.2.1. Humic Content and Surrogate Parameters ...67
4.2.2. Dissolved Organic Nitrogen ...69
4.3. RESULTS OF TREATMENT BY ENHANCED COAGULATION ...75
4.3.1. Removal of DOC and UV-Absorbing Substances ...75
4.3.2. Removal of DON by Enhanced Coagulation ...78
4.4. RAW WATER DBP FORMATION ...83
4.4.1. Chloroform Formation ...85
4.4.2. N-DBP Formation ...88
4.5. MITIGATION OF DBP FORMATION BY ENHANCED COAGULATION ...99
4.5.1. Reduction in Chloroform Formation ...101
4.5.2. Mitigation of N-DBP Formation ...102
4.6. ADDITIONAL CONSIDERATIONS ...108
4.7. IMPLICATIONS ... 113
CHAPTER 5: CONCLUSIONS AND RECOMMENDATIONS ...114
5.1. CONCLUSIONS... 114
5.1.1. Additional Findings: Raw Water ... 115
5.1.2. Additional Findings: Treatment by Enhanced Coagulation ... 116
5.2. RECOMMENDATIONS ... 116
vii
APPENDIX B: SUPPLEMENTARY RAW WATER FINDINGS ... 123
viii
LIST OF TABLES
Table 2.1 Major component types in EEM spectra…...……….. 13
Table 2.2 Stage 1 D/DBP regulations for disinfectant residual, THM4, and HAA5.. 19
Table 2.3 Enhanced TOC removal requirements….………... 20
Table 2.4 Priority DBPs monitored in nationwide occurrence study………...……... 23
Table 2.5 Associations of DBPs and major chemical classes of DOM………...…… 27
Table 3.1 DBPs selected for analysis and batch calibration range………. 58
Table 3.2 Gas chromatograph condition for THM4, HANs, and TCNM …..……… 60
Table 3.3 Gas chromatograph condition for HAMs………..…..……… 61
Table 4.1 Selected raw drinking waters within the enhanced coagulation matrix….. 63
Table 4.2 Raw water characteristics………...…. 66
Table 4.3 Treated water characteristics after enhanced coagulation……….……….. 76
Table 4.4 DBP formation potential data………. 84
Table 4.5 Percent reduction of DBP surrogates and DBP formation by enhanced
ix
LIST OF FIGURES
Figure 2.1 Capabilities of DOM fractionation, characterization potential, and cost….. 10
Figure 2.2 Example EEM spectra with identified DOM fluorophores………...… 13
Figure 2.3 Toxicity of N-DBPs relative to carbon-based DBPs…...……….. 33
Figure 2.4 Toxicity of some important N-DBP classes relative to HAAs………...… 35
Figure 3.1 General experimental approach………..……..…. 37
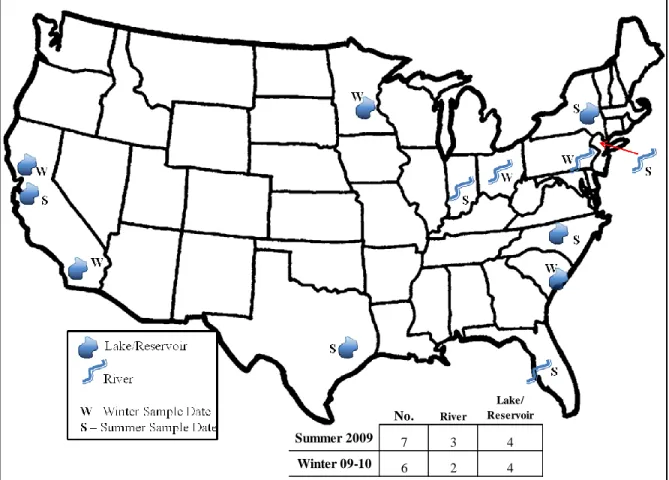
Figure 4.1 Approximate geographic location and sampling period of selected raw drinking waters…….………... 64
Figure 4.2 Relationship between humic content and specific UV absorbance………... 67
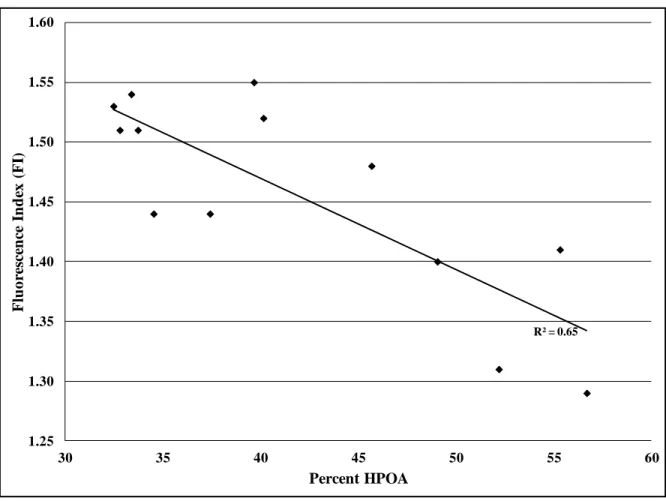
Figure 4.3 Comparison of fluorescence index and raw water humic content………... 68
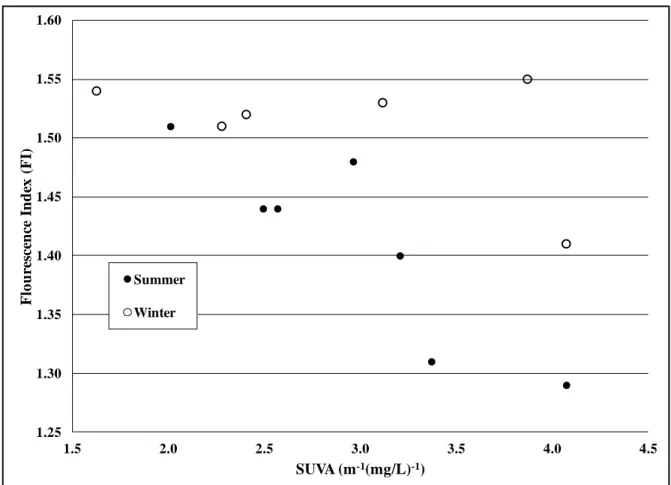
Figure 4.4 Relationship between raw water fluorescence index and specific UV absorbance……….………….... 69
Figure 4.5 Range and distribution of raw water DON concentration before and after application of DIN/TDN criterion……….……….... 71
Figure 4.6 Comparison of raw water dissolved organic carbon content and dissolved organic nitrogen content………...………. 73
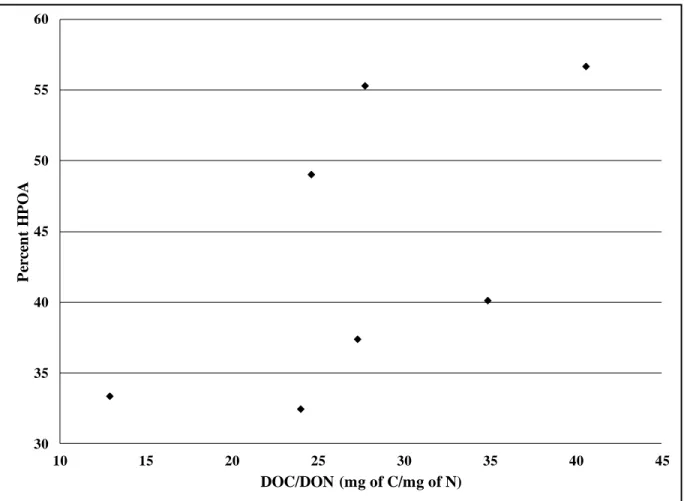
Figure 4.7 Correlation between humic content and the ratio of dissolved organic carbon to dissolved organic nitrogen….……….……... 74
Figure 4.8 Removal of UV-absorbing components of DOM relative to overall DOC removal………..………….... 77
Figure 4.9 Demonstration of improved DOC removal with increasing raw water SUVA……….... 78
Figure 4.10 Comparison of dissolved organic nitrogen removal and dissolved organic carbon removal after enhanced coagulation………..……….... 79
Figure 4.11 Comparison of raw water humic content to percent removal of dissolved organic nitrogen and raw water DON concentration…..………...… 82
x
Figure 4.13 Formation of chloroform compared to raw water dissolved organic carbon
content……….………...….… 86
Figure 4.14 Normalized chloroform formation per unit carbon relative to raw water
SUVA………...…... 87
Figure 4.15 Correlation between raw water chloroform formation and
dichloroacetonitrile formation……….... 89
Figure 4.16 Comparison of raw water dissolved organic carbon content and formation
of dichloroacetonitrile..………... 87
Figure 4.17 Formation of dichloroacetonitrile compared to raw water dissolved organic
nitrogen content……….……….………… 91
Figure 4.18 Relationship between chloroform formation and raw water formation of
dichloroacetamide ……….………. 94
Figure 4.19 Comparison of dichloroacetamide formation and dissolved organic carbon
content……….……… 95
Figure 4.20 Dichloroacetamide formation relative to dissolved organic nitrogen
content……….……...…. 96
Figure 4.21 Comparison of raw water dichloroacetamide and dichloroacetonitrile
formation………..………...… 98
Figure 4.22 Correlation between the reduction of chloroform formation potential and
the removal of UV-absorbing precursors by enhanced coagulation……... 101
Figure 4.23 Preferential mitigation of chloroform formation relative to
dichloroacetonitrile formation after enhanced coagulation….………..……. 103
Figure 4.24 Reduction of dichloroacetonitrile compared to removal of dissolved organic
nitrogen………...………...………. 105
Figure 4.25 Impact of enhanced coagulation upon formation potentials of
dichloroacetamide and chloroform……….………...……. 106
Figure 4.26 Reduction of dichloroacetamide relative to dichloroacetonitrile by
enhanced coagulation………..………...…. 108
Figure 4.27 Effect of raw water nonhumic content upon DOC removal by enhanced
xi
Figure 4.28 Relationship between nonhumic content and reduction in chloroform
formation……….……….... 110
Figure 4.29 Comparison of nonhumic content and reduction in formation of
dichloroacetonitrile……….……… 111
Figure 4.30 Correlation between nonhumic content and reduction in dichloroacetamide
formation.………...…….………...………. 112
Figure A-1 Illustrative halovolatile calibration standard chromatogram.…….……….... 119
Figure A-2 Illustrative haloacetamide calibration standard chromatogram…………..… 120
Figure A-3 Illustrative calibration curve for chloroform…..………...………. 121
Figure A-4 Illustrative calibration curve for dichloroacetonitrile……….……….... 121
Figure A-5 Illustrative calibration curve for dichloroacetamide…..…….……… 122
Figure B-1 Nonhumic DOC concentration (XAD8 effluent DOC) relative to dissolved
organic nitrogen………..………...………. 123
Figure B-2 Ratio of dissolved organic carbon to dissolved organic nitrogen compared
to specific UV absorbance……….….……….... 124
Figure B-3 Ratio of dissolved organic carbon to dissolved organic nitrogen compared
to fluorescence index………..……… 124
Figure B-4 Normalized formation of chloroform compared to raw water humic
content………. 125
Figure B-5 Normalized formation of chloroform compared to raw water fluorescence
index……….... 125
Figure B-6 Impact of humic content upon dichloroacetonitrile-to-chloroform formation
ratio………..……… 126
Figure B-7 UV254 absorbance compared to formation of dichloroacetonitrile…………. 126
Figure B-8 UV254 absorbance compared to formation of dichloroacetamide…...…….... 127
Figure C-1 Specific UV absorbance before and after treatment by enhanced
coagulation………...………… 128
xii
Figure C-3 Raw water specific UV absorbance compared to dissolved organic nitrogen
removal by enhanced coagulation…………..……….……….... 130
Figure C-4 Removal of dissolved organic carbon relative to reduction in chloroform
formation……….……… 130
Figure C-5 Impact of raw water specific UV absorbance upon reduction in chloroform
formation.………...…….………...………. 131
Figure C-6 Correlation between reduction in UV absorbance and reduction in DCAN
formation……….……….... 131
Figure C-7 Removal of dissolved organic carbon relative to reduction in DCAN
formation……….……… 132
Figure C-8 Reduction of dichloroacetamide relative to removal of dissolved organic
nitrogen………...………. 132
CHAPTER 1: INTRODCTION
Beginning in the United States in 1908, disinfection with chlorine became an increasingly
widespread practice and is credited with the control of such water-borne illnesses as typhoid
fever and cholera. This advancement is among the greatest public health achievements of the
20th century. Stemming from the landmark findings of Johannes Rook in 1974, however,
research over the past few decades has led to the realization that the chemical disinfectants
vital to generating safe drinking water also react with dissolved organic matter (DOM) and
inorganic species to produce undesirable, often deleterious compounds known as disinfection
byproducts (DBPs). It is also well understood that among the regulated organic chlorination
byproducts, there are two principal approaches for mitigation: DBP precursor removal and
the use of alternative disinfectants/disinfection practices besides chlorination. While neither
strategy precludes DBP formation entirely, the latter strategy introduces the associated
uncertain risk of both identified and yet unknown DBPs produced by these alternative
disinfectants.
Investigations into the nature of DOM and its amenability to removal comprise a
significant body of research by practitioners and water quality engineers and scientists.
Consideration for precursor removal is also among the principal policy inclusions of the
Stage 1 Disinfectants/Disinfection Byproducts Rule. Composed of differential humic and
fulvic acid content, DOM results from the decay of terrestrial and aquatic vegetative matter,
2
the 1970s, total organic carbon (TOC), hydrophobic organic acid (HPOA) content, and
ultraviolet absorbance at 254 nm (UV254) have remained among the most important surrogate
measures of DOM content. Moreover, TOC and UV254 are the most consistently utilized and
readily available parameters from which conclusions about the characteristics of DOM in
source water are possible. Among other variables, the effectiveness of aluminum and ferric
salt coagulants varies with source water pH, alkalinity, and the concentration and nature of
DOM. Research has shown that DBP precursor removal by coagulation is more effective
with high molecular weight (MW), aromatic, hydrophobic DOM while typically aliphatic,
low MW, hydrophilic DOM is less amenable to coagulation. Furthermore, waters with higher
relative alkalinity need greater coagulant doses or the addition of acid to achieve the same
TOC removal of low alkalinity waters with the same TOC content.
After the 1970 executive reorganization consolidating all federal environmental regulatory
activities into one agency, the US Public Health Service transferred drinking water regulatory
responsibilities to the newly created Environmental Protection Agency (EPA). It was not
until the creation of the Safe Drinking Water Act (SDWA) in 1974, however, that the EPA
was recognized with federal authority to regulate drinking water quality in community water
systems. Following the discovery of chloroform and other trihalomethanes (THMs) in
drinking water and the related concern of its potential health effects, 1974 also marked the
first of many epidemiological studies to implicate the consumption of chlorinated drinking
water with cancer and other health endpoints. Correspondingly, the second amendment of the
National Primary Drinking Water Regulations in 1979 was the first inclusion of DBPs in
drinking water standards. Public Law 96-63 set a maximum contaminant level (MCL) of 100
3
THM4) based on a running annual average of four quarterly samples. In the 38 years since
Rook reported the formation of chloroform and other THMs during treatment, these
byproducts have remained the principal driver and focus in DBP regulation and changes in
utility practices. This period also resulted in the identification of over 600 previously
unknown individual DBP species, the sum of which, when converted to chlorine equivalent
units, can account for between 30 and 60 percent of the total organic halide (TOX) content of
chlorinated water. This indicates that approximately 50 percent of the halide-containing
byproducts and an untold non-halogenated fraction remain unidentified.
In accordance with the SDWA, the EPA later issued multi-tiered best available
technology guidance for THM compliance in which utilities were recommended to consider:
the use of alternative or supplemental disinfectants and oxidants including chloramines,
chlorine dioxide, and ozone; changing of the point of disinfection to a location further down
the treatment train; the use of powdered activated carbon for THM and THM precursor
removal; and the combination of coagulation and clarification for precursor removal.
Subsequently, the EPA’s two-stage Disinfectants/Disinfection Byproducts Rule was
promulgated in 1998 and, while simultaneously lowering the MCL for THM4 and
establishing new standards for five haloacetic acids (HAA5), chlorite, and bromate, the
practice of enhanced coagulation for conventional surface water treatment plants also became
a formalized mandate. Enhanced coagulation is a process wherein DBP precursor removal
requirements are established according to source water TOC and alkalinity. Enhanced
coagulation proved an effective regulation for THM4 and HAA5 control and, in part,
addresses the generation of unidentified organic halides (as well as other non-halogenated
4
Enhanced coagulation is widely practiced and has served as one of the best practical
means of THM and HAA mitigation and control. However, because the preponderance of
research into the mitigation of DBPs in the last quarter century has focused on the interaction
of chlorine and organic carbon, the associated reactions between free chlorine and the
nitrogenous moiety of DOM has been largely overlooked. As a result, to date, there has been
little effort to assess the removal capacity of enhanced coagulation upon dissolved organic
nitrogen (DON) and to shed light on the formation and control of DBPs containing nitrogen.
These compounds are frequently among those “emerging” DBPs most studied and discussed
by water quality scientists and engineers, toxicologists, and industry/utility specialists
because of their greater purported toxicity relative to conventional DBPs.
In an attempt to address the perceived lack of data in the literature, the principal research
objectives of this study are to: (1) evaluate the effectiveness of enhanced coagulation for the
removal of DON in a variety of raw drinking waters across the U.S., (2) compare DON
removal and DOC removal by enhanced coagulation, (3) assess the formation potential of
selected N-DBPs among different drinking water sources before and after enhanced
coagulation, and (4) compare the formation of selected N-DBPs with the formation of
CHAPTER 2: BACKGROUND AND LITERATURE REVIEW
2.1. DISSOLVED ORGANIC MATTER 2.1.1. Origin and Composition of DOM
Dissolved organic matter is ubiquitous in surface waters and present in ground waters
under the influence of surface water. DOM is composed of heterogeneous, polyfunctional
macromolecular, polymeric, and colloidal-particulate aqueous biomass derived from the
photosynthetic activities and breakdown of terrestrial and aquatic biota, secondary inputs of
heterotrophic bacteria and fungi, products of soil dissolution and run-off (soil humus), and to
a lesser extent, anthropogenic inputs such as wastewater discharge and agricultural activities
(Thurman and Malcolm 1981, Huizhong et al. 2001, Dotson and Westerhoff 2009, Leenheer
2009). Other names in use for DOM that are frequently encountered include natural organic
material or natural organic matter (NOM); however DOM is the chosen designation
throughout this document as it refers specifically to the aqueous NOM fraction with particles
up to 1 µm in diameter (Leenheer 2009). Furthermore, it is this dissolved and colloidal
fraction of organic matter that is widely known to affect drinking water treatment. Such
impacts of DOM range from imparting color, impeding operational process performance, and
providing the substrate for reactions with disinfectants—the byproducts of which are the
topic of and motivation for this research.
The concentration, composition, and chemistry of DOM vary widely, both spatially and
temporally, in the natural environment. The dissolved and colloidal components in water
6
composition, solubility controls imparted by surface chemistry of sediment sorbents, as well
as the presence of microbiological and photolytic degradation processes (Leenheer and Croué
2003). A source water may be characterized as allochthonous or autochthonous, designations
which not only imply different sources and water quality parameters, but also drive DOM
composition. Authochthonous DOM is produced from cellular material and waste products of
macrophytes and aquatic biota, from metabolic secretions of algae and protozoa, and from
the decay of organic matter by bacteria (Crittenden et al. 2005, Leenheer 2009). Typically
pedogenic in origin, DOM in an allochthonous watershed is carried into the watercourse from
the land. Allochthonous DOM is subjected to removal processes and rigorous biological and
chemical degradative transformations during transport. Thus, allochthonous DOM is more
refractory to rapid biodegradation than autochthonous DOM (Leenheer and Croué 2003,
Leenheer 2009). The trophic status of a water (e.g. dys-, eu-, meso-, oligo-trophic) is a
further driver of DOM production and composition. For example, a eutrophic lake without
oxygen limitations would have increased rates of DOM production and degradation, while a
dystrophic lake is highly colored due to soil-derived humic DOM (Leenheer 2009, Hansen
1962).
With regard to elemental composition, on a mass basis, DOM is composed of carbon
(45-60%) and oxygen (35-40%) and, to a lesser extent, hydrogen (4-5%) and nitrogen (1-2%;
Thurman 1985, Crittenden et al. 2005). At the molecular level, DOM is comprised of a
complex mixture of aliphatic and aromatic hydrocarbon structures with functional group
attachments that include hydroxyl, amide, carboxyl, keto, and other minor functional classes
(Leenheer and Croué 2003). DOM is typically present as an array of both low and high
7
induced- and polyvalent ionic interactions to form non-uniform, polymeric-like
macromolecules (Leenheer and Croué 2003).
It is important to note that in addition to existing in complex mixtures of heterogeneous
structures and functional groups, DOM also exists in a dynamic state. Concurrent with its
precursor transport and in situ formation in a body of water, DOM also undergoes continuous
degradation. For example, abiotic and biotic aerobic processes add oxygen and generally
increase solubility with the addition of hydroxyl, carbonyl, and carboxyl groups. Conversely,
anaerobic pathways add hydrogen and decrease DOM solubility (Leenheer 2009).
Finally, having addressed origins, transformation, and DOM composition at the elemental
and molecular level, it is necessary to characterize the different moieties of DOM. While no
two waters have the exact same DOM molecular composition, there are several common
fractions that may be classified according to polarity, charge, and acid, base, or neutral
properties (Leenheer and Croué 2003). It is through these common fractions that seemingly
diverse bodies of water may be easily compared. Furthermore, the relative proportions of
such fractions influence its behavior during treatment.
The major fractions comprising DOM are dichotomized between humic and nonhumic
substances. Humic substances are defined as humic and fulvic acids and humin. Humin is not
generally significant in the water column (McKnight and Aiken 1998). Humic and fulvic
acids typically constitute about 50% of colloidal organic matter and DOM and can be as
much 75% humic in nature (Thurman 1985, McKnight and Aiken 1998, Leenheer and Croué
2003). Together, humic and fulvic acids represent the bulk of the hydrophobic fraction, of
which humic acid aggregates predominate in particulate and colloidal organic matter
8
functional groups which dissociate in the pH range encountered in natural waters. As a result,
fulvic acids are more soluble and thus more abundant in the water column than the humic
acid fraction (Thurman 1985, McKnight and Aiken 1998). The nonhumics comprise the
hydrophilic DOM and can be further subdivided into hydrophilic acids, bases, and neutrals,
and by charge.
2.1.2. Characterization of Dissolved Organic Matter: Fundamental Techniques
While there is no direct, comprehensive measure of DOM, the use of surrogate measures
and the identification of characteristic fractions are useful in describing the nature and
concentration of DOM. The most common methods for characterizing DOM are the measure
of total or dissolved organic carbon (TOC/DOC) content, UV absorbance at a wavelength of
254 nm (UV254), and quantification of its humic content. Additional forms of characterization
that have evolved over the past four decades include MW fraction analysis, fluorescence
analysis, nuclear magnetic resonance (NMR) and infrared spectrometry, and among others,
several forms of chromatography. TOC and UV254 are the most frequently measured
parameters describing DOM content and reactivity in drinking water treatment applications
(Archer and Singer 2006).
Carbon Analysis
The quantitative characterization of DOM content is achieved by organic carbon analysis
(Leenheer 2009). The total organic carbon (TOC) content of a water sample provides the
concentration of particulate-, colloidal-, and dissolved organic carbon. Dissolved organic
carbon (DOC) is operationally defined as organic carbon that passes through a 0.45 µm
diameter filter, and is thus a measure of the dissolved and colloidal organic matter fraction
9
the particulate organic carbon (POC) and remaining colloidal fraction, and typically
represents less than 10% of the overall TOC content (Leenheer and Croué 2003).
Spectrophotometric Analysis
Like carbon analysis, spectrophotometric analysis is a useful means of characterizing
DOM and can be used as both a rough indication of overall DOM concentration and its
degree of aromaticity. UV254 is the most commonly used metric, and is a useful indicator of
DOM reactivity (Leenheer and Croué 2003). Unlike TOC/DOC, however, UV analysis is
quick, easily performed, and provides quantitative information to evaluate DBP formation
potential or results of coagulation, as well as descriptive DOM measures.
DOC and UV254 can be used in combination to generate what is known as the Specific UV
absorbance (SUVA), defined as the water sample’s absorbance at 254 nm divided by its
DOC concentration (Leenheer and Croué 2003). SUVA is a useful metric relaying qualitative
information about DOM in a given water. Because studies have repeatedly shown that SUVA
can be used to estimate the chemical nature of the DOC present, it is a key means of anticipating a water’s reactivity with both coagulant and chlorine during treatment (White et
al. 1997, Edwards 1997, Vrijenhoek et al. 1998, Archer and Singer 2006). The use of
effective coagulation practices to mitigate DBP formation is central to DBP control strategies
mandated by the USEPA (see below).
DOC Fractionation
Used in conjunction with DOC analysis, DOM can be further characterized with resin
sorbents to elucidate key DOM fractions, often referred to as DOC profiling (Leenheer and
Croué 2003). DOC fractionation can be used to quantitatively articulate the humic/nonhumic
distribution in a relatively simple, one-step protocol with XAD-8 resin (Leenheer and Croué
10
a comprehensive technique first developed by Leenheer (1981), Amberlite XAD-8, XAD-2,
Bio-Rad AG MP-50, and Doulite A-7 resins are used in sequence to determine, respectively,
(1) total hydrophobic/hydrophilic fraction, (2) hydrophobic acid, bases, and neutrals, and (3)
hydrophilic acids, bases, and neutrals (Leenheer 2009). While recoveries of 90-95% have
been reported for surface waters using the single XAD-8 fractionation procedure, recoveries
in the multi-column array technique fell to 81% for the same surface water (Thurman and
Malcolm 1981, Leenheer 2009). Subsequent modifications to the protocol of Leenheer
(1981) over the last two decades, however, have improved DOM fractionation/isolation
techniques such that quantitative recovery is now possible (Leenheer and Croué 2003).
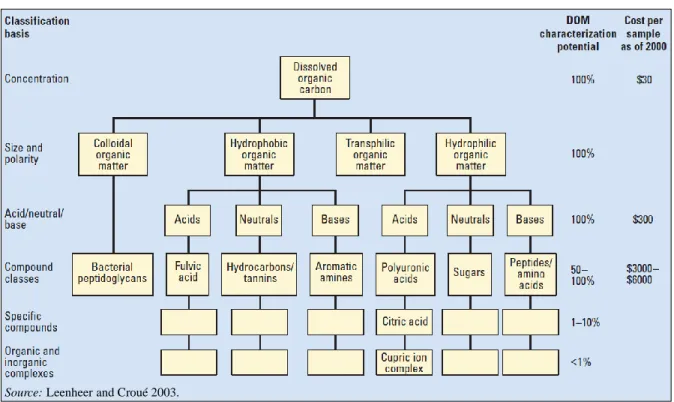
Figure 2.1 identifies the key fractions identified by analysis, the characterization potential,
and the associated costs of such DOM characterizations.
Source: Leenheer and Croué 2003.
11
2.1.3. Characterization of Dissolved Organic Matter by Fluorescence Spectroscopy Like chromophores that exist as a result of energy absorbed by molecular constituents of
DOM, there are fluorescent fractions within DOM that both absorb and re-emit light energy,
known as fluorophores (Hudson et al. 2007). Because the wavelength at which light is
absorbed (excitation) and subsequently emitted is specific to the molecule, fluorescence may
be used to characterize DOM. The advantage fluorescence offers over other forms of
compositional DOM characterization is that it requires minimal sample pretreatment, uses a
small sample volume, and is rapid and non-destructive (Hudson et al. 2007). Like other
methods of DOM characterization, the specific form of fluorescence spectroscopy and data
generated vary according to the study objectives and the intended end use of the data. Two
such forms include measures of the fluorescence index (FI) and excitation emission matrix
fluorescence spectroscopy (EEMS).
Fluorescence Index
The fluorescence index (FI), defined as the ratio of emission intensities at an excitation
wavelength of 370 nm, has received widespread attention as a measure capable of indicating
the origin of DOM as higher-plant or microbially-derived DOM (Cory and McKnight 2005).
Furthermore, FI has been shown to be strongly correlated with SUVA (Jaffe et al. 2008). To
a lesser extent, Jaffe and colleagues (2008) also showed correlation between FI and the
DOC-total nitrogen (TN) ratio. Both of these relationships were anchored by the
microbially-derived DOM region with characteristic properties of low SUVA-high FI and low C:N-high
FI, respectively.
One concern with respect to FI is that it is sometimes difficult to compare FI values
among different waters due to the lack of uniform definition and criteria associated with the
12
450 and 500 nm and 470 and 520 nm, with an excitation wavelength of 370 nm. In an
interesting study in which FI was well correlated (R2 > 0.95) with the formation of several
THM, HAN, and HAA species upon chlorination, Roccaro and colleagues (2008) used the
former emission intensity pair, but an excitation wavelength of 320 nm was used. In addition,
the method by which FI values are obtained is also not consistent in the literature. In some
cases, FI is obtained from a direct scan, and in others, from the corrected EEM spectra of a
sample. Furthermore, samples are diluted to avoid inner-filter effects in some cases, while in
others, inner-filter corrections are applied. The concentration of DOM resulting in inner-filter
interference is also not resolved in the literature (Hudson et. al. 2007).
Excitation Emission Matrix Fluorescence Spectroscopy
With its first application in aquatic studies beginning in the mid-1990s, excitation
emission matrix fluorescence spectroscopy (EEMS) is regarded as the state-of-the-art
technique for DOM characterization and is fast becoming the standard for DOM fluorescence
analysis (Hudson et al. 2007). Detailed information can be generated by synchronously
scanning excitation, emission, and fluorescence intensity over a range of wavelengths,
obtaining a three-dimensional spectral plot. This plot is a map of optical space known as an
excitation emission matrix (EEM) or EEM spectrum (Hudson et al. 2007, Leenheer 2009).
Using EEMS, one may identify both the source of DOM (terrestrial/aquatic origin) and its
fractional composition by the distinctive, characteristic matrix generated (Leenheer 2009).
Table 2.1 identifies the characteristic fingerprint regions of humic and amino acid
fluorophores common to DOM. Furthermore, Figure 2.2 demonstrates an example EEM
spectrum in which Hudson and colleagues (2007) have identified key features and
13
Table 2.1: Major component types in EEM spectra
Source: Leenheer 2009.
An EEM may be further analyzed to quantitatively characterize the components within a bulk
DOM sample. As Hudson and colleagues (2007) note, such means of analysis include
fluorescence excitation-emission regional integration (FRI) or parallel factor analysis
(PARAFAC).
2.1.4. Removal of DOM
Dissolved and colloidal organic matter interferes with several unit processes of drinking
water treatment, impairs aesthetic quality of finished water, and most notably, DOM is the
principal organic precursor of byproducts formed during disinfection. DOM can also bind
with metal and synthetic organic chemicals, enabling the transport of these constituents
through water treatment processes not optimally designed to remove DOM. Once in the A Hydrophobic acid fraction Humic-like C Humic-like B Hydrophobic neutral fraction Protein-like/
Tyrosine-like T Hydrophobic base fraction Protein-like/
Hydrophillic acid fraction Tryptophan-like Hydrophillic neutral fraction
Peak Fluorophore Fluorophore name type
14
distribution system, residual DOM can also serve as a nutrient source facilitating bacterial
re-growth (EPA 1999b). Hence, the removal of DOM is among critical aims of WTPs and is the
focus of an extensive body of research.
The processes commonly in use today for DOM removal include
coagulation/flocculation/clarification, membrane filtration, granular activated carbon
adsorption, precipitative softening, and ion exchange. Advanced oxidation processes, often
used in combination with other unit processes (e.g. biological filtration), are also being
applied for DOM removal. The processes regarded by the USEPA as capable of achieving
greater than 40% DBP precursor removal are: coagulation/flocculation/clarification in
combination with filtration, particularly at slightly acidic pH; precipitative softening,
particularly at high pH; GAC adsorption; and nanofiltration membrane processes (EPA
1999b).
Coagulation
Raw surface water contains inorganic and organic particulates, including clay, silt,
mineral oxides, viruses, bacteria, algae, protozoan cysts and oocysts, as well as dissolved
inorganic and organic matter. Particles may consist of and harbor pathogenic
microorganisms, concentrate harmful organic compounds and trace metals, and reduce
clarity, while DOM imparts undesirable taste and color, increases disinfectant demand and is
a DBP precursor. The principal objective of coagulation is to aggregate particles and DOM
so that they can be removed by downstream clarification and filtration processes. The type
and dosage of coagulant is largely dependent upon a variety of water quality characteristics
including temperature, pH, alkalinity, concentration and type of particulates, and
15
more of the above parameters throughout the day, and often conduct jar tests on a regular
basis to determine optimal coagulation conditions.
Coagulation generally utilizes either ferric salts or aluminum sulfate (Al2(SO4)3), also
referred to as alum. Alum is the most widely used coagulant for water treatment in the United
States (Crittenden et al. 2005). The addition of either coagulant to water results in dissolution
followed by hydration of the trivalent metal ion to form charged aquometal complexes. The
aquometal complexes then pass through a series of hydrolytic reactions to form a variety of
mono- and polynuclear species that are all capable of interacting with particles and DOM.
Aquatic particles and DOM are predominantly negatively charged at neutral pH ranges.
Thus, particles and DOM interact with the positively charged aquometal complexes and are
destabilized.
Specific Considerations for DOM Removal by Coagulation
The fundamental drivers of DOM removal efficiency are coagulant type and dosage, pH,
and the concentration and nature of the colloidal and dissolved organic material. As it relates
to pH, the alkalinity of a water is also an important consideration. Removal of DOM by a
metal salt coagulant occurs by one of two general mechanisms: (1) adsorption onto the metal
hydroxide (Al(OH)3 or Fe(OH)3) floc and (2) the formation of insoluble metal-DOM
complexes (aluminum or iron humates and fulvates), analogous to charge neutralization
(Krasner and Amy 1995, Archer and Singer 2006). The charge density of humic and fulvic
acid DOM components is reduced at lower pH and thus renders the humic fraction more
hydrophobic and adsorbable. Correspondingly, the first mechanism is more dominant at high
coagulant dosages and higher pH while the reverse is true for the second mechanism
16
The outcome of DOM-coagulant interaction is largely driven by the humic/nonhumic
distribution of DOM. Indeed, Collins and colleagues (1986) demonstrated that higher MW
DOM fractions are more amenable to removal by coagulation while fractions with the
highest carboxylic acidity (highest charge density) are more difficult to remove. Reckhow
and Singer (1990) noted coagulation results in preferential reduction of UV-absorbing
components of DOM compared to removal of overall TOC, indicative of a greater relative
decrease in aromatic content. Cumulatively, this evidence indicates coagulation preferentially
removes the hydrophobic content with a greater extent of removal for the humic acid fraction
than the fulvic acid fraction. Thus, waters with a dominance of nonhumic and/or low MW
DOM are resistant to coagulation as a means of DOM removal.
2.2. DISINFECTION OF DRINKING WATER
Primary disinfection is a process of inactivation of microorganisms within the treatment
plant, while secondary disinfection is the maintenance of a disinfectant residual in treated
water during storage and throughout the distribution system. The five most common
disinfectants today are free chlorine, combined chlorine (often referred to as chloramines),
ozone, chlorine dioxide, and UV light (Crittenden et al. 2005).
2.2.1. Disinfection with Free Chlorine
The application of free chlorine remains the most dominant form of primary disinfection
in the US. It is most commonly applied as chlorine gas, although liquid sodium hypochlorite,
solid calcium hypochlorite, and other forms are still used.
Chemistry of Chlorine in Water
Hypochlorite and molecular chlorine become hypochlorous acid (HOCl) after being
17
hypochlorite (OCl-), a weak disinfectant, and the strong disinfectant HOCl in accordance
with Equation 2.3.
(2.1)
(2.2)
(2.3)
Free chlorine leaves a stable residual that can either be maintained in the distribution network
or be converted to chloramines with the use of ammonia. The use of monochloramine has
gained popularity as a means of trihalomethane (THM) control, discussed further in
following sections.
2.3. DISINFECTION BYPRODUCTS
2.3.1. Discovery and Overview of DBP Formation
Rook (1974) published landmark findings in Holland that chlorine was reacting with
DOM during treatment to form chloroform (CHCl3) and other THMs. The results were
independently confirmed in the U.S. in the findings of Bellar et al. (1974) and Symons
(1975). Stemming from the work of Rook, DOM was recognized as capable of reaction with
chlorine and, later, with other disinfectants/oxidants as well, to form a variety of DBPs. The
dominant organic chlorination DBPs are THMs and haloacetic acids (HAAs).
At a fundamental level, chlorine reacts with DOM during treatment to generate DBPs, as
shown in the following general equation modified from Singer (1993):
h h (2.4)
When bromide is present in a water source, it is rapidly oxidized to form hypobromous acid
(HOBr), which in turn reacts with DOM. When this occurs, the products of formation in
Equation 2.4 are represented by a greater abundance of mono-, di-, and
18
formation. Iodide was later found to similarly influence THM and HAA speciation (Hua et
al. 2006).
2.3.2. Health Effects
With regard to the regulated organic halides, all four THMs have been shown to be
carcinogenic in animal studies, most are cytotoxic, and brominated THMs have been
demonstrated to be mutagenic in studies where activation by glutathione
S-transferase-theta—a common mammalian cell enzyme—was included. In general, HAAs have
demonstrated evidence of cytotoxicity and genotoxicity, with the bromo-analogues being
more strongly cyto- and genotoxic compared to chlorine-containing HAAs. Three of the
HAA5 have shown to be positive for carcinogenicity in animal studies (Richardson et al.
2007).
2.3.3. Regulation
In 1979 the USEPA promulgated the first DBP Rule establishing a maximum contaminant
level (MCL) of 100 μg/L for total trihalomethanes (THM4) for utilities serving greater than
10,000 people (EPA 1979). The regulation was based on a running annual average (RAA) of
four quarterly samples taken system-wide. This rule was based on epidemiological studies
that showed a slightly increased risk of bladder, colon, and rectal cancer from long-term
exposure to chlorinated drinking water. This was an interim rule and was to be re-evaluated
after more data on DBPs and health effects were collected.
Stage 1 Disinfectants and Disinfection Byproducts Rule
A comprehensive DBP policy tool came into existence in the form of the EPA’s two-stage
Disinfectants/Disinfection Byproducts (D/DBP) Rule. The 1998 Stage 1 D/DBP Rule
simultaneously lowered the MCL for THM4 to 80 µg/L and established new standards for
19
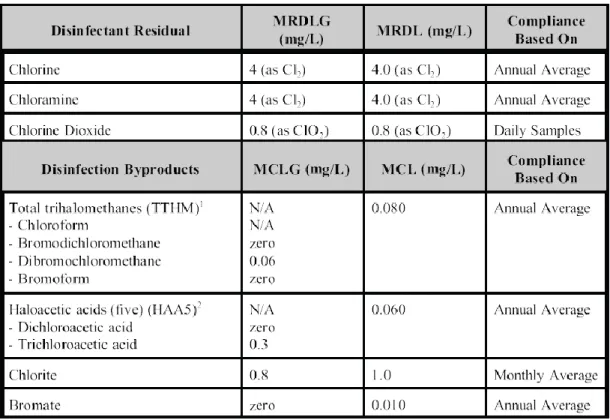
The rule also established Maximum Contaminant Level Goals (MCLGs) for some of the
DBPs and Maximum Residual Disinfectant Limits (MRDLs) and Maximum Residual
Disinfectant Goals (MRDLGs) for applicable disinfectants (EPA 2001b). The limits and
goals established by the rule are shown in Table 2.2.
To address DBP precursor removal, the Rule also required the practice of enhanced
coagulation for conventional treatment plants using surface water or ground water under the
influence of surface water (EPA 2001b).* The clarification process combination of
coagulation, flocculation, sedimentation, and granular filtration was traditionally used to
From Table 2.2:
*THM4 is the same trihalomethane designation as TTHM which the EPA and many in the industry use but is inaccurate as more trihalomethanes (e.g. iodine-containing THM species) have been discovered.
N/A Not applicable because there are no individual MCLGs for TTHMs or HAA5.
1 Total Trihalomethanes (THM4) is the sum of the concentrations of chloroform, bromodichloromethane, dibromochloromethane, and bromoform
2 Haloacetic acids (five) is the sum of the concentrations of mono-, di-, and trichloroacetic acids and mono-, and dibromoacetic acids (EPA 2001b). The table only shows two species.
Table 2.2: Stage 1 D/DBP regulations for disinfectant residual, THM4*, and HAA5
20
remove suspended particles. The term “enhanced coagulation” references the alteration of
this process to achieve greater DOM removal, typically achieved by high dosages of metal
salt coagulant and/or pH adjustment of source water (White et al. 1997, Vrijenhoek et al.
1998). Enhanced coagulation specifies DBP precursor removal requirements according to
source water TOC and alkalinity in a 3x3 matrix, as shown in Table 2.3. Because coagulation
is more effective at slightly acidic pH values, alkalinity is an important influence upon the
process of coagulation, as noted in §2.1.4. The supplementary addition of acid to achieve a
more effective coagulation pH carries with it economic burdens that may be too great for
many utilities. Such considerations are reflected by the inclusion of alkalinity to the enhanced
coagulation matrix, in which high alkalinity waters are allowed to achieve less TOC removal
(Archer and Singer 2006). Enhanced coagulation has proved effective for mitigating THM
formation at many conventional WTPs. Furthermore, by mandating a set TOC removal
requirement, the EPA had also partly addressed unidentified organic halides (and presumably
others not containing halides) of potential public health concern.
Stage 2 Disinfectants and Disinfection Byproducts Rule
The Stage 2 D/DBP Rule added no new compounds and made no changes to MCLs or
MCLGs. However, it addressed concerns that the public was not adequately protected by the
manner in which HAAs and THMs were monitored and reported with a system-wide running
Table 2.3: Enhanced Coagulation TOC Removal Requirements
21
annual average (RAA). While DBP mitigation at the WTP remains the most critical element
of limiting DBP formation, it had long been argued that elevated exposure to DBPs could
still be taking place, especially in far reaches of the distribution system. The system-wide
RAA inaccurately reflects exposure for the entire distribution system when known variations
in water age and other characteristics are considered. To generate more equitable public
health protection, the Stage 2 D/DBP Rule requires utilities to perform an evaluation of the
distribution system to identify locations with high DBP concentrations to be used in
subsequent compliance monitoring. The MCLs thus would be calculated for each monitoring
location, generating not a system-wide RAA but a locational running annual average (LRAA,
EPA 2005b).
2.3.4. DBP Science
Occurrence of DBPs in US Drinking Waters
In addition to the presently regulated DBPs, the Information Collection Rule (ICR)
marked an important benchmark as an industry-wide study of the occurrence of several
DBPs, many of which had not been included in previous occurrence studies. DBPs monitored
in the ICR survey, in addition to the THMs and HAAs, included four haloacetonitriles
(HANs), two haloketones, trichloronitromethane (chloropicrin), trichloroacetaldehyde
(chloral hydrate), cyanogen chloride, and 12 aldehydes (Krasner et. al 2006). Among the
principal findings of the ICR, it was found that, on average, THM4 and HAA5 accounted for
about 60% of the measured total organic halide (TOX) concentration among surface water
facilities. The other organic halides (HANs, haloketones, chloral hydrate, and chloropicrin)
accounted for about 7% (EPA 2005a). This disparity between TOX and the organic halide
content of the measured DBPs indicated that a third of the halogenated DBPs formed were as
22
Following the ICR, the EPA’s Office of Water initiated an effort to prioritize the greater
than 500 DBPs reported in the literature on the basis of predicted adverse health impacts.
This prioritization brought together a multidisciplinary panel of experts from the Office of Water and the Office of Prevention, Pesticides, and Toxics Substances to conduct an
“in-depth mechanism-based, structural activity relationship analysis, supplemented by an
extensive literature search for genotoxicity and other data […] to rank the carcinogenic potential of these DBPs” (Weinberg and Krasner 2002). Accordingly, additional occurrence
studies have been performed over the last decade targeting the high priority DBPs identified
in the EPA analysis, DBPs shown to occur at bench scale or in limited full-scale surveys,
select DBPs resulting from alternative disinfectants, as well as the conventional and
regulated DBPs. Table 2.4 identifies many of the high priority and other DBPs that were
included in nationwide occurrence studies by Weinberg and Krasner (2002) and Krasner et
23
The results of these studies indicate that, in addition to the conventional DBPs, the high
priority DBPs can and do occur in WTPs across the nation. Additionally, Weinberg and
Krasner (2002) found several of these new DBPs at levels higher than previously
encountered. New bromo- and iodo-analogues of both conventional DBPs as well as
emerging DBPs of concern were identified, including bromonitromethanes, brominated
Table 2.4: Priority DBPs monitored in nationwide occurrence study
24
furanones, and iodo-THMs and iodoacids (Weinberg and Krasner 2002, Krasner et al. 2006).
The studies also disproved the widely accepted hypothesis that mitigation of THM4 or
HAA5 with alternative disinfectants would in turn be effective for controlling other
potentially harmful, halogenated DBPs.
2.3.5. Precursors: Reactivity of DOM with Chlorine
The water quality parameters known to influence chlorination by-product formation
include temperature, pH, bromide and iodide concentration, and the concentration and nature
of DOM. Disinfection by-product formation potential (DBPFP) is favored with increasing
temperature and DOM concentration (Archer and Singer 2006). In the analysis of DOM
surrogate parameters, Najm et al. (1994) showed THM4 and HAA5 formation increased with
both TOC and UV254, with better correlation obtained for UV than TOC for both species.
TOX formation potential (TOXFP), which encompasses the entire halogenated DBP content,
was shown to increase with increasing SUVA (Archer and Singer 2006). These observations
indicate that DBPFP is strongly influenced by the degree of aromaticity of DOM.
The formation and speciation of DBPs is further influenced by the different structural
components and functional groups within DOM and, at its most basic level, the
humic/nonhumic distribution of DOM. In general, research has shown that upon chlorination,
the hydrophobic acid fraction of DOM results in greater formation of THM4 and HAA9 than
the trans- and hydrophilic acid (collectively referred to as nonhumic) fractions (Liang and
Singer 2003). The impact of the hydrophilic acid fractions, however, is not negligible.
Collins et al. (1986) noted that utilities along the Colorado River had difficulty reducing
THM4 formation despite efforts to improve coagulation and clarification. Further analysis
indicated that this was due to the relative abundance of hydrophilic DOM in this source
25
potential (Collins et al. 1986). Furthermore, research indicates that there is preferential
formation of THMs over HAAs as the pH and the hydrophilic fraction increase (Liang and
Singer 2003).
In the chlorination of operationally defined precursor isolates differentiated by both
hydrophobicity and MW, Hua and Reckhow (2007) found that MW distribution by itself
provided no significant trends compared to DBPFP. Their study suggested a general trend in
THM and HAA formation potential is evident for fractions separated by hydrophobicity and,
further, that hydrophobic and high MW DOM is the major precursor fraction in the formation
of unknown TOX. Additionally, hydrophilic and low MW DOM was shown to play a
significant role in the formation di-halo acetic acids and THMs. This fraction also appears to
be highly reactive with bromine and iodine (Hua and Reckhow 2007).
In a more specific analysis of the DBPFP of DOM surrogates at the compound level,
Bond and colleagues (2009) exposed 21 different classes of precursors to excess chlorine.
Represented compounds included phenolic, carboxylic acid, carbohydrate, amino acid,
amide, and furan structures ranging from MW 1701 (tannic acid) to MW 60 (acetic acid).
The compounds also represented the spectrum of operationally defined fractions based upon
relative hydrophobicity in which some compounds represented more than one fraction. The
results of this analysis largely confirmed that while DOM surrogate compounds may have
similar physical properties, the action of compound-specific DBP formation varies widely.
Indeed, kinetic and mechanistic studies of organic matter oxidation and halogenation have
shown functional class to be a strong driver of reaction pathway (Deborde and von Gunten
26
In the analysis by Bond et al. (2009), chlorine substitution was the only
compound-specific parameter with a strong correlation to DBPFP. While they did find correlations
among the formation of different DBP classes, the authors found no apparent link between
chlorine demand and DBPFP. This suggests that oxidation reactions, rather than chlorine
addition/substitution (halogenations), are the dominant pathway in chlorine consumption,
which has been proposed by other researchers under different reaction conditions (e.g. Zhang
and Minear 2006). In contrast, study of the chlorine incorporation into fulvic acid reported by
Reckhow and Singer (1990) indicated halogenation to be the dominant pathway, with
25-29% Cl2 incorporation over a 72-hour contact time. This observation is likely different than
those of Bond et al. (2009) and Zhang and Minear (2006) due to different contact times, poor
representation of the selected compounds as surrogates of bulk fulvic acid, and/or low
Cl2/DOC ratios of chlorination conditions.
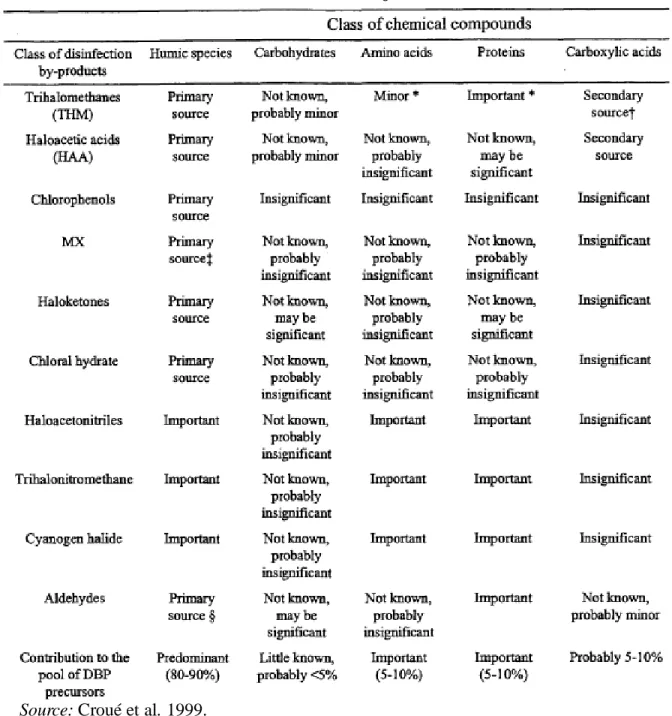
As noted throughout this document, THMs and HAAs represent a fraction of the myriad
of identified and unidentified DBPs formed during chlorination. Table 2.5 shows the
association between compound classes and formation of DBPs beyond that of regulated
27
It should be noted that, in the face of DOM heterogeneity, variable treatment techniques, and
other water quality influences, the inclusion of the greater than 600 individual DBP species Table 2.5: Associations of DBPs and Major chemical classes of DOM
28
identified poses a daunting challenge to the water quality field. The use of DOM surrogates,
DBP reference compounds, TOX, and targeted analysis of those DBPs deemed to be of
highest priority serves as a means of navigating this challenge. Furthermore, humic
substances are among the best studied component of DOM and have proven to be the
predominant fraction of DBPs precursors in countless analyses. However, the more recent
realization that N-DBPs are among the most toxic DBPs, has led some researchers to suggest
that an important precursor moiety has been overlooked.
2.4. DISSOLVED ORGANIC NITROGEN
The preponderance of research into the mitigation of DBPs in the last quarter century has
focused on the interaction of chlorine and dissolved organic carbon, while the associated
reactions between free chlorine and the nitrogenous moiety of DOM have been largely
overlooked. N-DBPs have been found to be more geno- and cytotoxic than currently
regulated DBPs (Muellner et al. 2007, Plewa et al. 2008). Furthermore, while nitrogen fate
and occurrence has been studied in the natural environment for several decades, its behavior
in drinking water treatment contexts is poorly characterized. As a result, there has been little
effort, to date, to assess the removal capacity of enhanced coagulation for dissolved organic
nitrogen (DON) or as a means of N-DBP control.
2.4.1. Occurrence of DON
On a mass ratio, nitrogen comprises 0.5 to 10% of DOM. Total dissolved nitrogen (TDN) includes organic and inorganic forms of nitrogen, and in pristine watersheds, DON is often
the dominant form of TDN. Due to agricultural runoff and other human impacts, DON
represents only a fraction of the TDN in many waters (Westerhoff and Mash 2002). Concerns
about elevated levels of both inorganic and organic nitrogen have arisen due to growing
29
of which can constitute sizeable contributions to downstream drinking water sources (Dotson
and Westerhoff 2009). Analysis of US Geological Survey data show a median DON
concentration of 0.37 mg/L and, in a sampling campaign of 28 WTPs, raw water average
DON concentration was 0.19 mg/L (Lee and Westerhoff 2006).
The ratio of DOC to DON has been used as a parameter for characterizing DOM and is
purported to be an important indicator of the source of the DOM. Autochthonous DOM
sources are associated with low DOC/DON ratios, whereas higher ratios are representative of
allochthonous DOM sources (Westerhoff and Mash 2002). Linkages between FI and
DOC/TN (total nitrogen) ratios have been reported (Jaffé et al. 2008) and are relevant in
many waters not impacted by human activity. Both DON and DOC/DON have been
correlated with different peak intensities of EEMs and, overall, in a 28-utility survey, EEMs
were better correlated with DON content than proposed UV/Vis spectroscopy measures (Lee
et al. 2006). SUVA, which is in general a more robust DOM surrogate, has been shown to
decrease with decreasing DOC/DON ratios (Westerhoff and Mash 2002).
Each fraction of DOM discussed earlier in this chapter has a characteristic DOC/DON
ratio and, thus, the relative abundance of one fraction or another in a water source can have
pronounced influences upon the overall DON content. In general, neutral and base DOM
fractions tend to be rich relative to hydrophobic acid fractions which are
nitrogen-poor. Polar acid (hydrophilic) fractions as well as colloidal organic matter also tend to be
nitrogen enriched. At the compound class level, amino acids are thought to comprise as much
as 35% of DON (Thurman 1985). These constituents are present in effluents from wastewater
treatment facilities and as soluble microbial products (SMPs) from aquatic biota. Amino
30
DOM molecules (Westerhoff and Mash 2002). SMPs also contain low MW and
macromolecular sources of DON. Furthermore, positive correlations are observable between
DON and algal productivity, with high algal populations in eutrophic lakes resulting in
0.7-1.2 mg/L DON (Westerhoff and Mash 2002).
2.4.2. Drinking Water Treatment Implications of DON
Removal by Coagulation
Studies of DOM coagulation have traditionally focused upon removal of UV254,
DOC/TOC, and operationally defined fractions of DOM, while characterization of DON
removal by coagulation has only recently received attention. The greatest fractions of DOM
removed by coagulation are hydrophobic organic acids which generally contain little DON.
More polar acidic fractions, however, are nitrogen enriched and are removed with similar
efficiency as the hydrophobic fractions (Westerhoff and Mash 2002). Colloidal organic
matter also typically contains appreciable amounts of DON and is readily removed during
coagulation. However, in general, the predominant DON fractions, i.e. the bases and neutrals,
are poorly removed by coagulation (Westerhoff and Mash 2002).
Results of a full-scale WTP survey of DON removal by Lee and colleagues (2006)
showed that 20% of DON was removed during coagulation, compared to 29% removal of
DOC. Utilities that employed coagulant aids achieved 23% removal of DON, compared to
9% DON removal for those that used metal-salt coagulant alone (Lee et al. 2006). In a
follow-up jar test study to further investigate the role of cationic polymer coagulant aids,
better removal was confirmed with use of a coagulant aid (Lee and Westerhoff 2006).
Fractional analysis by MW has shown that the distribution of DON is comparable to that
of DOC and that both DON and DOC are poorly removed in the <1000 dalton size range
31
DON removal were quite comparable among 16 WTPs sampled during summer months.
Total amino acid (AA) removal exceeded the removal of free AAs, 65.2% and 25.4%,
respectively, and coagulation was shown to be the most significant unit process for removal
of total AAs (Dotson and Westerhoff 2009). AAs accounted for 15% of DON on average in
their study, but have been reported to be as high as 35% of DON in lakes, and 20% to >75%
during run-off events in different soil types (Dotson and Westerhoff 2009). No studies were
found to have investigated DON removal specifically in the context of enhanced coagulation.
Disinfection and N-DBP formation
With respect to chlorination and DBP formation, DON, and specifically AAs, have been
shown to exert a chlorine demand and result in the undesirable formation of organic
chloramines. Organic chloramines pose challenges to accurate residual measurement and are
poor drinking water disinfectants (Westerhoff and Mash 2009). In the chlorination and
chloramination of DOM isolates characterized by DOC/DON, dichlororacetonile (DCAN),
chloropicrin, and N-nitrosodimethylamine (NDMA) were formed, although NDMA was not
detectable in chlorinated samples (Lee et al. 2007). Although correlations were not
particularly strong, N-DBP formation generally decreased with increasing DOC/DON ratio
and DCAN was formed at the highest levels.
The results reported in the latter investigation were somewhat surprising. While DCAN
was most abundant during both chlorination and chloramination, chloramination resulted in
DCAN levels five times as great compared to free chlorine (Lee et al. 2007). The authors
suggested that inorganic nitrogen from monochloramine may result in elevated DCAN
formation; this in line with one of two formation pathways thought to control DCAN
formation, both of which are proposed to operate simultaneously during chloramination