M B A P R O G R A M AT U M D
A S S E S S M E N T R E P O R T
D E C E M B E R
2 0 1 4
1
Labovitz School of Business & Economics MBA Program
ASSURANCE OF LEARNING
Curricula Development
Faculty-‐driven standing committees are responsible for curriculum development and management, as well as assurance of learning. Curricular modifications are initiated and approved by the faculty in their respective departments before reaching the Graduate Committee. This committee also oversees all assessment activities in the School. Major curricular changes are reviewed by the school-‐wide Senate. Assessment results are reviewed by the Assessment Committee.
The MBA program is offered both in Duluth and in Rochester, Minnesota. All classes are face-‐to-‐face with a few rare elective exceptions. Classes in Duluth are offered in the evening and in Rochester over Friday-‐Saturday sessions. Assessment is conducted for the program as a whole while ensuring that learning outcomes in Duluth and Rochester groups are assessed over any five year period.
A new, fully-‐online Certificate in Business Administration program was started in Fall 2013 to address the needs of prospective MBA students who did not have the required foundational courses in business necessary for admission into our program.
This document summarizes the graduate program assessment conducted within the school over the past five years. Curricular changes resulting from our Assurance of Learning (AoL) processes are also discussed in the following sections.
Assessment Tools and Procedures
MBA Program Learning Goals
The overall goal of the School’s MBA Program is to prepare students to be business leaders. The MBA learning goals were also revised in Fall 2010 to respond to feedback received during our last
reaccreditation visit. The Team felt that the previous goals were overly complex; that made assessment challenging. The revised goals of the MBA Program focused on four elements: communication skills, quantitative skills, knowledge of core areas of business, and ability to integrate and apply knowledge. The full description of the MBA learning goals is provided in Appendix A1.
MBA Assessment: Processes and Procedures
The Graduate Committee decided to conduct assessment either through course-‐embedded measures or through a standardized test or survey (MFT or EBI). For course-‐embedded assessment, faculty members teaching the assessed courses, with the assistance of the Graduate Committee, developed the
instruments. Typically, assessment is conducted in designated courses when the courses are offered. In a couple instances, the scheduled assessment could not take place because the instructor did not utilize the designated case study for assessment. MFT tests are administered to all graduating students every spring. The EBI survey is conducted every other year, in the Spring semester. The following table summarizes the assessment calendar for the MBA programs:
2
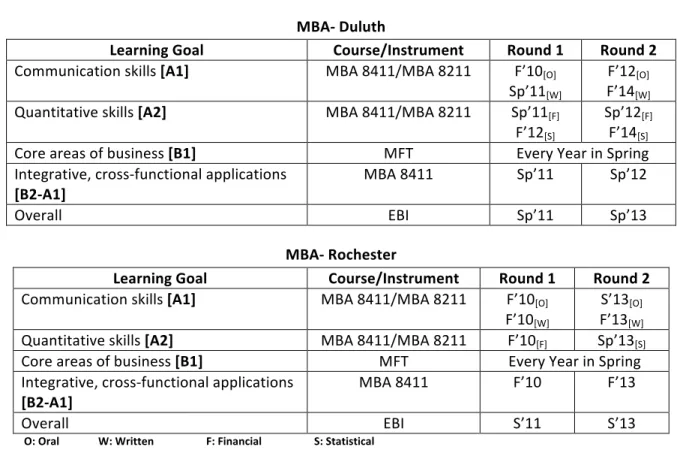
Table 1. MBA AoL Timetable
MBA-‐ Duluth
Learning Goal Course/Instrument Round 1 Round 2
Communication skills [A1] MBA 8411/MBA 8211 F’10[O]
Sp’11[W]
F’12[O]
F’14[W]
Quantitative skills [A2] MBA 8411/MBA 8211 Sp’11[F]
F’12[S]
Sp’12[F]
F’14[S]
Core areas of business [B1] MFT Every Year in Spring Integrative, cross-‐functional applications
[B2-‐A1] MBA 8411 Sp’11 Sp’12
Overall EBI Sp’11 Sp’13
MBA-‐ Rochester
Learning Goal Course/Instrument Round 1 Round 2
Communication skills [A1] MBA 8411/MBA 8211 F’10[O]
F’10[W]
S’13[O]
F’13[W]
Quantitative skills [A2] MBA 8411/MBA 8211 F’10[F] Sp’13[S]
Core areas of business [B1] MFT Every Year in Spring Integrative, cross-‐functional applications
[B2-‐A1] MBA 8411 F’10 F’13
Overall EBI S’11 S’13
O: Oral W: Written F: Financial S: Statistical
In Spring 2014, LSBE started holding a school-‐wide AoL retreat, where a summary of all the assessment reports were shared with the faculty.
Graduate Assessment: Outcomes
The detailed summaries of assessment for each of the goals are presented in Appendix A2. A brief overview of assessment outcomes is outlined below. We first report a summary of the course-‐ embedded assessments, followed by a discussion of MFT and EBI results.
Goal: Communication Skills (Written)
Assessment Tool Course
Open-‐ended assignment, based on a case study 1-‐5 scale, 3= acceptable (F’10, S’11)
1-‐3 scale, 2= acceptable (Sum’13)
MBA 8411 Business Policy
Assessment Results
Fall 2010 (Rochester) Spring 2011 (Duluth) Summer 2013 (Rochester)
Overall Score = 3.8 Organization = 4.3
Grammar and Structure = 3.7 Spelling & Word Choice = 3.6 References and citations = 3.5
Overall Score = 4.3 Organization = 3.8
Grammar and Structure = 4.8 Spelling & Word Choice = 4.0 References and Citations = 4.6
Overall Score = 2.35 (new scale) Organization = 2.4
Idea Development = 1.8 Idea Support = 2.4
Grammar, Spelling, Syntax = 2.8
3
Goal: Communication Skills (Oral)
Assessment Tool Course
Review of a video recording of a presentation 1-‐5 scale, 3= average/neutral
Changed to 1-‐4 scale for Spring 2013, 2 = acceptable
MBA 8211 Data Analysis & Statistics
Assessment Results
Fall 2009 (R) Fall 2010 (D) Summer 2011(R) Fall 2012 (D) Spring 2013 (R)
Overall: 17/27 >= 3.0
Average Score: 3.04 Overall: 14/18 >= 3.0 Average score: 2.93 Overall: 6/8 >= 3.0 Average Score: 3.31 Overall: 5/7 >= 3.0 Average Score: 2.79
Overall: 20/24>=2.0 Avg: 2.18/4.0
Goal: Quantitative Skills (Financial)
Assessment Tool Course
Open-‐ended assignment, based on a case study
1-‐5 scale, 3= acceptable MBA 8411 Business Policy
Assessment Results
Fall 2010 (Rochester) Spring 2011 (Duluth) Spring 2012 (Duluth)
Overall Score = 4.95
Appropriate choice of financial analyses = 4.95
Appropriate interpretation= 5.0
Overall Score = 3.3
Appropriate choice of financial analyses = 3.6
Appropriate interpretation= 3.0
Overall Score = 4.7
Appropriate choice of financial analyses = 4.5
Appropriate interpretation= 4.8
Goal: Quantitative Skills (Statistical)
Assessment Tool Course
Statistical analysis of a dataset to make recommendations
1-‐5 scale, 3= acceptable
MBA 8211 Data Analysis and Statistics
Assessment Results
Fall 2012 (Duluth) Spring 2011 (Duluth)
Overall Score = 3.15
Correct choice of statistical technique = 3.35 Test result interpretation = 3.04
Managerial recommendations = 3.05
Overall Score = 2.71
Correct choice of statistical technique = 2.75 Test result interpretation = 2.69
Managerial recommendations = 2.68
Goal: Integrative, Cross-‐functional Applications
Assessment Tool Course
Open-‐ended assignment, based on a case study 1-‐5 scale, 3= acceptable
MBA 8411 Business Policy
Assessment Results
Fall 2010 (Rochester) Spring 2011 (Duluth) Spring 2012 (Duluth) Fall 2013 (Rochester)
Overall Score = 3.5 Problem definition = 4.1 Alternative generation = 3.7 Alternative evaluation = 3.7 Recommendations = 3.0 Implementation plan = 3.0 Overall Score = 3.4 Problem definition = 4.3 Alternative generation = 3.4 Alternative evaluation = 3.3 Recommendations = 3.6 Implementation plan = 4.4 Overall Score = 4.2 Problem definition = 4.7 Alternative generation = 3.7 Alternative evaluation = 4.5 Recommendations = 4.3 Implementation plan = 4.0 (New Scale: 1-‐3) Overall Score = 2.23 Cross-‐ Functional = 2.3 Stakeholders’ needs = 2.3 Global context: 2.1
4
Advanced knowledge of the core areas of business [B1] has been assessed using the MBA Major Field Test (MFT) created by Educational Testing Service (ETS). The MFT is designed to measure critical knowledge and understanding obtained in the MBA program. According to ETS, “The Major Field Tests go beyond the measurement of factual knowledge by helping you evaluate students’ ability to analyze and solve problems, understand relationships, and interpret material from their major field of study.” We administer the test to all students each year in Spring and, given the small size of the program, the results are reported at the program level. Over the past five years, between 73% (in 2010) and 95.5% (in 2012) of eligible students have completed the test.
The overall mean scores for our program are typically in the 90th percentile or above. The only exception
to this occurred in 2013, when our overall mean score dropped to the 67th percentile.
Table 2. LSBE’s Institutional Means Total Score on MFT
Overall Score
2010 2011 2012 2013 2014
Mean 262 264 262 253 261
Percentile (all US) 90th 90th 94th 67th 92nd
Range 237-‐284 236-‐279 236-‐279 226-‐273 237-‐289 Range Percentile 20-‐95+ 20-‐95+ 20-‐95+ 06-‐92 25-‐99+
N 11 16 21 10 19
ETS provides assessment scores for five separate domains: Marketing, Management, Finance, Managerial Accounting, and Strategic Integration. The first four domains capture the core functional areas [Learning Goal B1]. The fifth domain assesses strategic integration [Learning Goals B2 and A1]. With the exception of the year 2013, our students have fared very well in all five domains. Typically, their performance is in the top quartile nationally, with several scores in the top decile. The large drop in percentile scores across the board in 2013 was a cause for concern. It was possible that the deviance was driven by the relatively small sample size or the unique mix of students taking the test that year. Given that the test scores have come back to the long-‐term averages, we have reason to believe that 2013 was an anomaly.
Table 3. LSBE’s Institutional Mean Domain Scores on MFT
Domain 2010 2011 2012 2013 2014
Mean %ile Mean %ile Mean %ile Mean %ile Mean %ile
Marketing 69 95+ 69 85th 68 89th 63 68th 67 94th Management 65 80th 72 95th 70 96th 65 77th 66 77th Finance 54 85th 53 85th 54 93rd 46 60th 52 85th Managerial Accounting 63 90th 63 90th 61 93rd 50 51st 58 95th Strategic Integration 64 90th 64 90th 63 92nd 55 63rd 60 89th N 11 16 21 10 19
5
While MFT assesses students’ performance, the EBI survey captures students’ satisfaction with various aspects of the program. As part of ongoing program assessment, we have administered Educational Benchmarking Inc.’s (EBI) Part-‐Time MBA Exit Assessment every two years. Schools included in the Select 6 group for the last two rounds of assessment (2011 and 2013) are: Missouri -‐ Kansas City, Penn State -‐ Harrisburg, Grand Valley State, Minnesota State -‐ Mankato, Alabama -‐ Huntsville, and UMass -‐ Amherst (2013) and Wisconsin -‐ Parkside (2011). Results from 2011 are not directly comparable to those from 2013, as the number of factors changed from 15 to 18. The survey measures graduates’
perceptions of these factors on a seven-‐point scale, with 7 being most desirable. In addition to the 15 or 18 factors, the survey also measures students’ satisfaction with the quality of teaching in required subject matter courses. While this is not a measure of students’ learning, the data can provide an indirect measure of teaching effectiveness.
Table 4. 2011 EBI: Satisfaction with Teaching in Required Subjects
LSBE Select 6 Carnegie Class All Institutions
Satisfaction with quality of teaching in required subject
matter Mean Mean
Rank among 7 Mean Rank among 12 Mean Rank among 96 Accounting 5.60 5.33 2 5.70 7 5.65 47 Business Policy/Strategy 6.19 5.82 2 6.12 6 5.92 22 Economics/Business Economics 5.72 5.67 3 5.42 6 5.56 32 Finance 5.38 5.80 6 5.28 7 5.62 63 Human Resources Mgmt 5.85 5.73 3 5.75 4 5.57 24 Marketing 6.77 5.48 1 5.84 1 5.66 1 Operations 3.27 5.24 7 5.54 12 5.54 95 Statistics 4.88 4.81 5 5.25 9 5.44 79 Average 5.46 5.49 3.63/7 5.61 6.5/12 5.62 45.4/96
In the 2011 round, overall satisfaction with the quality of teaching in our required courses was 5.46 on the seven-‐point scale. This average was at about the median, relative to the three comparison groups: Select 6, Carnegie Class, and All Institutions. Scores for five of the eight courses were above the median when compared to All Institutions. Satisfaction with Marketing was ranked #1 in the country. The satisfaction was below median for Finance, Operations, and Statistics. The results for Operations were particularly troubling, with the course ranked #95 out of 96 institutions. The instructor who taught this course for this round (2009-‐2011) has since retired. However, the School had to retrench the line upon the faculty member’s retirement, because of budget cuts. The low rank (#79) in Statistics was likely due to a temporary instructor who taught the course in Fall 2008 (many of the students graduating in 2010-‐ 11 would have taken the class then). Unfortunately, the professor did not have a business background, and that significantly affected the students’ reactions to the class.
6
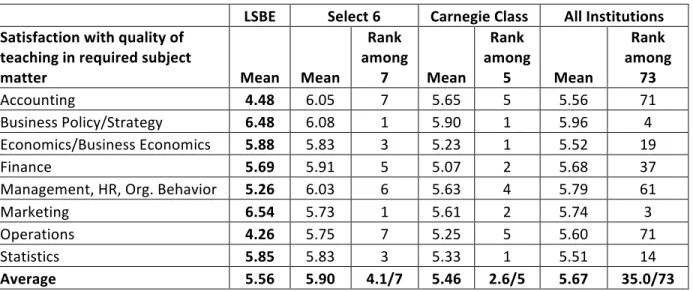
Table 5. 2013 EBI: Satisfaction with Teaching in Required Subjects
LSBE Select 6 Carnegie Class All Institutions
Satisfaction with quality of teaching in required subject
matter Mean Mean
Rank among 7 Mean Rank among 5 Mean Rank among 73 Accounting 4.48 6.05 7 5.65 5 5.56 71 Business Policy/Strategy 6.48 6.08 1 5.90 1 5.96 4 Economics/Business Economics 5.88 5.83 3 5.23 1 5.52 19 Finance 5.69 5.91 5 5.07 2 5.68 37
Management, HR, Org. Behavior 5.26 6.03 6 5.63 4 5.79 61
Marketing 6.54 5.73 1 5.61 2 5.74 3
Operations 4.26 5.75 7 5.25 5 5.60 71
Statistics 5.85 5.83 3 5.33 1 5.51 14
Average 5.56 5.90 4.1/7 5.46 2.6/5 5.67 35.0/73
The overall satisfaction ratings in the 2013 round are similar to those in the previous round, 5.56 on the seven-‐point scale. This average was again at about the median relative to the three comparison groups: Select 6, Carnegie Class, and All Institutions. Scores for five of the eight courses were at or above the median when compared to All Institutions. Satisfaction with Marketing continues to be highly ranked, #3 in the country. There was a marked improvement in Statistics. The satisfaction was below median for Accounting, Management-‐HR-‐Org. Behavior, and Operations. Accounting and Operations were ranked at #71 out of 73 institutions. Because of the retrenchment of the Operations line, the course was taught by an adjunct. The School has since been able to make a case for hiring a full-‐time tenure-‐track faculty in Operations. This faculty member is scheduled to join LSBE in Fall 2014. The instructor who taught the Accounting course found it difficult to strike a balance between the needs of those who had minimal accounting background and the CPAs in the class. One programmatic change that has resulted from this assessment is a new policy that gives CPAs the option of replacing the core Accounting class in the MBA program with an additional elective. The policy also allows CFAs to replace the core Finance class and SPHRs to replace the core HR class in the program. The addition of Management-‐HR-‐Org Behavior is new to this round. We do not have required courses in Management or Organizational Behavior in our MBA program beyond the foundation requirement. This is a recognized weakness of the program. The School has made efforts to compensate for this weakness by offering electives focusing on management and leadership. A Special Topics course on leadership and management was offered as a result of a comprehensive curriculum review in Summer 2014. We plan to make this course a regular offering in the future. Similarly, a new elective titled “Communicating for Leadership” has been added to the program to strengthen students’ communication skills and will be offered in Fall 2014.
EBI results provide insights into students’ perception of the overall effectiveness of the program, as well as a number of other non-‐teaching issues. LSBE utilizes these results to assess the program beyond its learning goals. See Appendix A3 for EBI 2011 and 2013 result summaries.
7
Assurance of Learning Impact on Graduate Curricula Development
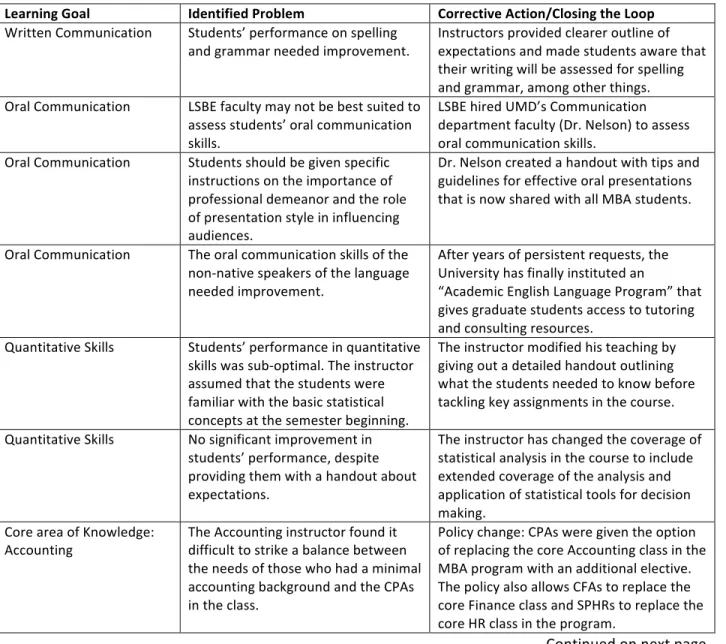
After each cycle, the assessment data are reviewed by the faculty teaching in the program and recommendations are developed for making changes to address issues and concerns. A number of curricular changes have been triggered by the assessment results. A brief summary of some of these curricular changes is given in the table below. More detailed information on “closing-‐the loop” activities is provided in Appendix A2.
Table 6. Major Curricular Closing-‐the-‐Loop Actions: Graduate Program
Learning Goal Identified Problem Corrective Action/Closing the Loop
Written Communication Students’ performance on spelling and grammar needed improvement.
Instructors provided clearer outline of expectations and made students aware that their writing will be assessed for spelling and grammar, among other things. Oral Communication LSBE faculty may not be best suited to
assess students’ oral communication skills.
LSBE hired UMD’s Communication department faculty (Dr. Nelson) to assess oral communication skills.
Oral Communication Students should be given specific instructions on the importance of professional demeanor and the role of presentation style in influencing audiences.
Dr. Nelson created a handout with tips and guidelines for effective oral presentations that is now shared with all MBA students.
Oral Communication The oral communication skills of the non-‐native speakers of the language needed improvement.
After years of persistent requests, the University has finally instituted an
“Academic English Language Program” that gives graduate students access to tutoring and consulting resources.
Quantitative Skills Students’ performance in quantitative skills was sub-‐optimal. The instructor assumed that the students were familiar with the basic statistical concepts at the semester beginning.
The instructor modified his teaching by giving out a detailed handout outlining what the students needed to know before tackling key assignments in the course. Quantitative Skills No significant improvement in
students’ performance, despite providing them with a handout about expectations.
The instructor has changed the coverage of statistical analysis in the course to include extended coverage of the analysis and application of statistical tools for decision making.
Core area of Knowledge:
Accounting The Accounting instructor found it difficult to strike a balance between the needs of those who had a minimal accounting background and the CPAs in the class.
Policy change: CPAs were given the option of replacing the core Accounting class in the MBA program with an additional elective. The policy also allows CFAs to replace the core Finance class and SPHRs to replace the core HR class in the program.
Continued on next page
8
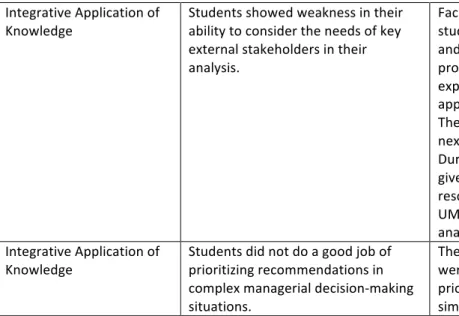
Table 6. Major Curricular Closing-‐the-‐Loop Actions: Graduate Program (continued) Integrative Application of
Knowledge Students showed weakness in their ability to consider the needs of key external stakeholders in their analysis.
Faculty discussed ways in which to get students to consider external stakeholders and introduced a standardized set of procedures, so that all students were exposed to the same broad analytical approaches to managerial decision making. The revised procedure will be used in the next assessment cycle in 2015.
During MBA orientation, students were given a presentation and handout on the resources and tools available through the UMD library for external environmental analysis and stakeholder analysis. Integrative Application of
Knowledge Students did not do a good job of prioritizing recommendations in complex managerial decision-‐making situations.
The course teachings and case instructions were altered to highlight the importance of prioritizing courses of action, rather than simply listing all possible options.
To keep the MBA curriculum current, we continue to offer special topics courses that address key cross-‐ functional issues that are relevant to the current business environment. A full list of MBA electives offered within the last five years is presented in Appendix B1.
Overall, the process of assessment and assurance of learning works well in LSBE. Assessment activities are faculty-‐administered and distributed over a wide array of courses and tests. The Undergraduate and Graduate Committees of LSBE are responsible for managing assessment, while the Assessment
Committee oversees the entire process. Faculty within their respective departments review assessment outcomes and design and implement corrective actions. It was felt that the information regarding assessment could be more broadly shared with the LSBE faculty and staff. This information gap was addressed in 2013-‐14 by holding a school-‐wide AoL retreat.
A1
A1: Learning Goals-‐ Graduate
A2
MBA Program
Learning Goals
The overall goal of the MBA Program of the School is to prepare students to be business leaders. The specific goals of the MBA Program are as follows:
[A] Contribute to the personal growth of individuals by enhancing their core knowledge and skills. More specifically, our students will—
• communicate complex ideas effectively in written and oral form, and [A1]
• utilize quantitative knowledge and skills to diagnose and evaluate complex situations [A2].
[B] Contribute to the intellectual growth of individuals by enhancing their management knowledge and skills. More specifically, our students will—
• acquire advanced knowledge of the core areas of business: accounting, finance, human
resources, operations and marketing, [B1]
• integrate their understanding of the core areas of business: apply their knowledge from the core
areas of business to analyze issues and develop recommendations that reflect the cross-‐ functional nature of management processes, [B2] demonstrate management decision-‐making capabilities: analyze issues and develop recommendations that simultaneously meet
organizational objectives and also consider the needs of primary stakeholders (e.g., employees, customers, shareholders) under a context of global uncertainty and change. [A1]
A3
A2: Assessment Reports-‐ Graduate
A4 Learning Goal: Oral and Written Communication [A1]
Assessment Context Semester Reviewed: Fall 2010, Rochester (written comm)
Course: MBA 8411 Business Policy
Number of Students Assessed: 7 students
Assessment Tool Students were assigned a case to analyze, with an open-‐ended assignment, based on a rubric-‐driven question: “What should be the (business or corporate level) strategy of the firm?” The rubrics used a 1 to 5 scale, where 1=
unacceptable, 3= acceptable, and 5 = excellent.
Analysis • The Overall Score was 3.8.
• The component score averages were:
o 4.3: The organization of the paper
o 3.7: The use of correct grammar and sentence structure o 3.6: The spelling and word choice
o 3.5: The use of references and citations
• Overall, it appears that students are communicating at an “Acceptable”
level.
Recommendations • No urgent need to develop additional written communication skills, given
the adequate performance of the students on the assessment.
• Students should be asked to be more careful in their spelling and grammar
usage.
Follow-‐up
(Closing the Loop )
• Instructors provide clearer outline of expectations and make students aware
that their writing will be assessed for spelling and grammar, among other things.
A5 Learning Goal: Oral and Written Communication [A1]
Assessment Context Semester Reviewed: Spring 2011, Duluth (written comm)
Course: MBA 8411 Business Policy
Number of Students Assessed: 8 students
Assessment Tool Students were assigned a case to analyze, with an open-‐ended assignment based on a rubric-‐driven question: “What should be the (business or corporate level) strategy of the firm?” The rubrics used a 1 to 5 scale, where 1=
unacceptable, 3= acceptable, and 5 = excellent.
Analysis • The Overall Score was 4.3.
• The component score averages were:
o 3.8: The organization of the paper o 4.8: The use of correct grammar
o 4.0: The use of appropriate sentence structure o 4.6: The spelling and word choice
• The performance on word choice and grammar was much better than in
previous years.
Recommendations • No urgent need to develop additional written communication skills given
the excellent performance of the students on the assessment.
• Develop a different rubric for the assessment of written skills.
Follow-‐up
(Closing the Loop )
• An alternate rubric has been developed; it is in draft form and will be used
A6 Learning Goal: Oral and Written Communication [A1]
Assessment Context Semester Reviewed: Fall 2013, Rochester (written comm)
Course: MBA 8411 Business Policy
Number of Students Assessed: 5 students selected at random
Assessment Tool Students were assigned a case to analyze, with an open-‐ended assignment, based on a rubric-‐driven question: “What should be the (business or corporate level) strategy of the firm?” The rubrics used a 1 to 3 scale, where 1 =
unacceptable, 2 = acceptable, and 3 = excellent. This was a test of the new rubric that focused more on the communicative aspects, rather than the technical aspects, of communication.
Analysis • The Overall Score was 2.35.
• The component score averages were:
o 2.4: Logical organization of ideas o 1.8: Development of ideas and content o 2.4: Support of content and ideas
o 2.8: Correct grammar, spelling, and syntax
• Overall, it appears that students are communicating at an “Acceptable”
level.
Recommendations • Students may need some coaching on the use of content to convey a depth
of ideas
• No urgent need to develop additional written communication skills, given
the adequate performance of the students on the assessment.
Follow-‐up
(Closing the Loop )
• Some discussion on expectations regarding the use of content to develop
depth of ideas should be included in the orientation. The Business Communication faculty will be asked for help in developing this going forward.
A7 Learning Goal: Oral and Written Communication [A1]
Assessment Context Semester Reviewed: Fall 2009, Rochester (oral comm) Course: MBA 8211 Data Analysis & Statistics Number of Students Assessed: 27 students
Assessment Tool Dr. Nelson viewed video recordings of the presentations and evaluated them on numerous criteria relating to form, content, delivery, and poise. She used a 5-‐ point scale with 1=Poor, 2=Marginal/slightly problematic, 3=Average/Neutral, 4=Good, and 5=Excellent. Our goal is to have an average student performance of 3 or higher on these presentations.
Analysis • Overall, 17 of the 27 students scored at or above 3.0.
• However, assigning numeric values of 5 for excellent (and 4.75 for Excellent
minus, 4.25 for Good plus, etc.), the average performance of the students was 3.04, just at the “Average” level.
• Given the results, there is an opportunity for improvement.
Recommendations • Students should be given specific instructions on the importance of
professional demeanor and the role of presentation style in influencing audiences.
• Dr. Nelson should be given an opportunity to address the students, in
person, on how to give effective presentations.
Follow-‐up
(Closing the Loop )
• Dr. Nelson prepared a document that summarized key things to consider
before the final presentation in the class. This document was shared with all students before the next cycle.
• Working with her schedule and the schedule of classes was generally
difficult and may not be practical for inviting her to address students in the Rochester class.
A8 Learning Goal: Oral and Written Communication [A1]
Assessment Context Semester Reviewed: Fall 2010, Duluth (oral comm) Course: MBA 8211 Data Analysis & Statistics Number of Students Assessed: 18 students
Assessment Tool Dr. Nelson viewed video recordings of the presentations and evaluated them on numerous criteria relating to form, content, delivery, and poise. She used a 5-‐ point scale with 1=Poor, 2=Marginal/slightly problematic, 3=Average/Neutral, 4=Good, and 5=Excellent. Our goal is to have an average student performance of 3 or higher on these presentations.
Analysis • Overall, almost 78% of the students scored at or above the “average” level.
This is an improvement over the previous assessment (Fall 2008), where less than 63% of the students scored at that level.
• However, assigning numeric values of 5 for excellent (and 4.75 for Excellent
minus, 4.25 for Good plus, etc.), the average performance of the students comes in at 2.93, just about right at the “Average” level.
• Given the results, there is an opportunity for improvement.
Recommendations • Students should be given specific instructions on the importance of
professional demeanor and the role of presentation style in influencing audiences.
• Dr. Nelson should be given an opportunity to address the students, in
person, on how to give effective presentations.
• Dr. Nelson was requested to alter the scale used to be consistent with our
other assessments ranging from “Unacceptable” to “Excellent.”
Follow-‐up
(Closing the Loop )
• Dr. Nelson prepared a document that summarized key things to consider
before the final presentation in the class. This document was shared with all students before the next cycle.
• Dr. Nelson visited the class in Duluth and made a brief presentation to the
students on presentation style.
• Dr. Nelson reluctantly agreed and used a revised four-‐point scale for future
assessment cycles. With the revised scale, students would have to score a 2 or higher to be deemed acceptable.
A9 Learning Goal: Oral and Written Communication [A1]
Assessment Context Semester Reviewed: Summer 2011, Rochester (oral comm) Course: MBA 8211 Data Analysis & Statistics Number of Students Assessed: 8 students
Assessment Tool Dr. Nelson viewed video recordings of the presentations and evaluated them on numerous criteria relating to form, content, delivery, and poise. She used a 5-‐ point scale with 1=Poor, 2=Marginal/slightly problematic, 3=Average/Neutral, 4=Good, and 5=Excellent. Our goal is to have an average student performance of 3 or higher on these presentations.
Analysis • Overall, 75% of the students scored at or above 3.0.
• Assigning numeric values of 5 for excellent (and 4.75 for Excellent minus,
4.25 for Good plus, etc.), the average performance of the students comes in at 3.31, which is an improvement over last round in Rochester (3.04) in 2009.
• According to Dr. Nelson, “there were remarkable improvements in the
delivery…particularly in the area of extemporaneous delivery.”
Recommendations • Dr. Nelson was requested to alter the scale used to be consistent with our
other assessments, ranging from “Unacceptable” to “Excellent.”
Follow-‐up
(Closing the Loop )
• Students were given a summary document that outlined the expectations
for a professional presentation and some tips on developing presentation skills at the start of the semester.
• Dr. Nelson reluctantly agreed and used a revised four-‐point scale for future
assessment cycles. With the revised scale, students would have to score a 2 or higher to be deemed acceptable.
• The presentation outline given to students was revised to clarify that the
outline should not be blindly followed and should be adapted for the particular topic of the presentation. This change has been made for the Fall 2014 class.
A10 Learning Goal: Oral and Written Communication [A1]
Assessment Context Semester Reviewed: Fall 2012, Duluth (oral comm) Course: MBA 8211 Data Analysis & Statistics Number of Students Assessed: 7 students
Assessment Tool Dr. Nelson viewed video recordings of the presentations and evaluated them on numerous criteria relating to form, content, delivery, and poise. She used a 4-‐point scale with 4=Excellent, 3=Good, 2=Acceptable, and 1=Unacceptable. Our goal is to have an average student performance of 2 or higher on these presentations.
Analysis • Overall, 71% of the students scored at acceptable or higher level.
• The numeric evaluation of the individual student scores resulted in an average
of 2.79 on the revised 4-‐point scale.
• Several of the students in this round were non-‐native English speakers. • While there were not as many “excellent” marks among individual speakers,
neither were there as many “unacceptable” performances compared to some of the previous cohorts.
Recommendations • There were some remarkable improvements, “particularly in the area of
physical relationship to the audience and the management of the power point.”
• Dr. Nelson also noted that the “teams paid some attention to presentation
structure.”
• Encourage non-‐native speakers to seek special help in building presentation
skills.
• Students should be told that they should not blindly follow the presentation
guideline.
• Dr. Nelson was requested to alter the scale used to be consistent with our
other assessments, ranging from “Unacceptable” to “Excellent.”
Follow-‐up
(Closing the Loop )
• After years of pressure, the University has finally instituted an “Academic
English Language Program” which gives graduate students access to tutoring and consulting resources. Although the focus is on writing, the Director, Robin Murie, has indicated a willingness to work on presentation/speaking skills too. The program offers both for-‐credit classes and individual tutoring. All students are now informed of this resource on admission and are encouraged to use the resource to develop their skills.
• The presentation outline given to students was revised to clarify that the
outline should not be blindly followed and should be adapted for the particular topic of the presentation. This change has been made for the Fall 2014 class.
A11 Learning Goal: Oral and Written Communication [A1]
Assessment Context Semester Reviewed: Spring 2013, Rochester (oral comm) Course: MBA 8211 Data Analysis & Statistics Number of Students Assessed: 24 students
Assessment Tool Dr. Nelson viewed video recordings of the presentations and evaluated them on numerous criteria relating to form, content, delivery, and poise. She used a 4-‐ point scale with 1=Unacceptable, 2=Acceptable, 3=Good, and 4=Excellent. Our goal is to have an average student performance of 2 or higher on these presentations.
Analysis • In this cycle, students were also limited to 10-‐minute presentations (due to
class time constraints) and this significantly affected the ability to evaluate individual presentations.
• The assessor noted vastly different presentation settings from each cycle to
the next (availability of monitors, video range and clarity, etc.) that makes cross-‐group comparisons and careful evaluation of all presenters difficult.
• Overall, over 83% of the students scored at or above the “acceptable-‐” level. • Assigning numeric values of 4 for excellent (and 4.75 for Excellent minus,
4.25 for Good plus, etc.), the average performance of the students comes in at 2.18, which is at the Acceptable level. There remains room for
improvement.
Recommendations • Change the assessment to a class which requires individual student
presentations.
• Ensure that all students present for an adequate time to allow for
meaningful evaluation.
Follow-‐up
(Closing the Loop )
• The results continue to be adequate, though not spectacular. In Fall 2013,
the Graduate Committee began a process of evaluating the assessment process and seeing if there is a simpler and more effective way to not only teach presentation skills and also assess it better as part of the overall assessment plan.
• This evaluation is still ongoing and the hope is to develop an alternative oral
presentation skills plan for the Spring 2015 cycle, perhaps in another class altogether.
A12 Learning Goal: Quantitative Skills [A2]
Assessment Context Semester Reviewed: Fall 2010, Rochester
Course: MBA 8411 Business Policy
Number of Students Assessed: 7 randomly chosen students
Assessment Tool Students were assigned a case to analyze, with an open-‐ended assignment based on a rubric-‐driven question: “What should be the (business or corporate level) strategy of the firm?” The rubrics used a 1 to 5 scale, where 1= unacceptable, 3= acceptable, and 5 = excellent. This round of assessment focused on financial quantitative skills.
Analysis • The Overall Score was 4.95. It appears that our students in Rochester have
developed an excellent ability to analyze financial data and information.
• The component score averages were:
o 4.95: Choosing appropriate financial analyses (complete set of ratios, comparing across years and, if possible, with industry metrics). o 5.0: Interpreting the financial analysis to aid in the understanding of a
business situation.
Recommendations • The continued use of an open-‐ended assignment was recommended in the
future, coupled with a handing out of the rubrics to the students, since this process clearly states the expectation, without providing information about how to do the analyses.
• Assessment of quantitative skills should be expanded beyond just financial
analysis skills.
Follow-‐up
(Closing the Loop )
• An assessment of quantitative skills that went beyond the use of financial
A13 Learning Goal: Quantitative Skills [A2]
Assessment Context Semester Reviewed: Spring 2011, Duluth
Course: MBA 8411 Business Policy
Number of Students Assessed: 8 students
Assessment Tool Students were assigned a case to analyze, with an open-‐ended assignment, based on a rubric-‐driven question: “What should be the (business or corporate level) strategy of the firm?” The rubrics used a 1 to 5 scale, where 1=
unacceptable, 3= acceptable, and 5 = excellent.
Analysis • The Overall Score was 3.3.
• The component score averages were:
o 3.6: Choosing appropriate financial analyses (complete set of ratios, comparing across years and, if possible, with industry metrics). One student included no financial information, and another provided some trend data, but no financial ratios.
o 3.0: Interpreting the financial analysis to aid in the understanding of a business situation. As noted above, for one student, this was completely missing. For 2 others, they provided no interpretation of the financial ratios, and for 1 other, their interpretation was incorrect. Although “acceptable” at the minimum level, the low score in this area is noted as a concern.
Recommendations • The continued use of an open-‐ended assignment was recommended in the
future, coupled with a handing out of the rubrics to the students, since this process clearly states the expectation, without providing information about how to do the analyses.
• Assessment of quantitative skills should be expanded beyond just financial
analysis skills.
Follow-‐up
(Closing the Loop )
• In the next assessment cycle, Dr. Borchert provided more details and clearer
expectations on the analysis expected.
• An assessment of quantitative skills that went beyond the use of financial
ratios was initiated in Fall 2012. The instructor of the MBA 8211 (Data Analysis & Statistics) class was charged with creating and administering an assessment in that class.
A14 Learning Goal: Quantitative Skills [A2]
Assessment Context Semester Reviewed: Spring 2012, Duluth
Course: MBA 8411 Business Policy
Number of Students Assessed: 6 randomly chosen students
Assessment Tool The course instructor (Dr. Borchert) assigned her MBA students an independent project to conduct a Strategic Audit for a firm of their choice. This assignment required many specific steps to the analysis, and the tasks required for
assessment were integrated into the assignment. The students were also given the rubrics that were used for the assessment. This round of assessment focused on financial quantitative skills.
Analysis • The Overall Score was 4.7.
• The component score averages were:
o 4.5: Choosing appropriate financial analyses (complete set of ratios, comparing across years and, if possible, with industry metrics). o 4.8: Interpreting the financial analysis to aid in the understanding of a
business situation.
Recommendations • Although the open-‐ended assignment allows us to see how students apply
their knowledge, few assignments have required any advanced or sophisticated financial analysis. Explore moving the quantitative skills assessment out of the MBA 8411 class assessment and into the MBA Finance course.
• The assessment is much more complex than needed. Consider revising the
administration of the assignment and using a standard case instead of different ones each time.
Follow-‐up
(Closing the Loop )
• Both the recommendations were the focus of a task force consisting of Dr.
Wong (Finance) and Dr. Mencl (Management Studies) in 2013. They
prepared a detailed recommendation for revising the MBA 8411 assessment process. Their key recommendations will be tested in the 2015 assessment of the class.
o Faculty teaching MBA 8411 will assign a general “corporate analysis” in their classes, instead of using a specific case study.
o Students will be required to conduct the corporate analysis to include a “Financial Analysis Appendix,” which will be evaluated by a faculty member in finance or accounting on the Graduate Committee.
A15 Learning Goal: Quantitative Skills [A2]
Assessment Context Semester Reviewed: Fall 2012, Duluth
Course: MBA 8211 Data Analysis & Statistics Number of Students Assessed: 13 students
Assessment Tool Students analyze a dataset, identify and justify an appropriate statistical
technique, interpret the results of the statistical test, and then meaningfully use the results to address a managerial issue. The assignment included 10 required questions, scored on a 1 to 5 scale; 1 = unacceptable, 2=poor, 3=acceptable, 4=good, 5=excellent. Acceptable level was 3 or higher. However, only a 1 was considered unacceptable on this scale.
Analysis • The Overall Score was 3.15.
• The component score averages were:
o 3.35: Correct choice of statistical technique. For 1 of the 10 questions (use of Pearson correlation), the class average was below 3.0.
o 3.04: Test results interpretation. For 4 of the 10 questions, the class average was at or below 3.0. For one question (interpreting ANOVA), over half the students scored below 3.0.
o 3.05: Managerial recommendations. 5 of the 13 students scored below 3.0 on the use of ANOVA results for developing managerial
recommendations.
Recommendations • It appears that students were provided with inadequate information on
exactly what basic statistics skills were needed for the Data Analysis
assignment. While all students are expected to have taken statistics prior to entry into the program, often the details of the statistical analyses are forgotten. The instructor should more clearly articulate expectations regarding statistical knowledge.
Follow-‐up
(Closing the Loop )
• The instructor created a simple document that highlighted the statistical
knowledge students are expected to have before they tackle this assignment in the future. This should force students to refresh their knowledge in statistics and then better be able to focus on using that statistics knowledge for managerial decision making. The document was created and used for the assessment in Rochester in 2013.
A16 Learning Goal: Quantitative Skills [A2]
Assessment Context Semester Reviewed: Spring 2013, Rochester
Course: MBA 8211 Data Analysis & Statistics Number of Students Assessed: 24 students
Assessment Tool Students analyze a dataset, identify and justify an appropriate statistical
technique, interpret the results of the statistical test, and then meaningfully use the results to address a managerial issue. The assignment included 10 required questions, scored on a 1 to 5 scale; 1 = unacceptable, 2=poor, 3=acceptable, 4=good, 5=excellent. Acceptable level was 3 or higher. However, only a 1 was considered unacceptable on this scale.
Analysis • The Overall Score was 2.71.
• The component score averages were:
o 2.75: Correct use of statistical technique. For 2 of the 10 questions, about half of the students had a score below 3.0.
o 2.69: Test results interpretation. For 3 of the 10 questions, half or more of the students has a score below 3.0.
o 2.68: Managerial recommendations. Only 3 of the 24 students had more than one “unacceptable” answer for the 10 questions they answered.
Recommendations • The results suggest that there continues to be weakness in students’ ability
to analyze and apply the results of statistical analyses to managerial decision making from the perspective of the instructor. After the last assessment, students were given a “Statistics Refresher” sheet which defined what they needed to understand before attempting the assignment. It does not appear this was particularly effective.
• The content that is assessed (application of statistical data analysis for
managerial decision making) is not specifically covered in the class. The content is assumed to be covered in foundation coursework and students are given the assessment assignment early in the term. This needs to change.
Follow-‐up
(Closing the Loop )
• The course instructor has agreed to change his class structure to
accommodate a more meaningful coverage of the content and subsequent assessment.
• The course instructor will also design an additional assessment and
administer it in his Data Analysis class in Duluth in Fall 2014 and Rochester in Spring 2015. It will also be evaluated by someone other than the instructor.