Original
Does Muscle Fatigue Alter EEG Bands of
Brain Hemispheres?
Taghizadeh Sh.
1, 2, Pirouzi S.
1,3* , Zamani A.
4, Motealleh
A.
1,3, Bagheri Z.
5ABSTRACT
Background: Muscle fatigue has been known to influence brain activity, but very
little is known about how cortical centers respond to muscle fatigue.
Objective: This study was conducted to investigate the effects of muscle contrac
-tion and fatigue induced by two different percents of maximal voluntary contrac-tion (MVC) on Electroencephalography (EEG) signals.
Material and Methods: In this quasi-experimental study, EEG signals were
recorded from twenty-one healthy human subjects during three phases (rest, pre fatigue and post fatigue) contraction of Adductor pollicis muscle (APM) at 30% and 70% MVC. The mean powers of EEG bands (alpha, beta and gamma) were com -puted offline in the frequency domain.
Results: None of the three phases with each percent of MVC revealed significant
differences for all bands (p>0.05). Comparison of two hemispheres showed that right hemisphere gamma band activity was enhanced during pre-fatigue state at 30% MVC (p= 0.042) and post-fatigue state at 70% MVC (p= 0.028). Right hemisphere beta band activity also increased prominently at 70% MVC in post-fatigue condition (p = 0.030).
Conclusion: These results suggest muscle contraction and fatigue at 30% and
70% MVC have no significant effect on EEG activity, but the trends of beta and gamma band activities are almost similar in each percent of 30% and 70% MVC. Right brain hemisphere shows more activity than left hemisphere in beta and gamma rhythm after fatigue state at 70% MVC.
Citation: Taghizadeh Sh, Pirouzi S, Zamani A, Motealleh A, Bagheri Z. Does Muscle Fatigue Alter EEG Bands of Brain Hemispheres?. J Biomed Phys Eng. 2020;10(2):187-196. doi: 10.31661/jbpe.v0i0.621.
Keywords
Electroencephalography (EEG); Maximal Voluntary Contraction (MVC); Alpha Band; Beta Band; Gamma Band; Muscle Fatigue; Muscle Contraction
1PhD, Department of
Physiotherapy, School of Rehabilitation Sci-ences, Shiraz University of Medical Sciences, Shiraz, Iran 2PhD, Student Research Committee, School of Rehabilitation Sciences, Shiraz University of Medical Sciences, Shi-raz, Iran
3PhD, Rehabilitation
sciences research center, Shiraz University of Medical Sciences, Shiraz, Iran
4PhD, Department of
Medical Physics, School of Medicine, Shiraz University of Medical Sci-ences, Shiraz, Iran
5PhD, Department of
Biostatistics, School of Medicine, Shiraz Univer-sity of Medical Sciences, Shiraz, Iran *Corresponding author: S. Pirouzi Department of Physi-otherapy, School of Rehabilitation Sciences, Shiraz University of Medical Sciences, Shi-raz, Iran E-mail: piroozis@sums. ac.ir Received: 1 August 2016 Accepted: 13 August 2016
Introduction
M
uscle fatigue is a common human symptom which can de-crease the force-generating capacity of the muscle and in
-crease the possibility of injury [1]. Central Nervous System (CNS) and muscle are both responsible for developing muscle fatigue [2]. Although many studies have investigated the role of muscle, little is known about CNS part [1, 3, 4].
EEG bands can be impressed by muscle fatigue. The power of EEG beta band increased in a study on induced muscle fatigue [5]. Despite
the rise in the power of EEG activities with muscle fatigue, in these cases the EEG-EMG coherence of beta band significantly decreased [6]. Also, significant reduction has been shown to occur in frontal theta, alpha-1 and alpha-2 frequencies after inducing fatigue [7].
The effect of muscle fatigue induced by different percentages of Maximal Voluntary Contraction (MVC) on CNS is controversial [8]. During fatigue induced by a sustained maximal muscle contraction, brain signals increase to recruit more motor units to over
-come muscle fatigue, leading to extra cortical activity [9]. Central fatigue can also develop by sub-maximal muscle activity. A study was designed to compare muscle contraction with 5 and 30 percent of MVC for more than 6 minutes, central fatigue developed concur
-rently with peripheral fatigue. It seems longer contraction time is necessary for fatigue in
-duced with lower MVC than higher MVC [2]. Comparing three different percents of MVC in handgrip tasks and fatigue state, the EEG power at lower MVC was significantly lesser than higher MVC in beta and gamma bands [8].
The effect of muscle fatigue on brain hemi
-spheres and their Interrelationship is vague. Brain activity decreases in contralateral and ipsilateral sensorimotor and supplementary motor areas after muscle fatigue [10]. Liu et al. collected EEG signals during fatigue and non-fatigue motor tasks. Results have shown, under fatigue condition, brain activation cen
-ters shifted toward the ipsilateral hemisphere of the active muscle [1]. Tanaka et al. inves
-tigated the effect of muscle fatigue induced at a MVC level. They suggested the ipsilateral sensorimotor and prefrontal areas compensate for decrease in the activity of other areas of the brain under physical fatigue state [11].
Related to these findings, the present study was conducted to investigate the effects of muscle contraction and fatigue on EEG sig
-nals. A protocol using 30% MVC and 70% MVC on EEG power of alpha, beta and gam
-ma band activities was recorded from both hemispheres of the brain. It was hypothesized that EEG signal powers change with fatigue state and the effects of fatigue induced with 30% and 70% MVC on power of EEG signals are different. Moreover, the pattern of brain hemispheres activity might change during fa
-tigue condition.
Material and Methods
Subjects
In this quasi-experimental study,twenty-one healthy volunteers participated in this experi
-ment, 14 women and 7 men, whose mean age was 26.7. Subjects were included if they were right-handed and between 20-35. Potential participant with a history of neurological or musculoskeletal disorder, diabetics or taking interfering medication was excluded. A writ
-ten informed consent was signed by all sub
-jects before the beginning of experiment. All experimental procedures were approved by lo
-cal ethic committee (no: CT-92-6898).
EEG Recording
EEG signals were recorded from both hemi
-spheres with linked-ear reference obtained from 9 electrodes (ftp1, ftp2, f3, f4, c3, c4, p3, p4 and cz) arranged based on the International 10-20 system of electrode positioning method. An EEG device, Neurowerk EEG-EMG sys
-tem (Sigma, Germany) was used for EEG data acquisition. Skin preparation gel and conduc
-tive paste (Neuroprep gel and Ten20 paste, Weaver and Company, Aurora, USA) with Ag-AgCl electrodes were used for electrode attachment points. The Impedance lowered below 5 kΩ in all experiments. The band pass filter 0.2-50 HZ and notch filter 50 dB were ap
-plied. EEG signals were digitized at sampling rate of 250 HZ. EEG bands alpha (8-13Hz), beta (13-30Hz) and gamma (30-50Hz) signals were computed offline with a written program in MATLAB|R2012a Software. EEG record
-tifacts were removed by our written software program and only artifact-free parts were used for analysis. The mean power of three differ
-ent bands were calculated in the frequency domain during muscle rest, pre-fatigue muscle contraction and post muscle fatigue state at both 30% and 70% MVC of right APM.
Fatigue Motor Task
MVC of right APM of each subject was measured by applying pressure to the dyna
-mometer transducer which was connected to a digital analytical unit (WinCAS analyzing system, MIE medical research LTD, United Kingdom). The target levels, 30% or 70% of MVC (in session 1 or 2 as described be
-low) were calculated by software utility and indicated on the digital analyzer system. The subject performed sustained Adductor pinch at the target value until fatigue was detected. Subject self-awareness of fatigue and inability to continue proper contraction of APM and es
-pecially decrease by 25% or more motor out
-put were used as the criteria for muscle fatigue [5].
Procedure
The experiment consisted of two sessions performing in a crossover design on two con
-secutive days. In the first stage, for each sub
-ject, EEG signals of both hemispheres were recorded for 40 seconds during resting state in each session. Then, MVC of right APM was determined by a hand grip dynamometer and 30% or 70% of MVC was calculated by that device and shown on screen by an indicator. In the second stage called the pre-fatigue state, the subject performed a 40 second sustained right hand grip contraction at 30% or 70% of MVC. During muscle contraction, EEG data were recorded simultaneously. In the third stage, APM fatigue was induced by sustained handgrip contraction at 30% or 70% of MVC. Immediately after induced fatigue, EEG data were recorded for another 40 seconds as muscle contraction proceeded. During the ex
-periment, the position of the subjects was half lying with support of their back and head to decrease trunk and neck muscle contractions and performed handgrip task comfortably. To reduce artifacts, the participants were asked to keep their neck, shoulder and face muscles totally relaxed. Any environmental disturbing factors e.g. noise; temperature and light were controlled during the procedure.
Statistical analysis
Statistical analysis was performed by SPSS 16.0 software. Kolmogrov-Smirnove test was used to examine the normal distribution of data. Mean powers of EEG signals at rest con
-dition of both 30% and 70% MVC showed a normal distribution. Pre-fatigue and post-fa
-tigue conditions data did not follow a normal distribution. Repeated measures ANOVA was used to determine the effects of resting, pre-fa
-tigue muscle contraction and induced fa-tigue on each of alpha, beta and gamma EEG bands mean power changes in each hemisphere. Paired T test was used to compare right and left hemispheres rest data. Wilcoxon test was used for comparing pre-fatigue and post-fa
-tigue data of both hemispheres. A significant level of P≤0.05 was used.
Results
Repeated measures ANOVA used to com
-pare the mean power changes in three phases of rest, pre-fatigue and post-fatigue conditions (at both 30% and 70% MVC in three bands). Shape mean values changes are shown in Fig
-ures 1-6.
Repeated measures ANOVA showed that none of the three phases had significant differ
-ences for all bands (p>0.05); but, the trend of changes was noticeable.
At 30% MVC, the power of alpha band in left hemisphere showed a reduction from rest
-ing to pre-fatigue state, but stayed without changes from pre-fatigue to fatigue condition. In right hemisphere, the power of alpha band was the same in the resting state and in the
Figure 1: Meanpowervalues of alpha band in three phases at 30% MVC in right and left hemi -spheres
Figure 2: Mean power values of beta band in three phases at 30% MVC in right and left hemi
-spheres
pre-fatigue state, but declined in the fatigue state; therefore, the trend of alpha band power changes was different in right and left hemi
-spheres (Figure 1).
Power of beta band at 30% MVC in left hemisphere was the same in rest and pre-fa
-tigue state, but declined after fa-tigue. Power of beta band in right hemisphere showed an increase from rest to pre-fatigue condition, but reduced after fatigue (Figure 2).
Power of gamma band at 30% MVC was al
-most the same from resting to pre-fatigue state, but decreased slightly after fatigue. Power of
gamma band in right hemisphere showed an increase from rest to pre- fatigue, but reduced from pre-fatigue to post-fatigue state (Figure 3). As shown, the trend of changes in beta and gamma bands was similar in right and left brain hemispheres.
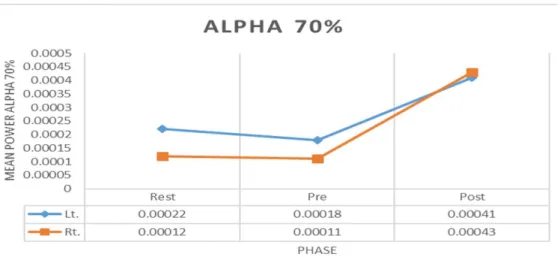
Power of alpha band at 70% MVC in left hemisphere showed decrease from rest to pre-fatigue state, but increased from pre-pre-fatigue to fatigue state. In right hemisphere, power of alpha band reduced very slightly from rest to fatigue state, but increased from pre-fatigue to pre-fatigue condition (Figure 4).
Figure 3: Mean power values of gamma band in three phases at 30% MVC in right and left hemispheres
Figure 4: Mean power values of alpha band in three phases at 70% MVC in right and left hemi
-spheres
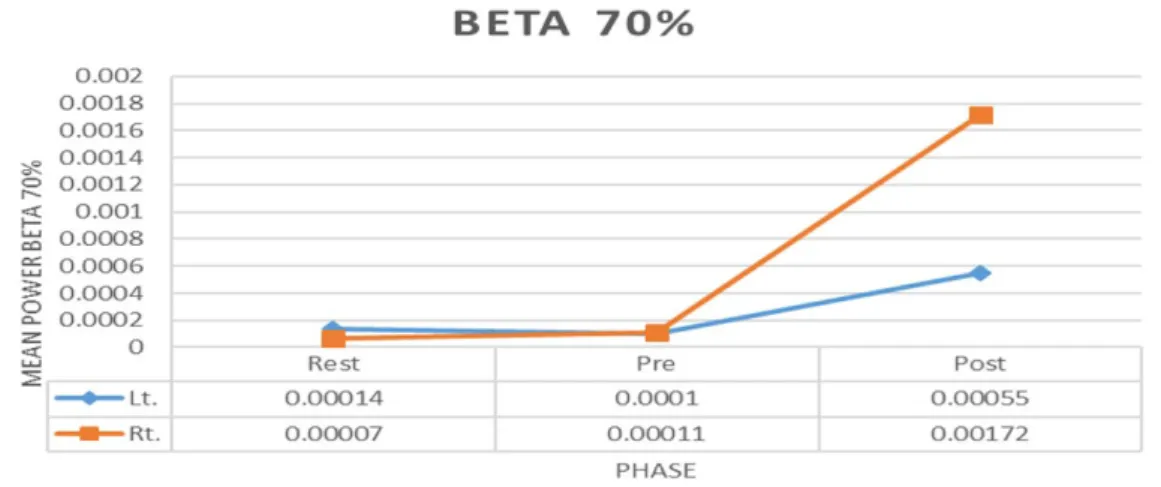
Power of beta band at 70% MVC was the same from rest to pre-fatigue state in left hemisphere, but increased in post-fatigue state. In right hemisphere, power increased slightly from rest to pre-fatigue condition, but increased prominently after fatigue state (Fig
-ure 5).
At 70% MVC, power of gamma band in left hemisphere showed an increase from rest to pre-fatigue and post-fatigue state very slowly. In right hemisphere, power increased slightly from rest to pre-fatigue condition, but raised
prominently in post-fatigue state (Figure 6). Paired T-Test for comparing mean power of EEG signals at resting state showed no signifi
-cant differences between two hemispheres in none of alpha, beta and gamma bands at 30% and 70% MVC.
Wilcoxon test was used to compare pre-fatigue state at both percent of MVC in three bands between right and left hemispheres. The result demonstrated significant differences between two hemispheres in pre-fatigue state of gamma band at 30% MVC (P=0.042). In
addition, Wilcoxon test revealed significant differences between two hemispheres in post-fatigue conditions of both beta and gamma bands at 70% MVC (P= 0.039, P=0.028, re
-spectively).
Discussion
The purpose of this study was to investi
-gate the effects of rest, muscle contraction and fatigue-induced protocol at 30% and 70% MVC on EEG bands (alpha, beta and gamma) of two brain hemispheres. Our results showed
no significant change between three states in all EEG bands; however, the trend of changes was remarkable in each band separately.
Alpha activity (8-13HZ) reflects a relaxed wakeful state and decreases with concentra
-tion, stimulation or visual fixation [12]. Alpha is the dominant feature in the EEG of human adults and can be recorded in widespread ar
-eas of cortex [7]. It is the most sensitive mea
-sure that could be used in detecting fatigue followed by theta and delta activities [12]. In the course of this study, during contraction
Figure 5: Mean power values of beta band in three phases at 70% MVC in right and left hemi
-spheres
Figure 6: Mean power values of gamma band in three phases at 70% MVC in right and left
and after fatigue induced at 30% MVC, alpha band of left hemisphere showed decrease of power from rest state to pre- fatigue condition, but no changes were seen from pre-fatigue to fatigue condition at 30% MVC. The probable reason of this finding is an increase of concen
-tration for muscle contraction in pre-fatigue state. In right hemisphere, there was not any change of alpha band power from rest to pre-fatigue state, but decreased from pre-pre-fatigue to fatigue condition. This unexpected change in alpha band activity of right hemisphere could be due to the transfer of activated centers from left hemisphere to the right hemisphere in fa
-tigue condition. In a previous study, Liu et al. showed that the EEG signal source of brain activation center shifts ipsilateral to the acti
-vated muscle in fatigue condition [1]. Reduc
-tion of alpha power activity has been shown in a prior study, and the authors stated that it is related to increased attention and alertness [7]. Therefore, transfer of activation center to right hemisphere with attention task of this hemisphere may be the cause of diminution of alpha band activity. Moreover, contraction and fatigue induced at70% MVC showed a very slightly decrease in the power of alpha band during pre-fatigue condition, but increased in fatigue state in both hemispheres similarly. As mentioned before, the reduction of alpha band power during muscle contraction is a demon
-stration of more brain alertness due to task de
-mand. Zardy et al. found mean power of alpha band was higher on low load task compared to high load task. They suggested that a higher load task requires more brain activity than low load task [12]. Also, increase of alpha band power in fatigue condition has been reported by many researchers [5, 12, 13], that can be indicative of the decrease of awareness during fatigue state. Findings related to alpha activity are very different in the past researches. Previ
-ous studies showed increase and decrease in alpha activity with decrease of attention and the onset of drowsiness. These changes de
-pend on factors such as site of scalp recording
and time measurements. Common pattern that was seen is the decrease or disappearance of alpha activity in occipital areas simultaneous
-ly or followed by increasing of alpha activity in central and frontal areas [14].
Beta activity (13-30Hz) is often associated with active thinking, concentration, alertness and anxious condition [15]. Also, beta activity increases during visual attention and is a char
-acteristic of a specific attention state of the vi
-sual system [16]. Significant coupling between brain signals and muscle especially on beta frequency has been reported during voluntary motor activity in healthy subjects [6]. In addi
-tion, the peak coherence of EEG and EMG has been reported at 11-36 HZ (mean 22HZ) and confirmed the functional importance of corti
-cal beta and gamma rhythms in motor com
-mands [17]. In this study at 30% MVC, left hemisphere beta activity did not change from rest to pre-fatigue condition, but decreased during fatigue state. Right hemisphere beta ac
-tivity increased at first during pre-fatigue, but reduced during fatigue condition. The trend of changes in beta band at 70% MVC was dif
-ferent from 30% MVC. Left hemisphere beta band power showed a slight decrease from rest to pre-fatigue state, but increased during fatigue condition. Right hemisphere changes showed an ascending trend from rest to pre-fatigue and pre-fatigue state. L.Cao et al. demon
-strated a decrease of EEG power at 25% MVC contraction and fatigue state in alpha, beta and gamma bands. They found EEG power at 50% MVC, 75% MVC and fatigue state were larger than 25% MVC. They suggested that handgrip force level may modulate the activity of brain on certain frequency bands [8]. In a study by Qi Y ang et al., EEG-EMG coherence was evalu
-ated during two stages of a sustained voluntary contraction; one with minimal and the other with severe fatigue. Their results showed that EEG beta band power increased with severe fatigue [7]. The Root Mean Square (RMS) of EEG signals increased during MVC of fa
were seen to be the greatest in beta band, and the lowest in gamma band [5]. In a more re
-cent study, an increase in motor unit coherence was observed on the beta frequency band after fatigue. It is assumed that the increase in the strength of correlated input of motor units as the muscle fatigues, is the cause of beta band activity enhancement [18]. We saw that left hemisphere beta band power decreased during pre-fatigue state, especially at 70% MVC. It was reported that beta activity is strongly re
-lated to motor behavior and generally attenu
-ated with active movements [19]. Beta waves are suppressed prior to or during movement changes [20]. Increase of beta band power in pre-fatigue state of both 30% and 70% MVC in right hemisphere may be due to active con
-centration [15]. Precise attention of subjects to force level indicator on screen of dynamom
-eter device might be the cause of this finding. Gamma activity (30 -60 HZ) is thought to represent binding of neurons together in a net
-work for applying a certain cognitive or mo
-tor function [21]. In this study, the trend of gamma band activity changes was very simi
-lar to beta rhythm. The power of gamma band at 30% MVC reduced in fatigue condition in both hemispheres, but increased the power seen in fatigue induced at 70% MVC. The effect of fatigue on gamma activity has been investigated in several studies. Yang Q et al. found the energy of beta and gamma bands de
-creased significantly with muscle fatigue [22]. Ca. L et al. showed the EEG power at fatigue induced at 25 % MVC was significantly lower than 75% MVC in gamma band [8]. Abdul
-latif et al. reported the RMS of EEG bands in
-creased in fatigue state, but they claimed the highest increase in EEG power was in beta band and the lowest increase was in gamma band [5]. As mentioned, the trend of gamma and beta rhythm changes during three phases were nearly similar in our study. Enhancement of gamma activity power has been described in motor areas during and prior to voluntary movement. Also, visual stimuli evoke the
largest early gamma responses [23]. Attention gamma band enhancement during presentation of a stimulus and suppression of alpha band activity were seen in another research [24]. It is believed one mechanism of gamma rhythm related to co-contraction of cells population from different areas of the brain cooperates in integration processing. Another gamma re
-lated rhythm mechanism is attention selection. It is possible that both mechanisms cooperated in our study. The population of cells may have been activated by attention mechanism, and at the same time synchronization of their activity has happened [16].
Comparing EEG activities in right and left hemispheres revealed that there was a signifi
-cant difference between two hemispheres in pre-fatigue state at 30% MVC in gamma band activity. Increase of mean power of gamma band in right hemisphere was unpredictable because the contraction of APM performed in right hand. There is no obvious reason for this finding, but the visual attention of the sub
-jects to force level indicator on screen of dy
-namometer device may be the cause. Heilman and Abell theorized the right hemisphere is dominant for visual attention [25]. In addition, enhancement of gamma activity is a sign of vi
-sual attention too [24]. Vi-sual concentration of the subjects to precise monitoring of the force level index would be the source of high gam
-ma band activity detected in right hemisphere in this study.
Significant differences between two hemi
-spheres in post-fatigue condition of both beta and gamma bands were also seen. In fatigue condition, mean power of beta and gamma ac
-tivities were higher in right hemisphere. In an earlier study, Liu et al. demonstrated that the activated center of the brain shifted toward the right hemisphere in fatigue state compared to non-fatigue condition (ipsilateral to the active muscle) [1]. They suggested the overall brain activation level to control the muscle contrac
-tion remained without any changes in fatigue condition. As a result, cortical activation cen
-ters in brain shifted significantly to maintain optimal output.
Conclusion
This study demonstrated muscle contraction and fatigue induced at 30% and 70% MVC had no significant effect on EEG bands; however, the trends of beta and gamma bands activities are almost similar in each percent of 30% and 70% MVC. Right brain hemisphere demon
-strates more activity than left hemisphere in gamma rhythm at 30% MVC in pre-fatigue state; hence, beta and gamma rhythms at 70% MVC in post-fatigue state. This can be an in
-dication that source location of activity shifts during the fatigue motor task.
Acknowledgment
The present article was extracted from a PhD. thesis written by Shohreh Taghizadeh and was financially supported by Shiraz University of Medical Sciences, Grant No: 92-6898.
Conflict of Interest
None
References
1. Liu JZ, Lewandowski B, Karakasis C, Yao B, Si-emionow V, Sahgal V, et al. Shifting of activation center in the brain during muscle fatigue: an ex-planation of minimal central fatigue? Neuroim-age. 2007;35:299-307. doi: 10.1016/j.neuroim-age.2006.09.050. PubMed PMID: 17236789. PubMed PMCID: 2701907.
2. Taylor JL, Gandevia SC. A comparison of central aspects of fatigue in submaximal and maximal voluntary contractions. J Appl Physiol (1985). 2008;104:542-50. PubMed PMID: 18032577. 3. Liu JZ, Yao B, Siemionow V, Sahgal V, Wang X,
Sun J, et al. Fatigue induces greater brain sig-nal reduction during sustained than prepara-tion phase of maximal voluntary contracprepara-tion.
Brain Res. 2005;1057:113-26. doi: 10.1016/j. brainres.2005.07.064. PubMed PMID: 16129419. 4. Peltier SJ, LaConte SM, Niyazov DM, Liu JZ, Sahgal
V, Yue GH, et al. Reductions in interhemispheric motor cortex functional connectivity after muscle fatigue. Brain Res. 2005;1057:10-6. doi: 10.1016/j. brainres.2005.06.078. PubMed PMID: 16140287.
5. Abdul-latif AA, Cosic I, Kumar DK, Polus B, Da Costa C, editors. Power changes of EEG signals associated with muscle fatigue: the root mean square analysis of EEG bands. Intelligent Sensors, Sensor Networks and Information Processing Con-ference; Melbourne, Australia: IEEE; 2004. 6. Yang Q, Fang Y, Sun CK, Siemionow V,
Ranga-nathan VK, Khoshknabi D, et al. Weakening of functional corticomuscular coupling during mus-cle fatigue. Brain Res. 2009;1250:101-12. doi: 10.1016/j.brainres.2008.10.074. PubMed PMID: 19028460. PubMed PMCID: 2655124.
7. Baumeister J, Reinecke K, Schubert M, Schade J, Weiss M. Effects of induced fatigue on brain activity during sensorimotor control. Eur J Appl Physiol. 2012;112:2475-82. doi: 10.1007/s00421-011-2215-6. PubMed PMID: 22057507.
8. Cao L, Hao D, Rong Y, Zhou Y, Li M, Tian Y. In-vestigating the modulation of brain activity asso-ciated with handgrip force and fatigue. Technol Health Care. 2015;23:S427-33. doi: 10.3233/THC-150979. PubMed PMID: 26410509.
9. Liu JZ, Zhang L, Yao B, Sahgal V, Yue GH. Fa-tigue induced by intermittent maximal volun-tary contractions is associated with significant losses in muscle output but limited reductions in functional MRI-measured brain activation lev-el. Brain Res. 2005;1040:44-54. doi: 10.1016/j. brainres.2005.01.059. PubMed PMID: 15804425. 10. Van Duinen H, Renken R, Maurits N, Zijdewind I.
Effects of motor fatigue on human brain activity, an fMRI study. Neuroimage. 2007;35:1438-49. doi: 10.1016/j.neuroimage.2007.02.008. PubMed PMID: 17408974.
11. Tanaka M, Watanabe Y. Neural compensation mechanisms to regulate motor output during physical fatigue. Brain Res. 2011;1395:46-52. doi: 10.1016/j.brainres.2011.04.041. PubMed PMID: 21550592.
12. Zadry HR, Dawal SZ, Taha Z. The relation be-tween upper limb muscle and brain activity in two precision levels of repetitive light tasks.
Int J Occup Saf Ergon. 2011;17:373-84. doi: 10.1080/10803548.2011.11076901. PubMed PMID: 22152503.
13. Kathner I, Wriessnegger SC, Muller-Putz GR, Kubler A, Halder S. Effects of mental workload and fatigue on the P300, alpha and theta band power during operation of an ERP (P300) brain-comput-er intbrain-comput-erface. Biol Psychol. 2014;102:118-29. doi: 10.1016/j.biopsycho.2014.07.014. PubMed PMID: 25088378.
fatigue during administration of a neuropsycholog-ical test battery. Clin Neurophysiol. 2012;123 :278-84. doi: 10.1016/j.clinph.2011.06.027. PubMed PMID: 21798799. PubMed PMCID: 3206198. 15. Baumeister J, Barthel T, Geiss K, Weiss M.
In-fluence of phosphatidylserine on cognitive per-formance and cortical activity after induced stress. Nutr Neurosci. 2008;11(3):103-10. doi: 10.1179/147683008X301478. PubMed PMID: 18616866.
16. Wrobel A. Beta activity: a carrier for visual atten-tion. Acta Neurobiol Exp(Wars). 2000;60:247-60. PubMed PMID: 10909182.
17. Mima T, Steger J, Schulman AE, Gerloff C, Hal-lett M. Electroencephalographic measurement of motor cortex control of muscle activity in hu-mans. Clin Neurophysiol. 2000;111:326-37. doi. org/10.1016/S1388-2457(99)00229-1. PubMed PMID: 10680569.
18. McManus L, Hu X, Rymer WZ, Suresh NL, Lowery MM. Muscle fatigue increases beta-band coher-ence between the firing times of simultaneously active motor units in the first dorsal interosse-ous muscle. J Neurophysiol. 2016;115 :2830-9. doi: 10.1152/jn.00097.2016. PubMed PMID: 26984420. PubMed PMCID: 4922605.
19. Pfurtscheller G, Lopes Da Silva FH. Event-related EEG/MEG synchronization and desynchronization: basic principles. Clin Neurophysiol. 1999;110
:1842-57. doi: 10.1016/S1388-2457(99)00141-8. PubMed PMID: 10576479.
20. Baker SN. Oscillatory interactions between sen-sorimotor cortex and the periphery. Curr Opin Neurobiol. 2007;17:649-55. doi: 10.1016/j. conb.2008.01.007. PubMed PMID: 18339546. PubMed PMCID: 2428102.
21. Niedermeyer E, Da Silva FL. Electroencephalogra-phy: basic principles, clinical applications, and re-lated fields. London: Lippincott Williams & Wilkins; 2005.
22. Siemionow V, Sahgal V, Yue GH. Single-Trial EEG-EMG coherence analysis reveals muscle fatigue-related progressive alterations in corti-comuscular coupling. IEEE Trans Neural Syst Rehabil Eng. 2010;18:97-106. doi: 10.1109/TN-SRE.2010.2047173. PubMed PMID: 20371421. 23. Buzsaki G. Rhythms of the Brain. New York:
Ox-ford University Press; 2006.
24. Siegel M, Donner TH, Oostenveld R, Fries P, En-gel AK. Neuronal synchronization along the dorsal visual pathway reflects the focus of spatial atten-tion. Neuron. 2008;60:709-19. doi: 10.1016/j.neu-ron.2008.09.010. PubMed PMID: 19038226. 25. Heilman KM, Van Den Abell T. Right hemisphere
dominance for attention: the mechanism underly-ing hemispheric asymmetries of inattention (ne-glect). Neurology. 1980;30:327-30. doi: 10.1212/ WNL.30.3.327. PubMed PMID: 7189037.