Superannuation and Private Equity
A research paper on superannuation fund investment in private equity
MAY 2006
CPA Australia
www.cpaaustralia.com.au
T 1300 73 73 73 CPA31920 05/06BUSINESS MANAGEMENT
First published 2006 CPA Australia ACN 008 392 452 385 Bourke Street Melbourne Victoria 3000 Australia ISBN 1 876 874 929 Copyright
© CPA Australia (ABN 64 008 392 452), 2006. All rights reserved.
Save and except for third party content, all content in these materials is owned or licensed by CPA Australia (ABN 64 008 392 452) Other than for the purposes of and subject to the conditions prescribed under the Copyright Act 1968 (Cth) (or any other applicable legislation throughout the world), or as otherwise provided for in this copyright notice, no part of these materials may in any manner or any medium whether now existing or created in the future, (including but not limited to electronic, mechanical, microcopying, photocopying or recording) be reproduced, adapted, stored in a retrieval system, transmitted or communicated to the public without
CPA Australia is the largest professional organisation in Australia with more than 110,000 members of the accounting and business profession in Australia and overseas. Its pre-eminent position is maintained through CPA Australia’s commitment to quality, ethics, rigorous codes of conduct and continued professional development programs for members.
Our mission is for CPAs to be leaders in fi nance, accounting and business advice. Our vision is for the CPA designation to be the most valued designation for fi nance, accounting and business advisory professionals.
CPA Australia’s primary role in achieving this is to support members through education, training and technical advice. It also represents the interests of members to state and federal government and to industry, academia and the general public. This is achieved by working with members, local and international bodies, on public policy, government relations, communications and marketing activities.
1
1
Table of contents
About the Authors 2
Executive Summary 3
About this Survey 4
Who was surveyed 4
The sample 4
Survey method 4
Detailed Findings
1 Introduction 5
1.1 Background – superannuation and private equity 5
2 Organisation of the asset allocation decision 6
2.1 Is there an investment committee? 6 2.2 Size and member breakdown of the investment committee? 6 2.3 Relative infl uence of the types of committee members
3 Criteria for evaluation of asset consultants 7
4 Infl uences on commitment to private equity 8
4.1 Positive infl uences 8 4.2 Negative infl uences 9
5 Allocation between domestic and foreign private equity 10 6 The expected impact of the introduction of choice in superannuation 11
About the Survey
About the Authors
Sacha Vidler is a lecturer in fi nance at the University of Western Sydney.
3
About the Survey
Executive Summary
Summary of fi ndings
Organisation of the asset allocation decision
• Superannuation funds allocate between zero to over 10 per cent of their funds to private equity.
• Funds in the survey were evenly split between those that did, and those that did not, have an investment committee separate from the full board of trustees. The size of the committee ranged from 3 to 14 members. The numbers of trustees, employees and consultants involved also varied widely, though trustees were the most numerous.
• Respondents, generally, regarded trustees as the most infl uential members of the committee, with consultants and employees rated approximately evenly.
Criteria for evaluation of asset consultants
• Asset consultants were evaluated primarily on the basis of reputation, then past performance and then methodology. Cost received a low average rating.
Infl uences on commitment to private equity
• Factors most likely to result in superannuation funds giving a higher allocation to private equity were: - the prospect of better returns than listed equities;
- superior management providing abnormal returns; and
- private equity returns having a lower correlation with the returns of other major asset classes which reduces the overall variation of returns.
Rated least relevant were factors indicating a commitment on the part of either fund members or fund trustees to local economic development.
• The factors most likely to discourage superannuation fund investment in private equity were: - the level of competition (between private equity funds for quality deals) in the market; - the low level of liquidity; and
- the long maturity.
• Factors rated least relevant to discourage superannuation fund investment in private equity included: - diffi culties applying statistical analysis techniques to private equity data;
- private equity being viewed as part of an ‘alternate’ asset class including hedge funds and infrastructure; - the skills of the asset consultant.
Factors infl uencing domestic versus foreign allocation in private equity
• The relative size and maturity of foreign markets were important factors when funds were deciding whether to invest in foreign or domestic markets. Additional costs associated with foreign investment received a reasonably high rating. Interest in supporting local economic development and relatively high recent economic growth in Australia both received very low ratings.
Expected impact of choice in superannuation
• Choice in superannuation was expected to have a negative impact on allocations to private equity due to individuals being risk averse and wanting greater investment liquidity.
About the Survey
About this Survey
This report presents the fi ndings of an exploratory study conducted by the University of Western Sydney during May and June 2005 funded by CPA Australia
Who was surveyed
An invitation to participate in the survey was sent by email to the investment managers (or CEOs) of a range of superannuation funds each with over $1 billion in assets.
The sample
The sample consisted of a targeted group of 40 large industry, corporate and public sector funds and eleven responses were received. The group of respondents represents around $70 billion in superannuation assets, which is approximately 10 per cent of industry assets, including small fund assets.
Survey method
The survey relied largely on Likert Scale valuation questions which asked respondents to rate their level of agreement with a given statement.
The survey asked respondents a series of questions concerning:
• How the fund makes its asset allocation decision, and in particular, whether or not it had a formal investment committee; • The break-down of type of members (trustees, employees, consultants and others) on this committee;
• The relative level of infl uence of each type of member of the committee; • The criteria used to evaluate asset consultants;
• Factors which encourage an allocation to private equity; • Factors which discourage an allocation to private equity;
• Factors which encourage an allocation to foreign private equity as opposed to domestic; and • The expected impact of ‘choice of fund’ on the allocation to private equity.
5
About the Survey
1. Introduction
Background – superannuation and private equity
Superannuation funds stand apart from other Australian fi nancial institutions such as banks and general insurance, due to the level of assets held in equities. Historically, equities have been more volatile and provided higher returns than interest bearing deposits and securities. However, investment in equities by superannuation funds is largely focused on publicly listed equities (APRA, 2004). This tends to restrict equity investment by superannuation funds to relatively large and mature fi rms, especially the top one hundred companies listed on the ASX (Coates, 2003). The Reserve Bank of Australia observes a strong positive relationship between market capitalisation and liquidity, which suggests that pension fund investment in equities is broadly aligned with non-pension investment in equities (RBA, 2002).
However, capital formation is a process that does not begin with public listing. It has long been recognised that gaps in the commercial funding market in Australia are particularly notable at the innovation, establishment and business expansion stages (Marsden Jacob Associates, 1995). A stronger private equity market would help to address this funding gap and this could increase the depth and effi ciency of listed markets by improving the fi nancial ‘path to market’ for growing fi rms. Superannuation funds have characteristics that arguably make them ideal vehicles to channel some of the considerable fl ow of mandated contributions (over $1 billion net per month) into private equity:
• they have long-term investment horizons; • they pool risks across many investors; and • they can diversify widely.
Indeed, there were hopes around the time compulsory superannuation was introduced that it might contribute to increased investment in venture capital (Jones, 1992: 85). Some submissions to the Wallis Inquiry went so far as to suggest that investment in small to medium enterprises (SMEs) should be mandatory (FSI, 1997: 513-4). Not surprisingly, the Inquiry rejected these suggestions, due to the expected ‘detrimental impact on capital market effi ciency’.
Superannuation commitment to alternate investments including private equity remains marginal, falling to 1.8 per cent in June 2004 (APRA, 2004). In June 2003, investment in domestic private equity1 represented a relatively small proportion of
superannuation investment at $3.3 billion, or around 0.6 per cent of total assets (ABS, 2004). However, the $3.3 billion does represent nearly half of the total pool of $7.5 billion raised for private equity in Australia. Superannuation is by far the largest single source of funds for private equity funds, with banks a distant second at $825 million, and ‘fund of funds’ (likely also including superannuation assets) third at $644 million (ABS, 2004).
The level of commitment to private equity from superannuation funds is also rising. The latest data show an improvement on 2000, when $1.7 billion had been invested, representing 0.4 per cent of superannuation assets and 35 per cent of venture capital assets at that time (ABS, 2004). The aggregate fi gures also conceal important details about superannuation investment in private equity. Superannuation funds are not homogenous. There are several distinct types of ‘non-small’ funds2, refl ecting the phased evolution of the current system. Differences in asset allocation are apparent between types of
funds, and between funds of the same type.
A review of superannuation annual reports shows that the percentages of assets allocated to private equity varies quite widely, from zero to over 10 per cent. If allocations to private equity of 5 (or 10) per cent were generalised it would increase the size of the private equity funding market by 5 (or 10) times and such a change would have an obvious positive impact on the availability of risk capital.
The key to understanding low aggregate asset allocation to private equity is understanding why a majority of funds allocate nothing or almost nothing to it.
1. The data is drawn from a survey of Australian private equity funds. Total investment by superannuation funds in private equity, including foreign holdings, may be several times higher than this fi gure.
About the Survey
2. Organisation of the asset allocation decision
The questionnaire explored several questions relating to how the asset allocation decision was organised by the superannuation fund:
• whether the fund had a formal body such as an investment committee which had responsibility for formulating strategic asset allocation policy;
• the number of trustees, employees and consultants, in this group; and • the relative infl uence of each type of member in this group.
There was considerable variation among the respondents with regard to whether or not there was a body such as an investment committee formally charged with carrying out investment allocation decisions, the size and structure of the committee, and the relative infl uence of types of members of the committee.
2.1 Is there an investment committee?
The responses were split close to evenly: • No formal investment committee
Approximately half of the respondents had no formal structure such as an investment committee. Most respondents in the group without a formal structure category noted that either the full board of trustees, or a sub-group of trustees, made all decisions but generally took advice from employees and/or consultants.
• Formal investment committee
The remaining respondents had an investment committee that included members other than trustees. Several respondents in this category volunteered information regarding the relationship of this group to the full board of trustees, generally indicating that it was the full board of trustees who had ultimate responsibility and authority.
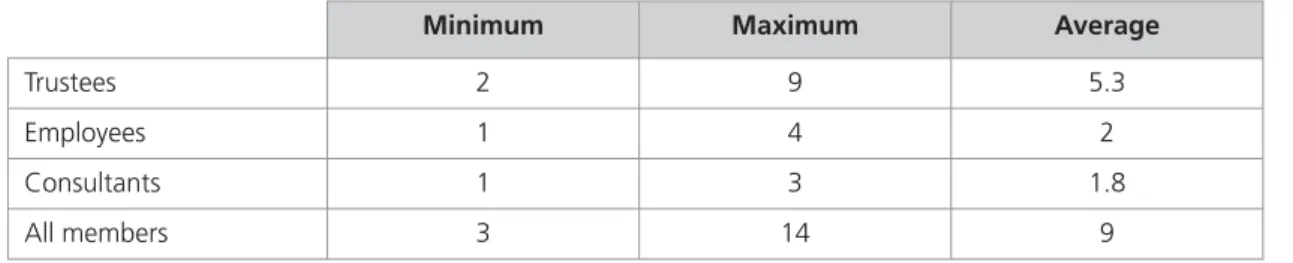
2.2 Number of members and member breakdown of the investment committee
The number of members of the investment committee varied widely (see Table 2.1). Of the respondents that did have a formal investment committee, the number of members of the committee ranged from 3 to 14. The breakdown of members by type also showed signifi cant variation. The number of trustees ranged from 2 to 9, averaging 5.3; employee numbers ranged from 1 to 4, averaging 2; and consultant numbers ranged from 1 to 3, averaging 1.8.
A respondent representing a corporate fund noted that the corporation (as employer of the fund members and fund sponsor) was highly infl uential in respect of fund administration and investment policy.
Table 2.1. Breakdown of number of members of investment committee by type
Minimum Maximum Average
Trustees 2 9 5.3
Employees 1 4 2
Consultants 1 3 1.8 All members 3 14 9
2.3 Relative infl uence of the types of committee members
Respondents from funds with a formal investment committee were asked to rate the relative infl uence of the trustees, employees, consultants and others in the investment committee from ‘great’ (coded 4) to ‘zero’ (coded 0). Around two-thirds of the respondents in this category gave answers which suggested equal, or close to equal, infl uence for all three groups. On
7
About the Survey
3. Criteria for evaluation of asset consultants
Respondents were asked to rate the importance of criteria for evaluating asset consultants from ‘great’ (coded 4) to ‘zero’ (coded 0) (Table 3.1). The overall average rating of all listed criteria was reasonably high (2.5). Reputation was rated the most important criterion, followed by historical performance and methodology.
The cost of private equity fund management ranked last on average: all respondents ranked cost last or second last. The responses suggest that demand for asset consulting services is driven by quality considerations, including the perceived effectiveness of the relationship.
Table 3.1. Criteria for evaluation of asset consultants
Minimum Maximum Average
Reputation 2 4 2.875 Methodology 1 4 2.75 Historical performance 0 4 2.625
About the Survey
4.1 Positive infl uences
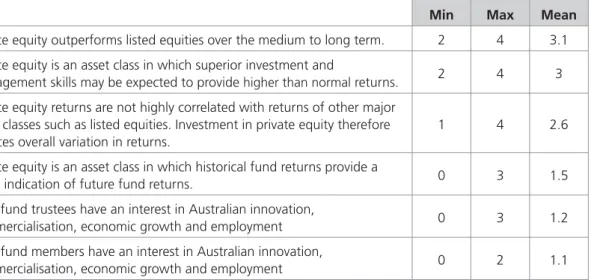
Respondents were asked to rate the infl uence of a number of factors which might encourage them to increase their allocation to private equity (Table 4.1). Respondents rated factors suggesting private equity would provide high or abnormal returns the most important. Also signifi cant, though at a lower level, was correlation with other asset classes.
Rated least relevant were factors indicating a commitment on the part of either fund members or fund trustees to local economic development. Respondents also gave a very low rating to the relative predictability of future returns based on past returns. This is an interesting result as there is evidence that one of the attractions of private equity is that successful returns in private equity funds have a self-reinforcing characteristic, whereas consistently outperforming the index (after costs) in competitive listed markets is much less likely. A couple of explanations for the self-reinforcing characteristic are that fi rms looking for equity fi nance tend to target the most successful venture capital fi rms, and that superior methodology and experience may contribute to consistently higher than normal profi ts.
Table 4.1. Factors that encourage decision makers to make a higher allocation to private equity
Min Max Mean
Private equity outperforms listed equities over the medium to long term. 2 4 3.1 Private equity is an asset class in which superior investment and
management skills may be expected to provide higher than normal returns. 2 4 3 Private equity returns are not highly correlated with returns of other major
asset classes such as listed equities. Investment in private equity therefore reduces overall variation in returns.
1 4 2.6 Private equity is an asset class in which historical fund returns provide a
good indication of future fund returns. 0 3 1.5 Your fund trustees have an interest in Australian innovation,
commercialisation, economic growth and employment 0 3 1.2 Your fund members have an interest in Australian innovation,
commercialisation, economic growth and employment 0 2 1.1 Other suggested infl uences:
‘access a broader economic exposure than is available from listed markets’ ‘access to increased opportunity set’
9
About the Survey
4. Infl uences on commitment to private equity
4.2 Negative infl uences
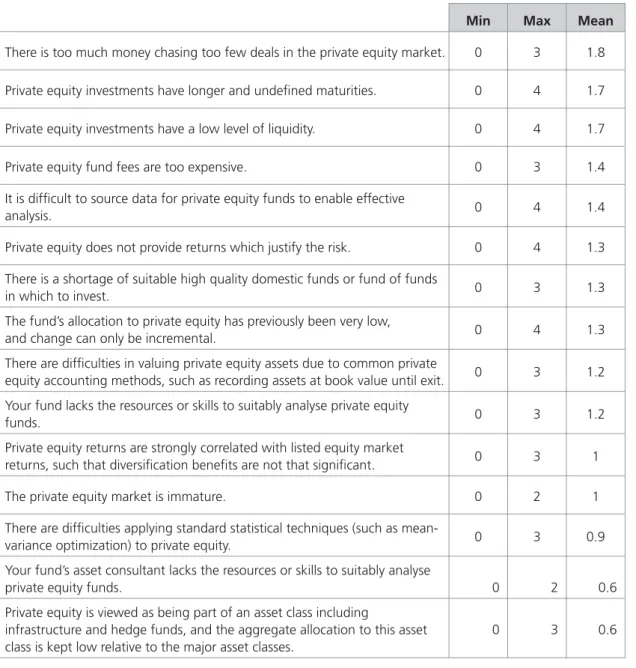
Respondents were asked to rate the level of infl uence of 15 factors which might discourage an allocation to private equity (Table 4.2). The strongest fi nding was that there is little agreement about what discourages investment in private equity. The average rating for all factors combined was relatively low, at 1.2. In addition, all factors were given a rating of 0 by at least one respondent. The factors which received the highest average rating related to:
• the level of competition (between private equity funds for quality deals) in the market; • the low level of liquidity; and
• the long maturity for private equity investments. Factors which received very low average scores included:
• diffi culties applying statistical analysis techniques to private equity data;
• private equity being viewed as part of an ‘alternate’ asset class including hedge funds and infrastructure; and • the asset consultant lacking the skills or resources to suitably analyse private equity funds
Interesting qualitative comments included an expression of dissatisfaction with the level of fees from certain funds, seemingly connected with notable successes in some management buy-out (MBO) funds. Another interesting comment highlighted a structural issue in private equity; namely, the difference between commitments and draw-downs which refl ects the slow build-up of a quality private equity portfolio. The aspect that frustrated the respondent was the necessity to signifi cantly over-commit to private equity to achieve a given target allocation, while paying what was considered to be relatively high fees on the entire allocation.
Table 4.2. Factors which encourage decision makers to make a lower allocation to private equity
Min Max Mean
There is too much money chasing too few deals in the private equity market. 0 3 1.8 Private equity investments have longer and undefi ned maturities. 0 4 1.7 Private equity investments have a low level of liquidity. 0 4 1.7 Private equity fund fees are too expensive. 0 3 1.4 It is diffi cult to source data for private equity funds to enable effective
analysis. 0 4 1.4
Private equity does not provide returns which justify the risk. 0 4 1.3 There is a shortage of suitable high quality domestic funds or fund of funds
in which to invest. 0 3 1.3 The fund’s allocation to private equity has previously been very low,
and change can only be incremental. 0 4 1.3 There are diffi culties in valuing private equity assets due to common private
equity accounting methods, such as recording assets at book value until exit. 0 3 1.2 Your fund lacks the resources or skills to suitably analyse private equity
funds. 0 3 1.2
Private equity returns are strongly correlated with listed equity market
returns, such that diversifi cation benefi ts are not that signifi cant. 0 3 1 The private equity market is immature. 0 2 1 There are diffi culties applying standard statistical techniques (such as
mean-variance optimization) to private equity. 0 3 0.9 Your fund’s asset consultant lacks the resources or skills to suitably analyse
private equity funds. 0 2 0.6 Private equity is viewed as being part of an asset class including
infrastructure and hedge funds, and the aggregate allocation to this asset class is kept low relative to the major asset classes.
About the Survey
5. Factors infl uencing domestic versus
foreign allocation in private equity
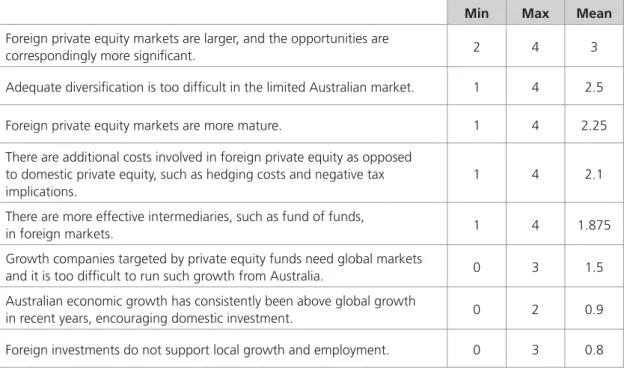
Respondents were asked to rate a series of factors which might infl uence the decision to invest in domestic or foreign private equity (Table 5.1). There was a clear indication in the responses that the relative size and maturity of foreign markets were important factors to be considered when making this decision. Additional costs associated with foreign investment received a reasonably high rating. Interest in supporting local economic development and relatively high recent economic growth in Australia both received very low ratings.
The implication of responses to this question is that superannuation funds believe that the Australian private equity markets offer less opportunity and choice. This often results in a decision to invest in foreign private equity markets.
Table 5.1. Factors which infl uence decision makers regarding the level of foreign compared to domestic private equity
Min Max Mean
Foreign private equity markets are larger, and the opportunities are
correspondingly more signifi cant. 2 4 3 Adequate diversifi cation is too diffi cult in the limited Australian market. 1 4 2.5 Foreign private equity markets are more mature. 1 4 2.25 There are additional costs involved in foreign private equity as opposed
to domestic private equity, such as hedging costs and negative tax implications.
1 4 2.1 There are more effective intermediaries, such as fund of funds,
in foreign markets. 1 4 1.875 Growth companies targeted by private equity funds need global markets
and it is too diffi cult to run such growth from Australia. 0 3 1.5 Australian economic growth has consistently been above global growth
in recent years, encouraging domestic investment. 0 2 0.9 Foreign investments do not support local growth and employment. 0 3 0.8
11
About the Survey
6. The expected impact of the introduction
of choice in superannuation
Respondents were asked to rate two possible ways in which the introduction of greater choice and competition in the superannuation market might infl uence the allocation to private equity (Table 6.1). ‘Individuals being more risk averse’ received a higher average rating than ‘individuals being more discouraged than fund managers by lower liquidity’. However, neither factor received an average rating of over 2.
One respondent commented that he expected the movement to choice would increase investment in private equity as individuals are less risk averse than professional investors. The respondent also noted that fund trustees might have to reduce their allocation to private equity because illiquid investments were incompatible with the new choice of fund regime.
Table 6.1. The impact of choice on the allocation to private equity
Min Max Mean
Individuals are more risk averse than professional investors, so more choice
will lead to a decline in superannuation investment in private equity. 0 3 2 Choice will reduce investment in private equity because individuals will be
put off by low liquidity and an inability to ‘mark to market’ to a greater extent than professional investors.
About the Survey
ABS (Australian Bureau of Statistics), 2003, Venture Capital 2002-03 Cat. 5678.0, ABS. Available online at www.abs.gov.au.
APRA (Australia Prudential Regulatory Authority), 2004, Superannuation Statistics, APRA. Available online at www.apra.gov.au
Coates, N. 2003, Pension Funds and the Internationalisation of Insurance Companies: An Australian Example, in M. Lonnborg, M. Olsson, M. Rafferty, and Nalson, I., Money and Finance in Transition, Sodertorn Academic Press, Stockholm.
Coates N. & S. Vidler, 2005, Title to come soon, AEGIS Working Paper, AEGIS, UWS Sydney. Accessible online at http://aegis.uws.edu.au/
Dawkins, J., 1992, Strengthening super security: new prudential arrangements for superannuation, AGPS, Canberra. FSI (Financial System Inquiry), 1997, Financial System Inquiry Final Report, (Mr S. Wallis, Chairman), AGPS, Canberra. Available online at http://fsi.treasury.gov.au/content/publications.asp
Fitzgerald, V.W., 1993, National Saving: A Report to the Treasurer – Executive Overview, Australian Government Publishing Service, Canberra.
Howe, B., 1989, Reform of social security policies and administration, 1983–1990, AGPS, Canberra.
Jones, R., 1992, ‘Superannuation and the fi nancing of risky investment’ in K. Davis and I. Harper (eds), Superannuation and the Australian Financial System, Allen & Unwin, St. Leonards, pp. 84–100.
Marsden Jacob Associates, 1995, Financing Growth: Policy Options to Improve the Flow of Capital to Australia’s Small and Medium Enterprises, National Investment Council, Australian Government Publishing Service, Canberra.