AGRONOMY AND SOILS
A Deficit Irrigation Trial in Differing Soils Used To Evaluate
Cotton Irrigation Scheduling For The Mid-South
Timothy J. Grant, Brian G. Leib, Heath A. Duncan, Chris L. Main, and David A. Verbree
T.J. Grant* and B.G. Leib,Biosystems Engineering and Soil Science, University of Tennessee, Knoxville, TN. 37996; H.A. Duncan, Fulghum, MacIndoe, & Associates, Inc., Knoxville, TN; C.L. Main, DOW AgroSciences, LLC, Medina, TN; and D.A. Verbree, Verbree International, Webster, NY.
*Corresponding author: [email protected] ABSTRACT
Cotton (Gossypium hirsutum L.) irrigation
management in the humid Mid-South is compli-cated by unpredictable rainfall and significant soil variability. Producers of irrigated cotton need guidance with making irrigation decisions to create conditions for optimal yield while efficiently man-aging irrigation water use. The objectives of this study were to demonstrate cotton yield response to varying irrigation across differing soils and to evaluate the ability of a water balance approach, and the use of soil moisture sensors to guide sound irrigation decisions. A three-year study was con-ducted in Jackson, TN where cotton was grown on soils ranging from primarily sandy-textured to deep silt loam soils and was drip-irrigated under several irrigation regimes. Three years of differing rainfall patterns demonstrated a need for different irrigation management between soils to optimize cotton yield each year. Sandy soils needed irriga-tion at a higher rate each year and an earlier initia-tion two of three years. A deficit between applied water and crop water use was especially important in silt loam soils, which required more judicious application of irrigation. A water balance approach to irrigation scheduling was a good indicator of soil and crop water status in sandy and silt loam soils. Soil moisture sensors often reflect the status of the water balance, however, in some cases soil moisture sensors could have triggered unnecessary irrigation based on suggested irrigation thresholds. While each method of irrigation scheduling has
shortcomings, using a water balance in conjunc-tion with soil moisture sensors is recommended, such that each can verify the other.
I
rrigation of cotton in the Mid-South and Southeastern United States (US) has become an attractive option to protect against potential yield loss associated with irregular rainfall and episodic drought periods (Salazar et al., 2012; Schaible and Aillery, 2012). Irrigated cotton acreage in Tennessee(TN) has grown steadily over the last five to ten
years, but still ranks well short of irrigated acreage in neighboring states (Gwathmey et al., 2011). In fact, according to the 2012 Census of Agriculture, only 6% of cotton acreage in Tennessee was irrigated, while neighboring states Arkansas, Louisiana, Mississippi, and Georgia irrigated 28-85% of cotton acreage (United States Department of Agriculture). The primary reason for the relatively small amount of irrigated cotton acreage in TN may be a lack of research-based understanding of appropriate irrigation management, i.e. water input required, and timing of application (Zhou et al., 2015). Tennessee shares challenges with other Mid-South and Southeastern US states in cotton irrigation management including irregular rainfall, yearly climactic variability, short growing season, soils with
differing water holding capacity, soils with shallow
root-limiting layers, and high degrees of variation in
soils within fields (Vories and Evett, 2014).
Deficit irrigation has often proven to optimize cotton yields, while improving water use efficiency
over full irrigation, i.e. full replenishment of evapo-transpiration (ET) (Basal et al., 2009; Bronson et al., 2006; Tar et al., 1998). It has also been noted that water excess, along with stress-inducing water
deficit, can be detrimental to yield (Balkcom et al.,
2006; Geerts and Raes, 2009; Tar et al., 1998). In the
Mid-South, deficit irrigation strives to apply water
at a rate slightly below full ET, but its
implementa-tion may be considerably different than in more arid regions. Deficit irrigation in the Mid-South should
take into account soil moisture carry-over from spring rains, often frequent in-season rainfall, and soil response to, and retention of rainfall. As in more
arid regions, deficit irrigation has proven the optimal
least amount of irrigation input in the Southeast and Mid-South (AbdelGadir et al., 2011; Dougherty et
al., 2009; Pettigrew, 2004). It is important to note,
however, that while irrigation is expected to improve cotton yields in slightly over half of years in the
Mid-South, rainfall in some years can be sufficient to
optimize cotton yields without supplemental irriga-tion (AbdelGadir et al., 2011; Gwathmey et al., 2011). A critical question from producers’ perspective in
implementing deficit irrigation is how much water to
apply and when to do so. Cotton water requirements are commonly based on replacement of water loss to evapotranspiration, whether through estimation or direct measurement (Bronson et al., 2006; Kebede
et al., 2014). Irrigating to achieve a slight deficit
compared to full ET is commonly found to be the best strategy, with optimal ET replacement values
ranging from 74%-94% in more arid regions (Basal
et al., 2009; Bronson et al., 2006; Tar et al., 1998) and around 75% in the humid Mid-South (AbdelGadir et al., 2011). Irrigation scheduling tools often use the water balance or checkbook approach when making irrigation decisions. In Tennessee, a spreadsheet-based tool, Management of Irrigation Systems in Tennessee (MOIST), is used by producers (Univ. of Tennessee, Knoxville, TN). MOIST calculates ET using the Turc method and FAO (Food and Agriculture Organization
of the United Nations) crop coefficients with weather
data from a station central to west TN.
Location-specific rainfall and irrigation is entered and actual soil
water depletion is compared to allowable soil water
depletion, based on soil, crop, irrigation efficiency
and other MOIST input parameters. This method is not free of error, however. A water balance approach
depends on accurate measurements of effective rain -fall, irrigation and crop water use. A water balance also does not account for confounding factors such as a shallow water table or subsurface water movement contributions. Soil moisture sensors can provide an additional perspective.
Soil moisture sensors are becoming more widely used by Mid-South cotton producers (Kebede et
al., 2014). When installed at multiple depths, these
sensors can give a producer a sense of water status
throughout the soil profile. Used in conjunction with
the water balance method, soil moisture sensors can
provide verification of the status the water balance.
Using soil water tension measurements as trigger points for irrigation decisions is a strategy often used, however, recommendations on what values to use as trigger points vary. Leib et al. (2015), recommend
setting irrigation thresholds at tensions of -30 to
-40 kPa (cbar) in sandy loam soils and between -40
and -60 kPa in silt loam soils. Leib et al. (2015) also noted the importance of factors such as sensor site selection and placement, growth stage, and sensor depths. Vellidis et al. (2008) recommended trigger
points of -40 kPa in the upper part of the soil profile and -50 kPa deeper in the profile. Flynn and Barnes
(1998) observed optimal yield and water use when using a trigger of -60 kPa. Potential errors in using soil moisture sensors include faulty sensors giving erroneous readings, inadequate soil contact with the sensor, and localized soil irregularities (Leib et al.,
2015; Kebede et al., 2014).
Studies have consistently shown positive yield and/or quality response of cotton to more frequent and lower volume water applications, irrigating multiple times per week as opposed to once every week or two (Chu et al., 1995; Enciso-Medina et al., 2000; Hunsaker et al., 1998). Gwathmey et al. (2011) and Duncan (2012) explored how much water TN cotton producers should expect to apply per irrigation to
opti-mize yield. During critical growth stages between first square and cracked boll, approximately 40-120 days
after planting, deep silt loam soils can be expected to respond to irrigation when rainfall <280 mm, a scenario expected to happen around 60% of years, according to historical rain in West TN (Gwathmey et al., 2011). Probability of response to irrigation can also increase with increasing irregularity of rainfall during the growing season, and as soil water holding capacity (WHC) decreases (Duncan, 2012).
Appropriate initiation timing of irrigation for cotton in TN needs research attention, as lack of knowledge could be limiting adoption of irrigation in the state. Irrigation before squaring is discouraged, and can actually limit yield (Buttar et al., 2007; Wan-jura et al., 1996). Considering likely soil moisture carry-over from spring, irrigation in the Mid-South
should not be required before squaring. From first square to first bloom, Snowden et al. (2014) found that significant water stress could lower yield, but fiber quality remained similar to well-watered treat -ments. Dekock et al. (1990), however, found cotton exposed to water stress during squaring was able to recover and yield similarly to well-watered cotton.
Barber and Francis (2011) identified the week prior to first flower as a critical time to have sufficient crop
available water. Studies are in agreement that once
diminished by damaging water stress conditions (Carvalho et al., 2015; Dekock et al., 1990; Snowden
et al., 2014). In the Mid-South, appropriate initiation
timing could vary depending on soil WHC. Low WHC soils could require earlier initiation because of their drainage loss of spring rain and/or smaller overall carry-over from spring rains. Duncan (2012), points out that irrigation decisions (amount and ini-tiation time) for TN cotton producers depend heavily
on site-specific soil properties.
Soil WHC variability, due to differential texture
or depth to a restrictive soil layer, is known to have
a significant impact on yield of cotton, whether ir
-rigated or not (Booker et al., 2014; Ping and Green,
2000; Vories et al., 2015). Cotton yield response to irrigation in high WHC soils has been found to follow a positive quadratic function (Balkcom et al., 2006; Geerts and Raes, 2009; Gwathmey et al., 2011), while in sandy soils, yield tends to respond linearly to irrigation (Bronson et al., 2006; Detar, 2008; Tar et al., 1998). Research has consistently shown a need for higher water application in low WHC soils, compared to high WHC soils, to optimize cotton yield (English et al., 2002; Evans et al., 2013;
Hagh-verdi et al., 2015), because of less inherent buffer in
soil water or excessive drainage of soil water in a situation where soil texture is the primary cause of low WHC (Longwell et al., 1963). Cotton irrigation management across various soils in the Mid-South is complex because of early-season soil moisture carry-over and judgement of in-season rainfall
ef-fectiveness (Vories and Evett, 2014). Determining
how irrigation decisions should be approached
differently in various soils is of utmost importance
to TN cotton producers with irrigation capability (Duncan, 2012; Haghverdi et al., 2015). The objec-tives of this study were to demonstrate cotton yield response to a range of irrigation regimes in soils
differing in WHC, and to evaluate the potential of a
water balance approach and soil moisture sensors to successfully demonstrate irrigation need.
MATERIALS AND METHODS
The effect of varying levels of deficit irriga -tion on cotton yield in various soils was evaluated
in a three-year field study in Jackson, TN, at the
West Tennessee Research and Education Center (WTREC). Soils of the test site were a
Ruston-Dexter-Lexington complex. These soils are classified
as Fine-loamy, siliceous, semiactive, thermic Typic
Paleudults, Fine-silty, mixed, active, thermic Ultic Hapludalfs, and Fine-silty, mixed, active, thermic Ultic Hapludalfs, respectively. While the soils all shared a silt cap layer over a primarily sand layer,
they differed significantly in depth to sand and WHC.
For the purposes of the study, soils were grouped based on electrical conductivity, ground-penetrating radar, and soil cores. The process of grouping soils of this test site is described in detail by Duncan (2012). Cotton (PHY375) was planted in a no-till crop-ping system on 5 May 2010, 12 May 2011, and
24 April 2012. Plots were six rows wide by 9.1 m
long. Row spacing was 97 cm. Nitrogen fertilizer was applied each year according to University of Tennessee recommendations for cotton production. Phosphorus (P) and potassium (K) application was dependent on University of Tennessee (UT) soil test recommendations from soil samples taken from study site. Management of the cotton crop, includ-ing pest management, growth regulator application, and application of defoliants followed UT Extension guidelines for cotton production.
The drip irrigation system was installed after cotton plants had emerged by placing the drip tape on the soil surface; one line of drip tape was placed
alongside each row of cotton. Three flow ratings of
drip tape were used to simultaneously apply three
rates, 3.81, 2.54, and 1.27 cm/wk. Irrigation was ap -plied three days per week, if necessary, as research has shown high-frequency, low-volume applications to yield higher than low-frequency, high-volume ap-plications (Enciso-Medina et al., 2000; Hunsaker et al., 1998; Chu et al., 1995). This irrigation frequency also
better replicates center-pivot irrigation frequency and capacity, which is most prevalent in TN. On Mondays, Wednesdays, and Fridays, 1.02, .76, and .76 cm were
applied respectively (in the 2.54 cm/wk treatments)
if complete irrigation time was necessary. Amount of supplemental irrigation applied was dependent upon rainfall. If there was no rainfall in the last seven days,
the full amount of irrigation was applied. If 2.54 cm or more effective rainfall was recorded in the last seven
days, no irrigation was applied. If an amount less than
2.54 cm was received, irrigation amount was deter
-mined based on the 2.54 cm/wk treatment reaching the full quota. Irrigation was initiated at either first square, first bloom, or two weeks past first bloom (in 2010
plot seed cotton weight, and with plot area a lint yield in kg/ha was calculated. While statistical analysis was conducted on calculated yields, lint
yields are reported in the format of difference from
rainfed yield. This numerical format compared each treatment yield in a given soil type and year to the rainfed yield for that soil type and year. Results from a portion of this dataset in 2010 and 2011 are
presented by Wiggins et al. (2014), as are some
additional physiological measurements. Previous
analysis by Wiggins et al. (2014) examined four
selected irrigation treatments and two soil groups and focused on the impact of irrigation amount ap-plied on physiological measurements and lint yield. More detailed soil analysis was completed follow-ing the 2010 season (Duncan, 2012), which allowed for improvement in the grouping of plots by soil type. This re-grouping of plots and new analysis is the reason for some missing treatments in 2010.
The experiment was arranged as a randomized complete block design (RCBD) that was blocked
by soils. Seven soil blocks were identified that
transitioned from low to high WHC and shallow to deep depth to sandy soil (Duncan, 2012). Data were analyzed using the mixed procedure of SAS
9.4 (SAS Institute, Cary, NC). Preliminary analy
-sis revealed a significant interaction between year,
treatment, and soil. Therefore, the three years were analyzed separately, which is especially appropri-ate because of the dissimilar yearly rainfall
pat-terns. Each year, a significant block by treatment
interaction existed according to Tukey’s single
degree of freedom test for interaction (α=0.05),
indicating that cotton yield responded differ-ently to irrigation treatments across soil blocks. To address this interaction, and achieve a better distinction between soil responses to irrigation, a variable “soil type” was added to the analysis. This variable grouped the seven soil blocks into three soil types - low, intermediate, and high WHC – based on soil textural and water holding capacity data presented by Duncan (2012). The grouping of soil blocks was the same in each year, block one was the low WHC (sandy soils), blocks two through four were intermediate WHC, and blocks
five through seven constituted the high WHC (silt
loam soils) soil type. Levene’s test for equality of variance in each year reported an F-statistic of less than 3, therefore the pooled variance was used in mean separation. Mean separation was achieved
using Fisher’s LSD p=0.10.
Precipitation data were collected from a standard National Oceanic and Atmospheric Administration
(NOAA) weather station less than 400 m from the field of study. Daily ET values were calculated in
MOIST, using temperature data from a weather
station in Brownsville, TN, approximately 40 km from the field of study. Rainfall and irrigation re -cords were input to MOIST after each season. Soil
specific parameters used to calculate allowable soil
water depletion were water holding capacity values of 18.3 cm/m for the silt loam soils and 8.3 cm/m for the sandy soils (Duncan 2012). In calculating actual
soil water depletion, a crop-specific rooting depth of
0.91 m was used.
Soil moisture tension was measured using elec-trical resistance granular matrix sensors (Watermark) from Irrometer (Irrometer Company, Inc., Riverside, CA). For each plot monitored, sensors were placed at depths of 23 and 61 cm. Sensors were placed in spring of 2010 and remained in place until the end of 2012 growing season. Sensors and antennas
re-mained in-field, and communicated wirelessly to a receiver upon significant (define this value) change
in soil moisture.
The two center rows of each plot were harvested with a two-row spindle picker. Total seed cotton weight of each plot was measured by load cell in
the field. A sample of seed cotton was taken from
each plot, weighed, and air-dried. Each sample was ginned with a 20-saw gin assembly to determine lint turnout. Lint turnout was applied to the total
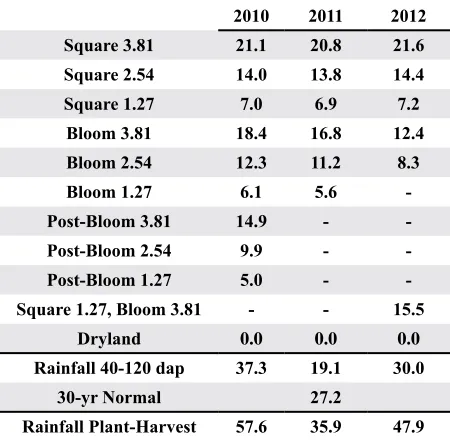
Table 1: Applied irrigation (cm) for each treatment (initiation timing, cm/wk target) by year
2010 2011 2012
Square 3.81 21.1 20.8 21.6
Square 2.54 14.0 13.8 14.4
Square 1.27 7.0 6.9 7.2
Bloom 3.81 18.4 16.8 12.4
Bloom 2.54 12.3 11.2 8.3
Bloom 1.27 6.1 5.6
-Post-Bloom 3.81 14.9 -
-Post-Bloom 2.54 9.9 -
-Post-Bloom 1.27 5.0 -
-Square 1.27, Bloom 3.81 - - 15.5
Dryland 0.0 0.0 0.0
Rainfall 40-120 dap 37.3 19.1 30.0
30-yr Normal 27.2
RESULTS AND DISCUSSION
The three years of this study were markedly
different from one another in rainfall amount and
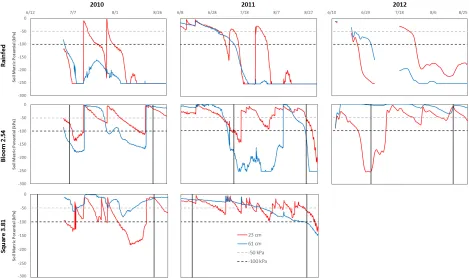
distribution, which is common in the Mid-South. The 2010 growing season was wetter than average during the critical irrigation period (Table 1), and rainfall was well distributed. The 2011 growing sea-son was drier than average, and had a pronounced late dry period beginning in early to mid-July. The 2012 growing season was close to average in total rainfall, but had a pronounced early dry period from mid-June to early July. Whole season rainfall patterns, along with ET and soil moisture depletion, can be seen in MOIST outputs (Figure 1). The ir-rigation treatment that led to optimal lint yield in
each soil and each year reflects the difference in
rainfall in the three years of this study. The wettest year, 2010, saw no yield increase from irrigation in deep silt loam soils, while cotton grown in sandy soils yielded highest when irrigation was delayed until bloom, and then received irrigation at our highest rate (Table 2). In a year with a late dry period, 2011, cotton grown in deep silt loam soils did respond to irrigation and yielded highest when irrigation was initiated at bloom and applied at our highest rate. Cotton grown in sandy soils in 2011 required irrigation starting at square, at a high rate to yield highest. In a year with an early dry period, 2012, both deep silt loam soils and sandy soils needed irrigation beginning at square to optimize yield. However, while cotton grown in sandy soils needed our highest rate of irrigation, cotton grown
in deep silt loam soils yielded optimally with 2.54
cm/wk supplemental irrigation. Another important observation from this study is the potential for over-irrigation to harm cotton yield in silt loam soils which has also been observed by Gwathmey et al. (2011) and Zhou et al. (2015). In all three years, we observed a reduction in lint yield when cotton in silt loam soils was irrigated at our highest irrigation treatment compared to the optimal treat-ment for that year.
A water balance approach in 2010 (Figure 1)
confirms that actual soil water depletion remained
above the allowable depletion for silt loam soil without irrigation. However, even in this wet year, the actual depletion without irrigation exceeded the allowable depletion for sandy soil, especially later in the year. Supplemental irrigation beginning
at bloom was sufficient to keep the actual deple
-tion well above the allowable deple-tion level for sandy soils and subsequently increase yield over non-irrigated. Soil moisture sensors in the silt loam soils in 2010 seem to all read drier than expected, based upon the water balance and observed yields (Figure 2). The deep sensor in each treatment fol-lows a similar drying trajectory through the year, but did so at dissimilar levels. The top sensor clearly shows wetter conditions when irrigated, compared to non-irrigated, but all observed treatments seem to violate suggested thresholds (Leib et al., 2015; Vellidis et al., 2008; Flynn and Barnes, 1998). Very dry conditions at the top sensor in the non-irrigated treatment suggest the cotton was able to use
suf-ficient deep soil moisture to yield optimally. This reaffirms the sentiment in Leib et al. (2015), con -cerning averaging sensor readings across depths to trigger irrigation. In this case, extreme values in the
upper part of the profile would likely trigger un -necessary irrigation. Sensors in the sandy soil show
significant drying under non-irrigated conditions
at both sensors (Figure 3). Cotton yielded highest in sandy soil with initiation at bloom and a rate of
3.81 cm/wk. Our observed plot of bloom 2.54 cm/
wk shows more favorable conditions, however the levels are still allowed to drop below -100 kPa at both sensors for two short periods of time. With sensors in the bloom 3.81 cm/wk treatment, we expect we would have observed higher moisture levels during those periods.
A water balance approach in 2011 (Figure 1) shows actual depletion exceeding the allowable depletion for sandy and silt loam soils mid-late season. Supplemental irrigation beginning at bloom keeps the actual depletion well above the allowable depletion for silt loam soils until after the irriga-tion period. For sandy soils, the actual depleirriga-tion nears the allowable depletion multiple times and exceeds the allowable depletion just after irrigation has ceased. When irrigation is initiated at square,
the actual depletion stays significantly shy of the
over-irrigation (Gwathmey et al., 2011; Zhou et al., 2015), indicating perhaps cotton in silt loam soils
can benefit from a deficit in soil moisture.
Non-irrigated soil moisture in sandy soils in 2011 reveals
extended periods of a thoroughly dry soil profile (Figure 3), leading to significant yield loss (Table 2).
Initiating irrigation at bloom still allowed multiple periods where soil moisture was below -100 kPa at both sensors. Initiating irrigation at square and applying our highest rate kept at least one sensor above -60 kPa throughout the critical period, and led to optimal yield.
In 2012, the water balance clearly demonstrates
the effect of a substantial early dry period (Figure 1).
Actual soil water depletion exceeds the allowable depletion for both silt loam and sandy soils early in the season, and while the depletion does not grow
significantly, it never recovers to an acceptable
level without supplemental irrigation. Irrigation beginning at bloom improves the depletion late in
the season, but does not erase a significant deficit
early in the year. Cotton in both silt loam and sandy soils required irrigation beginning at square to yield optimally, as the MOIST output for square 3.81 cm/wk shows actual depletion within the range of allowable depletion for the silt loam soil and nearly all within the range for sandy soil. Sensors in the non-irrigated silt loam soil in 2012 (Figure 2)
certainly do not reflect the severity of water deficit
suggested by the water balance and yield loss suf-fered. Prior to irrigation initiation, the sensors in the
bloom 2.54 cm/wk treatment are more indicative
of probable conditions. Mostly favorable readings in the non-irrigated silt loam soil reveal potential shortcomings of relying solely on sensor data. As mentioned by Leib et al. (2015), faulty sensors, localized soil irregularities, and sensor proximity to crop row are factors that could contribute to unre-alistic readings. Irrigation beginning at square was required to optimize yield, even in silt loam soils, and sensors show this earlier initiation alleviated
dry conditions around first bloom stage. Sensors in
sandy soil show drying beyond irrigation thresh-olds when non-irrigated and when irrigation was delayed until bloom (Figure 3). Irrigation beginning at square was necessary to optimize yield in sandy soils in 2012, however, sensor data is missing from an early initiation plot.
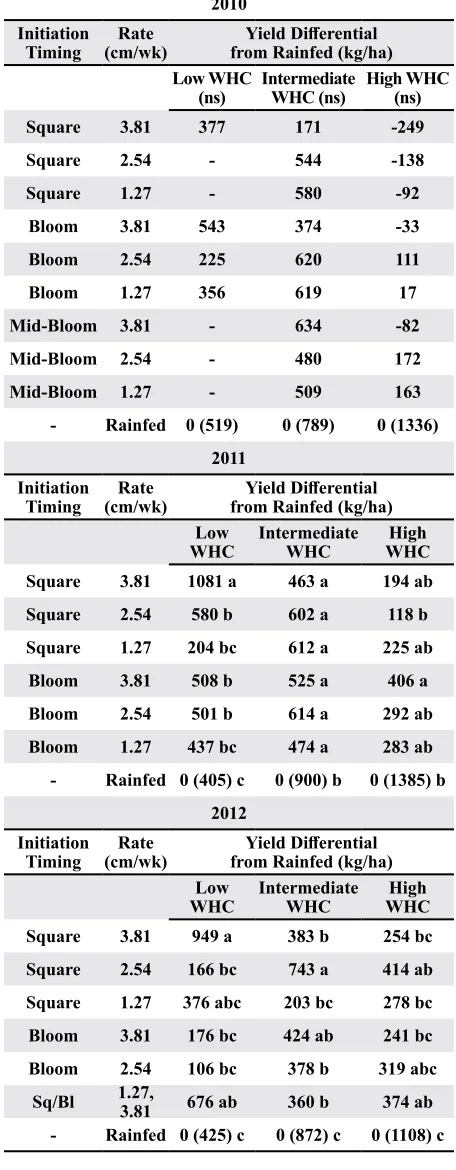
Table 2: Cotton lint yields compared to rainfed yield within soil type and year
2010 Initiation
Timing (cm/wk)Rate from Rainfed (kg/ha)Yield Differential Low WHC
(ns) Intermediate WHC (ns) High WHC (ns)
Square 3.81 377 171 -249
Square 2.54 - 544 -138
Square 1.27 - 580 -92
Bloom 3.81 543 374 -33
Bloom 2.54 225 620 111
Bloom 1.27 356 619 17
Mid-Bloom 3.81 - 634 -82
Mid-Bloom 2.54 - 480 172
Mid-Bloom 1.27 - 509 163
- Rainfed 0 (519) 0 (789) 0 (1336)
2011 Initiation
Timing (cm/wk)Rate from Rainfed (kg/ha)Yield Differential Low
WHC Intermediate WHC WHCHigh
Square 3.81 1081 a 463 a 194 ab
Square 2.54 580 b 602 a 118 b
Square 1.27 204 bc 612 a 225 ab
Bloom 3.81 508 b 525 a 406 a
Bloom 2.54 501 b 614 a 292 ab
Bloom 1.27 437 bc 474 a 283 ab
- Rainfed 0 (405) c 0 (900) b 0 (1385) b 2012
Initiation
Timing (cm/wk)Rate from Rainfed (kg/ha)Yield Differential Low
WHC Intermediate WHC WHCHigh
Square 3.81 949 a 383 b 254 bc
Square 2.54 166 bc 743 a 414 ab
Square 1.27 376 abc 203 bc 278 bc
Bloom 3.81 176 bc 424 ab 241 bc
Bloom 2.54 106 bc 378 b 319 abc
Sq/Bl 1.27, 3.81 676 ab 360 b 374 ab
Figure 1: Seasonal water balance using MOIST irrigation scheduling tool for non-irrigated, irrigated beginning at bloom 2.54 cm/wk, and irrigated beginning at square 3.81 cm/wk for each of the three study years.
CONCLUSION
This study contributes further evidence of the
need to irrigate cotton differently in soils that vary
in texture and water holding capacity. In a wet year, this could mean not irrigating a silt loam soil, while supplying some irrigation to a sandy soil. In drier years, cotton grown in both soils could need irrigation to optimize yield, however, the initiation timing and rate of supplemental irrigation could
need to be different. To encourage producers to do
a good job irrigating, depending on soil, a source based on sound and proven methods is needed to make irrigation decisions. In this study, a water balance approach, using the MOIST scheduling tool, accurately predicted the need for irrigation and allowable depletions for silt loam and sandy soils were on target. Soil moisture sensors, in most cases,
reflected the water balance status and revealed differential needs between soils and years. Irriga -tion thresholds, or trigger points, suggested in the literature, however, seem conservative compared to the values our sensors read, while still yielding optimally. There were also inconsistencies in sensor readings, and sometimes values that did not align with status of soil water indicated by the water balance and subsequent yields. Therefore, soil
moisture sensors can be recommended as a verifica -tion of a water balance approach, can demonstrate
differences in water status between soils, and can alert one to significantly dry conditions. Multiple sensor locations could confirm that the sensors are
representative of a larger area. While this study
did not indicate difficulty with the water balance
approach, it should be recognized that these plots were level and well-drained. Sloping ground and drainage issues as well as inaccurate measurements of rainfall/irrigation can cause the water balance to misdiagnose conditions. If both methods, soils moisture sensors and water balance, are in
agree-ment there will be high confidence that irrigation
scheduling is on track. If the methods diverge, it is important to discern the reason for the disparity in order to make good irrigation decisions.
ACKNOWLEDGEMENTS
This research was made possible with the
assis-tance of the staff and supervisors at WTREC. Special
thanks to Tyler Simmons, Matt Ross, and Matthew Wiggins. Statistical guidance and assistance were provided by Dr. Arnold Saxton. This research was supported by Cotton Incorporated and USDA-NRCS through a Conservation Innovation Grant.
REFERENCES
AbdelGadir, A. H., J. P. Fulton, M. Dougherty, L. M. Curtis, E. van Santen, C. H. Burmester, H. D. Harkins, and B. E. Norris. 2011. Subsurface drip irrigation placement and cotton irrigation water requirement in the Tennessee Val-ley. Crop Manag. 10(1).
Balkcom, K. S., D. W. Reeves, J. N. Shaw, C. H. Burmester,
and L. M. Curtis. 2006. Cotton yield and fiber quality
from irrigated tillage systems in the Tennessee Valley. Agron J. 98 (3): 596–602.
Barber, T., and P. Francis. 2011. Achieving profitable cotton
production: Irrigation initiation and termination. Re-search Series - Arkansas Agricultural Experiment Station.
589: 94–99.
Basal, H., N. Dagdelen, A. Unay, and E. Yilmaz. 2009.
Ef-fects of deficit drip irrigation ratios on cotton (Gossy
-pium hirsutum L.) yield and fibre quality. J Agron Crop
Sci. 195 (1): 19–29.
Booker, J. D., R. J. Lascano, S. R. Evett, and R. E. Zartman.
2014. Evaluation of a landscape-scale approach to cotton
modeling. Agron J. 106 (6): 2263–79.
Bronson, K. F., J. D. Booker, J. P. Bordovsky, J. W. Keel-ing, T. A. Wheeler, R. K. Boman, M. N. Parajulee, E.
Segarra, and R. L. Nichols. 2006. Site-specific irrigation
and nitrogen management for cotton production in the Southern High Plains. Agron J. 98 (1): 212–19.
Buttar, G. S., M. S. Aujla, H. S. Thind, C. J. Singh, and K. S.
Saini. 2007. Effect of timing of first and last irrigation on the yield and water use efficiency in cotton. Agric Water Manage. 89 (3): 236–42.
Carvalho, H. Da Ros, C. J. Fernandez, J. C. Correa, J. T. Cothren, G. Morgan, and M. Krifa. 2015. Quantifying
the effects of water deficit stress timing on cotton growth
and yield under rain-sheltered controlled conditions. In Proc. Beltwide Cotton Conf., San Antonio, TX. 5-7 Jan. 2015. Natl. Cotton Counc. Am., Memphis, TN.
Chu, C. C., T. J. Henneberry, and J. W. Radin. 1995. Effect
of irrigation frequency on cotton yield in short-season
production systems. Crop Sci. 35 (4): 1069–73.
Dekock, J., L. P. Debruyn, and J. J. Human. 1990. The rela-tive sensitivity to plant water-stress during the reproduc-tive phase of upland cotton (Gossypium hirsutum L).
Irrigation Sci. 11 (4): 239–44.
Detar, W. R. 2008. Yield and growth characteristics for cotton under various irrigation regimes on sandy soil. Agric Water Manage. 95 (1): 69–76.
Dougherty, M., A. H. AbdelGadir, J. P. Fulton, E. van Santen, L. M. Curtis, C. H. Burmester, H. D. Harkins, and B. E. Norris. 2009. Subsurface drip irrigation and fertigation for North Alabama cotton production. J Cotton Sci. 13
(4): 227–37.
Duncan, H. A. 2012. Locating the variability of soil water
holding capacity and understanding its effects on deficit
irrigation and cotton lint yield. M.S. Thesis. University of Tennessee, Knoxville, TN.
Enciso-Medina, J., B. Multer, and D. Porter. 2000. Optimizing
cotton irrigation frequency for deficit irrigation. In Proc. National Irrigation Symposium, Pheonix, AZ. 14-16 Nov.
2000. Amer Soc Agr Engineers, St. Joseph, MI.
English, M. J., K. H. Solomon, and G. J. Hoffman. 2002. A
paradigm shift in irrigation management. J Irrig Drain Eng. 128 (5): 267–77.
Evans, R. G., J. LaRue, K. C. Stone, and B. A. King. 2013.
Adoption of site-specific variable rate sprinkler irrigation systems. Irrigation Sci. 31 (4): 871–87.
Flynn, R. P. and C. E. Barnes. 1998. Timing first irrigations
for cotton productivity and water conservation. In Proc. Beltwide Cotton Conf., San Diego, CA. 5-9 Jan. 1998. Natl. Cotton Counc. Am., Memphis, TN.
Geerts, S., and D. Raes. 2009. Deficit irrigation as an on-farm
strategy to maximize crop water productivity in dry
areas. Agric Water Manage. 96 (9): 1275–84.
Gwathmey, C. O., B. G. Leib, and C. L. Main. 2011. Lint yield and crop maturity responses to irrigation in a short-season environment. J Cotton Sci. 15 (1): 1–10.
Haghverdi, A., B. G. Leib, P. D. Ayers, M. J. Buschermohle, D. Verbree, and T. J. Grant. 2015. Studying cotton yield response to irrigation regimes and spatial soil variation in a humid region. In Proc. Beltwide Cotton Conf., San Antonio, TX. 5-7 January. 2015. Natl. Cotton Counc. Am., Memphis, TN.
Hunsaker, D. J., A. J. Clemmens, and D. D. Fangmeier. 1998. Cotton response to high frequency surface irrigation.
Agric Water Manage. 37 (1): 55–74.
Kebede, H., D. K. Fisher, R. Sui, and K. N. Reddy. Irrigation methods and scheduling in the delta region of Missis-sippi: Current status and strategies to improve irrigation
efficiency. Am J Plant Sci. 5 (20): 2917.
Longwell, T. J., W. L. Parks, and M. E. Springer. 1963. Mois-ture characteristics of Tennessee soils. In Agric. Exp. Sta. Bull. 367. University of Tennessee, Knoxville, TN.
Pettigrew, W. T. 2004. Moisture deficit effects on cotton lint
yield, yield components, and boll distribution. Agron J. 96 (2): 377–83.
Ping, J. L., and C. J. Green. 2000. Spatial Variability of Yield and Soil Parameters in Two Irrigated Cotton Fields in Texas. In Proc. 5th International Conf. on Precision Ag-riculture, Bloomington, MN. 16-19 Jul. 2000. American Society of Agronomy, Madison, WI.
Snowden, M. C., G. L. Ritchie, F. R. Simao, and J. P.
Bordo-vsky. 2014. Timing of episodic drought can be critical in cotton. Agron J. 106 (2): 452–58.
Tar, W. R. de, S. J. Maas, and J. R. McLaughlin. 1998. Cotton irrigation using subsurface drip: Growth, cutout and yield depend on amount of water applied. In Proc. Belt-wide Cotton Conf., San Diego, CA. 5-9 Jan. 1998. Natl. Cotton Counc. Am., Memphis, TN.
Vellidis, G., M. Tucker, C. Perry, C. Kvien, and C. Bednarz. 2008. A real-time wireless smart sensor array for
sched-uling irrigation. Comput Electron Agric. 61 (1): 44-50. Vories, E. D., and S. R. Evett. 2014. Irrigation challenges in
the sub-humid US Mid-South. International Journal of
Water. 8 (3): 259–74.
Vories, E. D., W. E. Stevens, K. A. Sudduth, S. T. Drummond, and N. R. Benson. 2015. Impact of soil variability on
irrigated and rainfed cotton. J Cotton Sci. 19 (1): 1–14.
Wanjura, D. F., J. R. Mahan, and D. R. Upchurch. 1996.
Irrigation starting time effects on cotton under high-frequency irrigation. Agron J. 88 (4): 561–66.
Wiggins, M. S., B. G. Leib, T. C. Mueller, and C. L. Main.
2014. Cotton growth, yield, and fiber quality response to irrigation and water deficit in soil of varying depth to a sand layer. J Cotton Sci. 18 (2): 145-152.
Zhou, X., C. Boyer, J. A. Larson, B. G. Leib, and C. O.
Gwathmey. 2015. Profit maximizing irrigation rates and