in the population sciences published by the Max Planck Institute for Demographic Research Konrad-Zuse Str. 1, D-18057 Rostock · GERMANY www.demographic-research.org
DEMOGRAPHIC RESEARCH
VOLUME 13, ARTICLE 13, PAGES 301-334
PUBLISHED 17 NOVEMBER 2005
http://www.demographic-research.org/Volumes/Vol13/13/ DOI: 10.4054/DemRes.2005.13.13
Research Article
Population observatories as
sources of information on
mortality in developing countries
Gilles Pison
This article is part of Demographic Research Special Collection 4, “Human Mortality over Age, Time, Sex, and
Place: The 1st HMD Symposium”.
1 Introduction 302
2 A growing number of population observatories in the developing countries
303
2.1 Renewed interest in population observatories in the 1990s 303
2.2 Characteristics of the observatories 306
2.2.1 The size of the population monitored 306
2.2.2 The health situation 306
2.2.3 Frequency of visits 308
2.3 Are population observatories too costly relative to their scientific results?
309
3 The example of the population and health observatories at Bandafassi and Mlomp in Senegal
311
3.1 The Bandafassi population and health observatory 311
3.1.1 Demographic monitoring 313
3.1.2 Determining the causes of death by means of the ‘verbal
autopsy’ method
313
3.1.3 The other data collected 315
3.2 The population observatory at Mlomp 315
3.3 An example of results: child mortality trends 316
3.3.1 Child mortality at Bandafassi: after a period of significant progress, has the decline levelled off?
316
3.3.2 The influence of immunization 320
3.3.3 Measles, a rapidly declining cause of death 321
3.3.4 The evolution of mortality and the causes of death at Mlomp compared with Bandafassi
324
3.3.5 Malaria, a cause of death on the increase again 326
4 Conclusion 328
References 329
Population observatories as sources of information
on mortality in developing countries
Gilles Pison 1
Abstract
A ‘population observatory’ is a study in which a whole population of a defined geographical area is monitored over a long period (several years or decades), and information on the events that happen (births, deaths, marriages, migration) is collected on a regular basis.
This paper presents the collection method used in population observatories, the type of results that they provide, and how they are useful for the study of mortality in the nations of the South. In the first part, the different observatories in the developing countries are reviewed, and certain specific aspects of their methodology are studied in detail. In the second part two examples are presented – the observatories of Bandafassi and Mlomp, in Senegal.
This article is part of Demographic Research Special Collection 4,
“Human Mortality over Age, Time, Sex, and Place: The 1st HMD Symposium”. Please see Volume 13, Publications 13-10 through 13-20.
1 Institut national d'études démographiques (INED), 133 Boulevard Davout, 75980 Paris cedex 20 – France.
1. Introduction
A ‘population observatory’ is a study in which a whole population of a defined geographical area (usually marked out by roads, rivers etc.) is monitored over a long period (several years or decades), and information on the events that happen (births, deaths, marriages, migration) is collected on a regular basis. A demographic surveillance system, another name for a population observatory, differs from a cohort survey in that the whole of the population, not just a fraction of it, is monitored.
A growing number of population observatories have been established in the developing countries since the late 1980s, in response to two requirements:
-- the need for better knowledge of the health of the populations. Many countries in the South lack reliable health statistics and research based on hospital data gives a biased picture of the health situation as a fraction of the population never goes to a hospital, or only in exceptional circumstances. Surveys on the general population are thus needed to obtain more accurate information on health problems. When they have been ongoing for several years among the same populations, such surveys can be used as sentinel posts for health systems. They also provide opportunities for tests to evaluate new vaccines, treatments or care strategies.
-- At the same time, there is a lack of precise data on demographic levels and trends in many countries because civil registration is very incomplete. Surveys (particularly demographic and health surveys) partly compensate for such shortcomings by providing indications on trends, especially when several of them are conducted successively. However, they provide at best only two or three points in time and afford no insight into the factors involved in change, which calls for research that focuses on monitoring specific populations over long periods of time.
2. A growing number of population observatories in the developing
countries
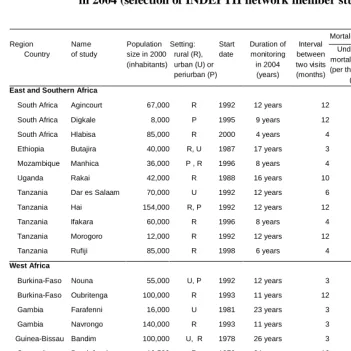
Table 1 gives a list of some twenty population observatories operating in developing countries in 2004, including a few characteristics concerning each of them – the size of the population being monitored, the date when the observation began, the duration of monitoring, the frequency of visits, etc. – as well as two mortality indicators: the under-five mortality, i.e., the probability of dying between birth and age 5 expressed per 1000 live births, and the life expectancy at birth for males and females. The 22 observatories in the list belong to INDEPTH (International network of field sites with continuous demographic evaluation), which was created in 1998 and which counted 31 member observatories in 2002 (INDEPTH network, 2002). Although there are other observatories in developing countries, some of which are also members of the INDEPTH network, the list in Table 1 provides a picture of the characteristics of the observatories currently in operation.
2.1 Renewed interest in population observatories in the 1990s
Few of the population observatories listed in Table 1 were created prior to the early 1990s. For a long time it was considered that demographic surveillance studies were comparatively costly tools, considering the results they yielded. And as they are usually concerned only with communities within larger (national or regional) populations, they were considered unrepresentative at a time when indicators were lacking on the demographic levels and trends among the population as a whole, so the priority was to find reliable methods for obtaining such indicators. Consequently few observatories were created to study local populations. Those that were established were intended to operate over a short period of a few years only. The objective was usually to study some pathology or specific health problem, and evaluate a programme aimed at removing it. Once the period initially planned was up and the objectives were reached, the observation was brought to an end.
their efficiency in eliminating the disease from the world regions, particularly South Asia, where cholera was endemic. Initiated in the Matlab area in 1963, the tests were carried on into the late 1980s (Aziz and Mosley, 1997). In the first few years, the observation was limited to detecting all occurrences of severe diarrhoea by means of daily monitoring over a set of villages totalling a few tens of thousands of people.
Only 3 years later, in 1966, it became clear that demographic monitoring – including periodic recording of births, deaths, weddings and migration – was needed to ensure that updated population files could be made available at any time. As the demographic observation was organized, the monitoring was expanded, involving up to 277,000 people in 1974. As well as precisely detecting occurrences of diarrhoea, as related to the vaccine tests themselves, the study aimed to improve knowledge of diarrhoea and nutrition-related diseases. However, after a while, research on cholera and diarrhoea was no longer sufficient justification for maintaining such an observatory. In 1975 a whole new set of objectives was defined: a new research programme was launched, aimed at assessing the efficiency of various birth limitation programmes, particularly an oral contraceptive distribution project, and another on family planning service provision. Later, in 1977, the size of the observatory was reduced by about 40% (84 villages totalling 105,000 people were withdrawn), with a view to reducing costs.
In the list in Table 1, all seven observatories created before 1985 are located in Bangladesh (Matlab and ORP) and West Africa, in three neighbouring countries at the western tip of the African continent (Senegal, The Gambia, Guinea Bissau). None of the observatories established before 1985 are in East or Southern Africa.
Table 1: Ongoing population surveillance studies in developing countries in 2004 (selection of INDEPTH network member studies (1))
Mortality during 1995-1999 period
Life expectancy at birth (years) Region Country Name of study Population size in 2000 (inhabitants)
Setting: rural (R), urban (U) or periurban (P) Start date Duration of monitoring in 2004 (years) Interval between two visits (months) Under-five mortality (5q0) (per thousand)
(2) Female Male
East and Southern Africa
South Africa Agincourt 67,000 R 1992 12 years 12 51 69 63
South Africa Digkale 8,000 P 1995 9 years 12 45 68 62
South Africa Hlabisa 85,000 R 2000 4 years 4 - -
Ethiopia Butajira 40,000 R, U 1987 17 years 3 119 57 56
Mozambique Manhica 36,000 P , R 1996 8 years 4 148 58 47
Uganda Rakai 42,000 R 1988 16 years 10 - -
Tanzania Dar es Salaam 70,000 U 1992 12 years 6 114 50 50
Tanzania Hai 154,000 R, P 1992 12 years 12 92 63 56
Tanzania Ifakara 60,000 R 1996 8 years 4 124 58 56
Tanzania Morogoro 12,000 R 1992 12 years 12 183 46 44
Tanzania Rufiji 85,000 R 1998 6 years 4 179 52 53
West Africa
Burkina-Faso Nouna 55,000 U, P 1992 12 years 3 137 53 54
Burkina-Faso Oubritenga 100,000 R 1993 11 years 12 188 55 52
Gambia Farafenni 16,000 U 1981 23 years 3 170 55 51
Gambia Navrongo 140,000 R 1993 11 years 3 183 51 47
Guinea-Bissau Bandim 100,000 U, R 1978 26 years 3 226 39 36
Senegal Bandafassi 10,500 R 1970 34 years 12 253 48 45
Senegal Mlomp 7,600 R 1985 19 years 12 89 65 60
Senegal Niakhar 29,000 R 1962 42 years 3 209 54 49
Asia
Bangladesh Matlab 215,000 R 1966 38 years 1 70 66 65
Bangladesh ORP 127,000 U, R 1982 22 years 3 86 66 62
Vietnam Filabavi 52,000 R 1999 5 years 3 - -
-Notes
(1) INDEPTH: International network of field sites with continuous demographic evaluation of populations and their health in developing countries
2.2 Characteristics of the observatories
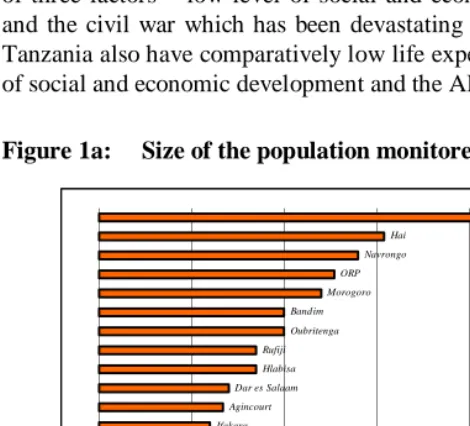
2.2.1 The size of the population monitored
There are large variations in the size of the populations monitored by the demographic surveillance studies that belong to the INDEPTH network (Figure 1a). The smallest one (Mlomp, in Senegal) includes 7,600 people, while the largest (Matlab, in Bangladesh) concerns 215,000 people. In between are observatories of various sizes, with a medium size of about 60,000 people. The observatories created in recent years tend to be quite large. In many of them, one major objective is to study changes in mortality and the causes of death in adulthood, particularly in relation to the AIDS epidemic. In that respect, a minimum of 200,000 people is agreed to be the best practice, and sufficient for accurate estimation (Hayes et al., 1989). And Matlab, where the size of the population under observation is slightly above that threshold, is usually considered a model.
The desirable size obviously depends on the objectives to be reached, as well as the resources available. However, though larger studies mean more precision in the technical sense of less random variations, this may be gained at the cost of bias, due to lower quality field operations. In fact, it is increasingly difficult to keep the quality of the collection at high levels, as more interviewers and more levels of control are involved.
The examples of Mlomp and Bandafassi presented in the second part of this chapter show that it is possible, with only 10,000 people on each of those sites, to bring out the major differences in mortality and causes of death among children as well as adults on the two sites.
2.2.2 The health situation
where they are lower, and within the African continent, between West Africa, which is characterized by high levels of child mortality, and East and Southern Africa, where they are lower. However, there are also exceptions: at Morogoro, in Tanzania, child mortality is as high as on any West African site; this is a poor, rural area, with low population density, selected precisely as representative of the populations in that type of situation. Mlomp, in Senegal, is also an exception in that its child mortality level is peculiarly low for a West African population. As will be discussed in the second part of this paper, the population benefits from high quality health infrastructure and programmes by rural West African standards.
The ranking of the demographic surveillance studies is very much the same when using the second indicator – life expectancy at birth for females (Figure 1c) – and no wonder, considering that these two indicators are correlated to living standards in general and that child mortality, which is still high, weighs heavily on life expectancy at birth. At Bandim, in Guinea Bissau, life expectancy at birth is very low (39) as a result of three factors – low level of social and economic development, the AIDS epidemic and the civil war which has been devastating the country since 1998. Several sites in Tanzania also have comparatively low life expectancy at birth, also related to low level of social and economic development and the AIDS epidemic.
Figure 1a: Size of the population monitored in 2000 (inhabitants)
Mlomp Digkale
Bandafassi Farafenni
Niakhar Manhica
Butajira Rakai
Filabavi Nouna Ifakara
Agincourt Dar es Salaam
Hlabisa Rufiji
Oubritenga Bandim
Morogoro ORP
Navrongo Hai
Matlab
Figure 1b: Child mortality (5q0) (probability of dying between birth and age 5) (per 1000 live births) (period 1995-1999)
Digkale Agincourt
Matlab ORP
Mlomp Hai
Dar es Salaam Butajira
Ifakara Nouna
Manhica Farafenni
Rufiji Morogoro Navrongo Oubritenga
Niakhar Bandim
Bandafassi
0 50 100 150 200 250 300
Figure 1c: Life expectancy at birth (females) (years) (period 1995-1999)
Agincourt Digkale Matlab ORP Mlomp Hai Manhica Ifakara Butajira Oubritenga Farafenni Niakhar Nouna Rufiji Navrongo Dar es Salaam Bandafassi Morogoro Bandim
2.2.3 Frequency of visits
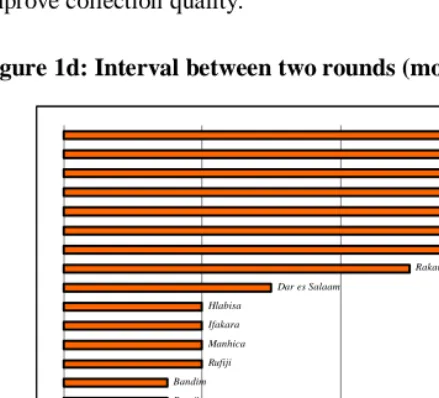
In Figure 1d, the observatories of Table 1 are classified by interval in months between two successive visits. In one in three observatories, visits are made on an annual basis, and in about every other observatory, they take place every three or four months. As for the size of population, the best practice is agreed to be every three months. But here again, the norm must be adjusted to the objectives and resources as well as to local constraints. And organizing frequent visits at short intervals does not necessarily improve collection quality.
Figure 1d: Interval between two rounds (months)
Matlab ORP Nouna Niakhar Navrongo Filabavi Farafenni Butajira Bandim
Rufiji Manhica Ifakara Hlabisa
Dar es Salaam
Rakai
Oubritenga Morogoro Mlomp Hai Digkale Bandafassi Agincourt
0 4 8 12
2.3 Are population observatories too costly relative to their scientific results?
population of the country and are not representative of a larger population. In comparison, WFS and DHS type surveys produce, at reasonable cost, representative estimates for the whole country. However, these two sources of information should not be directly compared as they do not have the same aims and are complementary, as mentioned at the beginning: national surveys provide indications on general demographic levels and trends, but afford no insight into the factors involved in change. Population observatories provide this insight, together with detailed information on behaviour or health, such as causes of death, that are difficult to collect through WFS and DHS type surveys. Moreover, they provide opportunities for tests to evaluate new vaccines, treatments or care strategies, as mentioned at the beginning.
A further area of criticism of observatories is the small body of publications that many observatories have generated in comparison with the scientific energy and money that have been devoted to them. Moreover, publication of results has often been inordinately delayed. Here the DHS undoubtedly have a better record. This is linked to the lack of analytical capacity among some of the teams responsible for observatories and the unwillingness or inability of many of them to make the data available to other investigators. In the future, more attention should be devoted by population observatories to developing competencies in data processing, storage and retrieval, so that the large amounts of data collected can be analysed more readily.
Another worry is whether observatories do actually serve to inform national health policies. Here again, most teams in charge of population observatories have probably not been efficient enough to disseminate their results to the persons and the institutions in charge of health in the country.
3. The example of the population and health observatories at
Bandafassi and Mlomp in Senegal
The populations of two rural areas in Senegal, Bandafassi and Mlomp (a population of about 10,500 and 7,600 respectively in 2000), have been monitored since 1970 and
1985 respectively2. After an initial census, surveys were conducted on each of the two
populations, with repeated visits organized on an annual basis. The monitoring operations have continued up to the present (2004). On every visit, the births, deaths, weddings and migration that have occurred since the previous annual visit are recorded. The causes of death are defined by means of post-mortem interviews or ‘verbal autopsies’.
3.1 The Bandafassi population and health observatory
The Bandafassi study area is located in Senegal, in the region of Tambacounda, in the district of Kedougou, not far from the border between Senegal and Guinea (see map). There were 11,067 residents on 1 April 2002. The entire population is rural, with farming as a main activity, including cereal crops such as sorghum, maize or rice, and groundnuts and cotton.
The region is disadvantaged in comparison with average rural areas in Senegal, because it is so far away from large cities: it is 700 kilometres from Dakar, the national capital, and 250 kilometres from Tambacounda, the regional capital. Tambacounda itself is the country’s most poorly equipped region in terms of health infrastructure and programmes (Pison et al., 1995).
The population of Bandafassi is divided into three ethnic groups who live in separate villages:
The Bedik (28% of the population), The Malinke (16%),
The Fula (57%).
The census and monitoring of the population were originally intended to pave the way for a blood sampling campaign that was planned with a view to studying the genetic diversity of the populations in the region and measuring the mortality differences related to the individuals’ genotypes. The study was expected to yield
2 The research programme was carried out by the Institut National d’Etudes Démographiques (Paris) in partnership with the Ministry of Health of
lessons on the mechanisms of genetic differentiation between populations and the part played by differential mortality. The monitoring of the population, particularly the recording of deaths, was intended to measure the level and variations of mortality in relation to the individuals’ genetic subgroups. However, that objective was soon abandoned, and the major objective of the study is now to collect such data as are necessary to measure demographic levels, trends and factors (Pison et al., 1997; Guyavarch, 2003).
Map: The location of Bandafassi and Mlomp in Senegal
Kaolack Saint- Louis
Tambacounda
Ziguinchor
Kedougou Dakar
SÉNÉGAL MAURITANIE
MALI
GAMBIE
GUINÉE-BISSAU GUINÉE-CONAKRY
0 100 km
Ined 357 00
Bandafassi Niakhar
3.1.1 Demographic monitoring
The collection of demographic data at Bandafassi started in 1970. Ever since the initial census, each village has been visited once a year, usually between January and March. On every visit, the list of the people present during the previous visit is checked, and information is collected concerning the births, weddings, migration and deaths (including their causes) that occurred in the meantime. The information is usually supplied either by the head of each section or some knowledgeable informants in the village.
In its early stage, in 1970, the study was concerned only with parts of the villages in the study area, the group of Malinke villages. Later it was extended to the other villages in two phases – in 1975 the Fula villages were included, and in 1980 the Bedik ones. The observation periods are thus different for the three groups of villages: 34 years (1970-2004) for the Malinke, 29 years (1975-2004) for the Fula and 24 years (1980-2004) for the Bedik villages.
The documents used for the annual update surveys include:
- a list of households, which is updated after each annual visit,
- a questionnaire with the list of names of the members of each household (see Box 1); the list is also updated on each annual visit. The list used for the survey in year Y includes all the individuals who were present in the household during the visit in year Y - 1. All information required to identify each individual is provided –first names, last names, parents’ names, names of their spouse, etc. (see box 1).
The questions to be asked are also included in the questionnaire. Some are the same for all residents, such as those on whether the person is present or not, while others are specifically devised for each category, depending on sex, age, marital status and past history. For example, the questions about whether any pregnancy or delivery has occurred since the preceding visit are asked only to women of childbearing age. And the list mentions their last two childbirths, so as to make information collection easier and to avoid mistakes.
3.1.2 Determining the causes of death by means of the ‘verbal autopsy’ method
means of the ‘verbal autopsy’ method. It consists in collecting information on the disease that occurred just before a person’s death by interviewing the family of the deceased some time after his or her death (Desgrées du Loû et al., 1996). For such interviews, a questionnaire has been in use since 1984, in which a set of pre-listed, easily identifiable symptoms are reviewed – fever, diarrhoea, dehydration, vomiting, coughing, convulsions, etc. For each symptom, the survey consists in asking the family whether the person had it or not, and if so, the family is encouraged to be more specific, again by using a ready-made list of questions. In box 2 the questions asked in cases of diarrhoea or dysentery are given as examples.
Once it has been completed, the verbal autopsy questionnaire is given to two doctors so that each can make an independent diagnosis. If they disagree, a third doctor reads it again and acts as an arbiter.
The diagnoses made with this method vary in their degree of precision and reliability, depending on the causes of death. For example, neonatal tetanus is quite easily identified. This is because the symptoms are quite characteristic, and mothers usually remember them well. Death can thus almost unmistakably be attributed to
neonatal tetanus if a child dies between the 5th and the 28th day after birth, and at least
three of the following symptoms were identified through the interview:
- the body was stiff, with the legs stiffly stretched out and the arms bent, - the child made convulsive movements,
- with his/her mouth shut and clenched, the child refused to suckle (in medical jargon this is known as “trismus”, when the masticating muscles are so contracted that the mouth is clenched and shut),
- the child suffered from excessive salivation.
Another cause of death can be easily identified – measles. And yet the symptoms are not so easy to identify, and less specific than those of neonatal tetanus. Nevertheless there is a specific word for the disease in every language, and it is well known by the populations, who can identify it when an epidemic breaks out. When a mother who has lost her child due to measles is asked whether the cause of death was ‘measles’ (using the name used in her language), she is seldom mistaken and her own diagnosis can generally be considered reliable. However, due to the spread of immunization from the 1980s, resulting in a decline of epidemics, self-diagnosis is not so reliable as it used to be where measles is concerned.
3.1.3 The other data collected
Along with the routine data collection conducted every year for demographic monitoring purposes, specific surveys are occasionally organized on certain subjects of particular interest concerning the population, the family or health. In every such case, the population file is used as a survey base for the sampling. Such surveys have been conducted at Bandafassi on:
- immunization: two surveys on vaccination coverage were conducted in 1992 and 2001 successively, with a view to measuring the proportion of vaccinated children and studying the factors of variation (Desgrées du Loû and Pison, 1994) ;
- breastfeeding and weaning: in a survey conducted in 2000, a sample of mothers of infants were interviewed to obtain better knowledge of feeding practices concerning infants (Guyavarch, 2003);
- sexuality and sexually transmitted infections: in 1998 a survey was conducted among a sample of adult women and men, with a view to studying sexual behaviour, measuring the prevalence of several sexually transmitted infections (HIV, syphilis, gonorrhoea, etc.) and analysing the risk factors concerning those infections (Lagarde et al., 2003a ; Lagarde et al., 2003b). The survey included a medical examination, blood and urine sampling, and an interview on the marriage and childbirth history of the individuals as well as their sexual behaviour. Later, a survey based on an informants’ network was conducted to determine the effectiveness of the prevention campaign organized from 2000 to 2003;
- malaria: entomological, parasitological and pharmacological measurements were conducted several times with a view to obtaining better knowledge of the malaria endemic and monitoring its evolution, particularly concerning the spread of resistance to treatments (Trape et al., 1998).
Such quantitative surveys were usually preceded – and sometimes followed – by other surveys of a more qualitative type on the same subjects, with a view to paving the way for data collection or more in-depth analysis of certain questions.
3.2 The population observatory at Mlomp
south-west of the country (Casamance) – whose history, ethnic composition and economic situation were quite different from those of the regions where the first two observatories were located. It was expected that measuring the demographic levels and trends on those three sites would provide better coverage of the demographic and epidemiological diversity of the country.
On 1 January 2000 the Mlomp area included a population of 7,591 residents living in 11 villages. The population density was 108 people per square kilometre. The population belongs to the Diola ethnic group, and the religion is predominantly animist, with a large minority of Christians and a few Muslims. Though low, the educational level – in 2000, 55% of women aged 15-49 had been to school (for at least one year) – is definitely higher than at Bandafassi. The population also benefits from much better health infrastructure and programmes. Since 1961, the area under study has been equipped with a private health centre run by French Catholic nurses and, since 1968, a village maternity centre where most women give birth. The vast majority of the children are totally immunized and involved in a growth-monitoring programme (Pison et al., 1993; Pison et al., 2001).
On the whole, the same collection method as at Bandafassi is used at the population observatory at Mlomp, though there are some differences in the details.
3.3 An example of results: child mortality trends
To illustrate the potential of population observatories for the study of demographic and health changes, we shall take the example of child mortality. We shall see how the Bandafassi and Mlomp observatories contribute to an understanding of child mortality trends.
3.3.1 Child mortality at Bandafassi: after a period of significant progress, has the decline levelled off?
The data collected at the Bandafassi population observatory can be used to describe the levels and trends of mortality, to identify the main causes of death and measure changes in the area under study. Figure 2 shows the change in child mortality (5q0, the risk for a
newborn child who was born alive of dying before his/her 5th birthday) over some thirty
out of every 10 died before they were 5 years old, with sharp fluctuations from one year to another. From the mid-1980s, mortality declined, falling to about 2 children in 10 in the early 1990s. The annual fluctuations in mortality rates also decreased. However, the decline in mortality seemed to have levelled off in the 1990s, and mortality even started to increase slightly again at the end of the century.
The same pattern of change was observed in all groups of villages, with only slight level differences. For example, child mortality was slightly higher in the 1980s among the Fula subgroup compared with the other two subgroups, but in the 1990s, it was slightly lower.
This pattern raises three questions: why did child mortality fluctuate so much from one year to another in the 1970s and early 1980s? What was the origin of the decline in mortality which started in the second half of the 1980s? Why did the decline come to a standstill in the 1990s and why did mortality go up again in the last period?
Figure 2a: Child mortality trends at Bandafassi - malinke villages subgroup (5q0, probability of dying from birth to age five, expressed per 1000 live births)
0 100 200 300 400 500 600 700 800
Figure 2b: Child mortality trends at Bandafassi - fula villages subgroup (5q0, probability of dying from birth to age five, expressed per 1000 live births)
0 100 200 300 400 500 600 700 800
Figure 2c: Child mortality trends at Bandafassi - bedik villages subgroup (5q0, probability of dying from birth to age five, expressed per 1000 live births)
0 100 200 300 400 500 600 700 800
19711973197 5
19771979 198 1
3.3.2 The influence of immunization
Up to 1987, the population at Bandafassi was not vaccinated on a regular basis. It was involved in only a few vaccination campaigns conducted at national level, such as those organized during the 1967 world smallpox eradication campaign or the 1969 measles campaign. With the exception of these occasional campaigns, only a few children, whose parents worked for the government as teachers or health workers, were regularly vaccinated, and overall child immunization coverage was very low.
Vaccination on a regular basis only started in 1987 at Bandafassi, during the national campaign aimed at extending the Expanded Programme on Immunization (EPI) to the whole of the country. It was launched in 1981 but by then had reached only the urban centres. Significant efforts were made, aimed at reaching the rural areas where vaccination had not been regular up to then. Within a few months, by the end of the first quarter of 1987, immunization coverage (measured as the proportion of children aged 12-35 months who have received complete immunization, i.e., BCG and vaccination against measles, yellow fever, diphtheria, pertussis, tetanus and poliomyelitis) had risen to 48% at Bandafassi (Desgrées du Loû and Pison, 1994). The immunization programme was continued in subsequent years, with a view to turning it into a permanent policy, with vaccination gradually becoming part of the routine care provided in health centres. The survey conducted in 1992 showed that although the vaccination effort was continued after 1987, the results varied from one year to another, with an overall downward tendency. By 1992, five years after the programme was launched, vaccination coverage had dropped to an average of 39% at Bandafassi.
The population at Bandafassi entered the immunization era in an abrupt manner. As the population observatory had been operating for several years when the vaccination campaign was started in 1987, the situation, almost an experimental one, was taken advantage of to assess the influence that immunization may have on child mortality. Comparing child mortality in the six years previous to the launch of the vaccination programme (1981-1986) with that in the next six years (1987-1992), a 40% decline was observed. The extent of this decline varied according to age – 31% during the neonatal period (in the first 28 days), 20% between 1 and 8 months, and 48% between 9 and 59 months. This decline can largely be attributed to immunization, as no change affected any other health factor during that period, and the social and economic circumstances hardly altered at all. Immunization was the main factor accounting for the decline in child mortality in the second half of the 1980s, as shown in Figure 2.
cases of death due to the very diseases against which vaccination ensures protection (Desgrées du Loû and Pison, 1995).
The decline in measles-related mortality was particularly dramatic, as we shall now see.
3.3.3 Measles, a rapidly declining cause of death
As mentioned above, measles is a disease that the villagers at Bandafassi can easily identify. As a result, information is available on the cases of measles-related death that have occurred since the demographic observation was launched in 1970, not just from 1984, when the verbal autopsy questionnaire was introduced. The evolution of measles-related mortality since 1970 can thus be retraced. Table 2 shows the variations in measles-related mortality rates, by considering four periods, two of which cover periods before the immunization campaign was launched in 1987 – 1970-1979 and 1980-1986 – and the other two after – 1987-1989 and 1990-1993.
Table 2 shows the radical change that had occurred in 1987. Before then, measles was the cause of a large share of deaths – among children aged 1 to 20 months, it was the cause of about 1 in every 7 deaths (14% in 1970-1979 and 15% in 1980-1986), and of 1 in every 3 (35% and 30% respectively) among children aged 21 to 59 months, thus appearing to be the primary cause of death. From 1987, measles was responsible for only 3% and 5% of deaths at those ages.
Table 2: Measles mortality rate by age-group and period. Bandafassi, 1970-1993
Period Age group
1–20 months 21–59 months
Measles annual mortality rate (per thousand)
Proportion of total deaths caused by measles (per cent)
Measles annual mortality rate (per thousand)
Proportion of total deaths caused by measles (per cent)
1970-1979 21.0 15 25.3 35
1980-1986 14.6 14 14.9 30
1987-1989 0.0 0 0.0 0
Figure 3, which shows the variations of the same rates every two months among all children under 5 years old over the entire period, shows that measles occurred in the area under study only in epidemics with comparatively long intervals between them. In the 1970-1995 period, 5 epidemics broke out: in 1973, in 1976-77, in 1981-82, in 1985 and 1992. Most of the few children who died due to measles in between those epidemics were infected and died outside the area, while they were away from home with their mothers. Each of the epidemics affected only parts of the villages. Before 1987, more than a decade often elapsed between two successive epidemics in the same village. Between epidemics, the number of susceptible children not previously exposed to measles increases with time. Consequently when a village was affected by an epidemic, it was massively hit – within a few weeks only, many children fell ill (practically all those who were born since the previous epidemic), with very high mortality rates (at least 15% in the 1976-77 and the 1981-1982 epidemics).
From Figure 3, it looks as if measles fatality decreased from one epidemic to the next between 1970 and 1987. The apparent decrease is partly a result of changes in the size of the population under surveillance, a feature mentioned above. Between 1970 and 1975, only 8 villages were monitored. In 1975, 22 villages were added, making a total of 30 villages monitored between 1975 and 1980. In 1980, 8 further villages were added, making a total of 38 villages monitored between 1980 and today. Though measles mortality was about the same in a village affected by measles during the epidemics of 1973, 1976-77 or 1981-82, the proportion of villages affected was lower in 1981-82 or 1976-77 than 1973, resulting in a lower mortality rate for the whole population under surveillance. Concerning the epidemics of 1985, vaccinations were made during the epidemics, which resulted in a lower mortality than during previous epidemics.
Figure 3: Fluctuations of measles mortality among children aged less than five years at Bandafassi from 1970 to 1994
0 0 , 1 0 , 2 0 , 3 0 , 4 0 , 5
j a n v -7 0
j a n v -7 2
j a n v -7 4
j a n v -7 6
j a n v -7 8
j a n v -8 0
j a n v -8 2
j a n v -8 4
j a n v -8 6
j a n v -8 -8
j a n v -9 0
j a n v -9 2
j a n v -9 4 T w o m o n th s p e r i o d
A nnual m eas le s m o rt al it y rat e
s t a r tin g o f p r o g r a m o f i m m u n iz a tio n in t h e a r e a ( J a n u a r y 1 9 8 7 ) n u m b e r o f v i ll a g e s f o ll o w e d - u p :
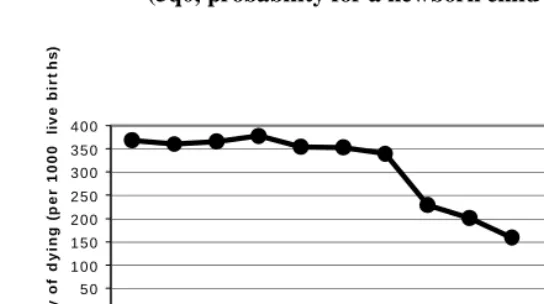
Figure 4: Evolution of child mortality at Mlomp from the 1930s (5q0, probability for a newborn child of dying before age five)
0 5 0 1 0 0 1 5 0 2 0 0 2 5 0 3 0 0 3 5 0 4 0 0
19 30 -3 4 19 35 -3 9 19 40 -4 4 19 45 -4 9 19 50 -5 4 19 55 -5 9 19 60 -6 4 19 65 -6 9 19 70 -7 4 19 75 -7 9 19 80 -8 4 19 85 -8 9 19 90 -9 4 19 95 -9 9
p e r iod
p r o b a b ilit y o f d y in g ( p e r 1000 li ve b irt h s )
Note: before 1985, the estimates are by generation of birth and are derived from the childbirth histories collected retrospectively in the initial census in 1985. After 1985, the estimates are by period, using data collected prospectively by the surveillance study.
3.3.4 The evolution of mortality and the causes of death at Mlomp compared with Bandafassi
Figure 4 shows the evolution of child mortality among children under 5 years old at Mlomp from the 1930s, as retraced retrospectively from the childbirth histories collected in the initial census in 1985. Up to the mid-1960s the risk for children of dying before age 5 remained at the same level – between 350 and 400 per thousand. From the mid-1960s, it started to go down until it fell below 100 per thousand in the second half of the 1980s. Such a fast decline can be attributed to the health infrastructure and programmes that were created in the 1960s and 1970s (Pison et al., 1973).
Figure 5a: Neonatal mortality (from 0 to 28 days) by cause of death, Comparison between Mlomp and Bandafassi
0 10 20 30 40 50 60 70 80 90 1 00
M l omp 19 85 -8 9 Bandaf assi 19 84 -8 9
R is k of dy in g ( p e r t h ous a n d
) ot her cause and undet ermi ned
congenit al mal format i on
ot her infect ion
pneumopat hy
diarrhoea
neonat al t et anus
del ivery t rauma
premat ure birt h
Figure 5b: Mortality from age 28 days to age 5 years by cause of death, Comparison between Mlomp and Bandafassi
0 5 0 1 0 0 1 5 0 2 0 0 2 5 0 3 0 0
M lomp 1 9 8 5 -8 9 Bandafassi 1 9 8 4 -8 9
R isk o f d y in g (p e r t h o u san d )
Neonatal mortality is lower by half at Mlomp compared with Bandafassi (36 per thousand and 87 per thousand respectively). The overall difference is due to differences in mortality concerning all the major causes of death: firstly, neonatal tetanus, which was responsible for 1 neonatal death in 4 at Bandafassi in that period – it caused approximately 20 newborn children out of 1,000 to die – whereas at Mlomp, it was responsible for 1 death in 1,000. Virtually the same contrasts can be observed concerning mortality due to premature birth and insufficient weight at birth (2 per thousand, as against 21 per thousand), or mortality related to delivery trauma (3, as against 12), etc. After the neonatal period (Figure 5b), there is an even greater difference in the overall levels of mortality (45 as against 277 per thousand), and this too is related to differences in mortality due to each significant cause of death – diarrhoea and malnutrition, pneumopathy, malaria, etc. The measles, which were still a significant, though declining cause of death at Bandafassi in those days, did not affect children at Mlomp. Considering that mortality at Bandafassi reflects the mortality pattern that prevailed at Mlomp up to the 1960s, it appears that mortality has declined at Mlomp as a result of the decline in each significant cause of death.
3.3.5 Malaria, a cause of death on the increase again
The curve of child mortality shows that the decline came to a standstill, and that mortality even rose again in the 1990s, both at Bandafassi and Mlomp. One reason for this is that mortality rose significantly again due to malaria.
As mentioned above, malaria is a cause of death that cannot be identified with any certainty through the verbal autopsy method, because it is difficult to distinguish from other diseases that also cause fever. In the case of Mlomp, however, malaria-related mortality could be retraced with some accuracy, because many of the children who died after bouts of fever had consulted at the local health centre, where biological tests (using thick blood films) were made to see whether the malaria diagnosis should be confirmed.
Senegal, Niakhar. This is one of the reasons why overall child mortality went up again in the 1990s. Interestingly, Senegal, unlike certain African countries that are severely affected by AIDS, has been largely spared, and the disease is not a significant cause of death there (UNAIDS, 2004). This is particularly clear as far as the population observatories are concerned, as the rise in child mortality was proved to be unrelated to AIDS.
Through the population observatories at Bandafassi and Mlomp, we have presented the principle of observatories and illustrated their potential for improving the understanding of demographic and social changes by means of a specific example, the evolution of mortality and the causes of death among children.
Figure 6: Evolution of malaria-related child mortality at Mlomp (5q0, risk that a newborn child will die of malaria before reaching age 5)
0 5 10 15 20 25 30 35 40
1985 1990 1995 2000
5
q
0
(
p
e
r t
hous
a
4. Conclusion
In the second part of this paper we gave two examples of population observatories by presenting in some detail the results that they yielded concerning the evolution of mortality and the causes of death among children aged under 5. In the case of Mlomp, child mortality started to decline from the mid-1960s, with the development of health infrastructure and programmes. Thanks to the observatory, the extent of the decline could be measured, and it was possible to show that the main factor in such a rapid and sharp decline was a significant decrease in mortality for the individual causes of death, a sign that the various health interventions were well coordinated and complementary. The halt in the decline of mortality in the 1990s does not mean that changes have stopped altogether. The overall stagnation of mortality rates masks a number of underlying changes, with certain causes of death declining or disappearing while others are on the rise again.
References
Aziz K.M.A., Mosley W. Henry. The history, methodology and main findings of the Matlab project in Bangladesh. In Das Gupta M et al. (eds.) Prospective
community studies in developing countries, 1997, Clarendon Press, Oxford
University Press, 28-53.
Das Gupta Monica, Aaby Peter, Garenne Michel and Pison Gilles (eds.) Prospective
community studies in developing countries, 1997, Clarendon Press, Oxford
University Press, 350 pages.
Desgrées du Loû A., Pison G. Barriers to universal child immunization in rural Senegal, five years after the accelerated Expanded Program on Immunisation. Bulletin of
the World Health Organization, 1994, 72 (5):751-759.
Desgrées du Loû A., Pison G. - Le rôle des vaccinations dans la baisse de la mortalité des enfants au Sénégal. Population 1995, (3):591-620.
Guyavarch Emmanuelle, 2003 – Démographie et santé de la reproduction en Afrique sub-saharienne. Analyse des évolutions en cours. Une étude de cas: l’observatoire de population de Bandafassi (Sénégal). Thèse de doctorat, Museum National d’Histoire Naturelle, Paris. 349 p. + annexes.
Hayes R., Mertens T., Lockett G., Rodrigues L. – Causes of adult deaths in developing countries: a review of data and methods. World Bank, Washington DC Working
Paper 246, 1989.
INDEPTH network, Population and health in developing countries, 2002, International Development Research Centre, Ottawa, 339 pages.
Lagarde E., Schim va der Loeff Maarten, Enel C., Holmgren Birgitta, Spira Rosemary, Pison Gilles, Piau Jean-Pierre, Delaunay Valérie, Mboup S., Ndoye I., Coeuret-Pellicer M., Whittle H., Aaby P. Mobility and the spread of human immunodeficiency virus into rural areas of West Africa International Journal of
Epidemiology 2003a, 32: 744-52.
Lagarde E., Guyavarch E., Piau J.P., Gueye-Ndiaye A., Seck K., Enel C., Pison G., Ndoye I., Mboup S. Treponemal infection rates, risk factors and pregnancy outcome in a rural Senegal. International Journal of STD and AIDS, 2003b, 14:208-15.
Prospective community studies in developing countries, 1997, Clarendon Press,
Oxford University Press, 253-75.
Pison G. , Trape J.F., Lefebvre M. , Enel C. - Rapid decline in child mortality in a rural area of Senegal. - International Journal of Epidemiology 1993, 22(1): 72-80.
Pison G, Gabadinho A & Enel C (2001) Mlomp (Sénégal): niveaux et tendances
démographiques 1985- 2000. Dossiers et recherches N° 103. Institut National
d'Etudes Démographiques, Paris, pp. 1-181.
Trape JF., Pison G., Preziosi MP., Enel C., Desgrées du Loû A, Delaunay V., Samb B., Lagarde E., Molez JF., Simondon F. - Impact of chloroquine resistance on malaria mortality. C.R Acad. Sci. Paris Sciences de la vie 1998, 321: 689-97.
Appendix
Box 1: An example of a questionnaire, with list of names, used during the annual survey at Bandafassi
The list, in which the composition of the household is described (in this instance, as on 1 March 2001), is used as a questionnaire for the annual survey during the next visit, in February or March 2002.
Note: The names and information mentioned in this example are imaginary and concern no real households
Village: ETYES 4 Hamlet: 2
Subgroup head: Mama Yale KEITA Batialka 9782
MEN
9782 1 aged 31 Tama Mama Yale KEITA Batialka Born at Mangama
Father: DCD 9340 Dondo Byadine
Mother: 9341 Kuma Sira Numu SAMURA Bandiel Married to: 9570 Meta, Sophie / 0 / 0 / 0
Is he present? - Yes
No -> Death date: Away – Where: Since when ?
WOMEN
9570 2 aged 27 Niafo Meta, Sophie KANTE Bandiel Born at Iwol Father: DCD 9302 Charo Bakari
Mother: 9306 Niano Manata KEITA Bamana Married to: 9782 Mama Yale
Last two childbirths:
96878 1 born 15/12/98 Dondo Tungumun Father9782: Mama Yale 95708 2 born 15/09/96 Kuma Niitabi Father9782 Mama Yale Are they present? – Yes
No -> Death date:
Since last year, - has she had a child born alive?
Yes No
- has she had a stillborn child? Yes No
- has she had an abortion ? Yes No
Is she pregnant? Yes No Yes No
90782 1 aged 11 Charo Yata KANTE Bandiel Born at Iwol Is he present? - Yes
No -> Death date: Away – Where: Since when?
94133 2 aged 7 Niano Machend KAMARA Batialka Born at Etyes Is he present? - Yes
No -> Death date: Away - Where Since when ?
95708 2 aged 4 Kuma Niitabi KAMARA Batialka Born at Etyes Is he present? - Yes
No -> Death date: Away - Where Since when ?
96878 1 aged 2 Dondo Tungumun KAMARA Batialka Born at Etyes Is he present? - Yes
Box 2: Questions asked during the verbal autopsy survey in suspected cases of diarrhoea or dysentery with a view to more precise description of symptoms. Observatory at Bandafassi in Senegal.
N DIARRHOEA OR DYSENTERY
n
n How long did it last? n When did it start? n When did it end?
n How many stools a day did the person have? N Were the stools
n water-like (colourless)? Yes No
n spittle-like? Yes No