Patron: Her Majesty The Queen Rothamsted Research Harpenden, Herts, AL5 2JQ Telephone: +44 (0)1582 763133 Web: http://www.rothamsted.ac.uk/
Rothamsted Research is a Company Limited by Guarantee Registered Office: as above. Registered in England No. 2393175.
Rothamsted Repository Download
A - Papers appearing in refereed journals
Crook, E. M. and Watson, D. J. 1948. Studies on the storage of potatoes
I. Changes in composition during storage . The Journal of Agricultural
Science. 38 (4), pp. 440-457.
The publisher's version can be accessed at:
•
https://dx.doi.org/10.1017/S0021859600006249
The output can be accessed at:
https://repository.rothamsted.ac.uk/item/96x4w/studies-on-the-storage-of-potatoes-i-changes-in-composition-during-storage
.
© Please contact [email protected] for copyright queries.
[ 440 ]
STUDIES ON THE STORAGE OF POTATOES
I. CHANGES IN COMPOSITION DURING STORAGE IN CLAMPS
BY E. M. CROOK* AND D. J. WATSON, Rothamated Experimental Station, Harpenden, Herts (With Four Text-figures)
E x p e r i m e n t a l p r o c e d u r e . . . . 1 9 4 2 - 3
1 9 4 3 - 4 A n a l y t i c a l m e t h o d s
D r y - m a t t e r c o n t e n t . . . . S u g a r c o n t e n t . . . . . S t a r c h c o n t e n t
T o t a l n i t r o g e n c o n t e n t
A s c o r b i c - a c i d c o n t e n t . . . . N i t r o g e n d i s t r i b u t i o n . . . .
R e s u l t s
( 1 ) C h a n g e s i n p e r c e n t a g e c o m p o s i t i o n . D r y - m a t t e r c o n t e n t . . . . S u g a r c o n t e n t . . . . .
C O N T E N T S
PAGE
. 440 . 440 . 441 . 441 . 441 . 442 . 442 . 442
. 442 . 443
. 443 . 443 , 444
Starch content Nitrogen content
Ascorbic-acid content . . . . . Relation of sugar c o n t e n t t o t e m p e r a t u r e . (2) Changes in the absolute weights of different c o n s t i t u e n t s . . . . W a t e r a n d d r y m a t t e r
T o t a l n i t r o g e n . . . .
S u g a r s
S t a r c h a n d r e s i d u a l d r y m a t t e r . C o o k i n g t e s t s
P r a c t i c a l s i g n i f i c a n c e o f t h e r e s u l t s
S u m m a r y
R e f e r e n c e s . . . .
PAGE
445 446 446 446
449 449 452
452 453 454 454
456
457
During the war years potatoes formed a very important part of the national diet, and provision for increased production was made by greatly expanding the acreage grown. It was no longer possible to import new potatoes in the spring and early summer, and to provide supplies in this period before the new home-grown crop became available in quantity it was necessary to hold large stocks in clamp storage until July or later, over a much longer period than was common in peace-time. A knowledge of the wastage to be expected during prolonged clamp storage was therefore necessary to plan disposal of the crop and to determine the amounts to be retained in storage as the season advanced, so that adequate supplies would be available at all times of the year. Information on the causes of wastage was also desirable to provide a basis for its control, if only by ensuring that stocks of potatoes liable to high wastage should be con-sumed early in the season.
In the autumns of 1942 and 1943, an investigation of the amount and causes of wastage during pro-longed clamp storage was carried out at Rothamsted and other centres. For this purpose, several clamps were set up, each divided into a number of sections, separated by vertical walls of stout wire-mesh supported by stakes, covered with sisalkraft paper and lined with a layer of straw. The potatoes in
* Now at University College, London.
each section were weighed when the clamps were set up. From January onwards, at intervals of approximately a month, one section of each clamp was taken down, the contents were sorted, weighed and examined to determine the proportion of sound tubers surviving, the extent of sprouting and the loss in weight of the clamp contents, and to identify the causes of rotting of the discarded tubers. The results of this investigation are to be reported elsewhere.
It was decided to take the opportunity provided by these experiments to study the change in com-position of potatoes during storage in clamps. Little information on this subject has been published, although it has considerable interest both in relation to the physiology of the tubers and to their nutritive value. It was hoped, also, that the information obtained would throw light on the magnitude and causes of the loss in weight of tubers during storage other than wastage due to infection with fungal and bacterial pathogens.
EXPERIMENTAL PROCEDURE
1942-3. A clamp of Arran Banner tubers with
de-E. M. CROOK AND D. J. WATSON
441
creasing to 6 in. on the ridge; overall length 45 ft. The clamp was earthed up completely at the time of its construction, and no straw vents were made through the soil cover. The whole soil casing was removed on 23 April. The clamp was orientated with its length running from east to west, and the sections were taken down in succession starting from the west end.
At the time when the clamp was built, and on each occasion when a section of the clamp was opened for weighing, three independent samples each of 20 sound, desprouted, ware-size tubers were taken for analysis. The last two sections were sampled on the same date.
1943-4. Three clamps, one (^4.) of Arran Banner
and two (B and C) of Majestic potatoes were built on 4-7 October. Each of them had six sections. The dimensions of the clamps were: potatoes, width of base 7 ft. 4 in., height 2 ft. 9 in.; straw casing 5 to 6 in. thick; soil casing 1 ft. thick at base decreasing to Gin. on the ridge; overall length 36ft. Until
10 November they were covered only with straw. On 10-12 November, the old straw was removed and replaced by a fresh layer, after which the clamps were covered with soil to within 2 ft. of the ridge. The final earthing-up of the ridges was completed on 23 November. One straw vent was made through the soil cover on the ridge of each section of the Majestic clamps, but the Arran Banner clamp had no vents. The clamps were treated identically until 13 April, when the whole soil casing was removed from A and B. The soil on clamp C was left un-disturbed until the end of the experiment in July. The orientation of these clamps was the same as that of the 1942-3 clamp.
The samples taken in 1942—3 provided information only on the changes in percentage composition. In order that changes in the absolute amounts of the different constituents could be determined, in 1943—4 weighed samples of approximately 28 1b. of Majestic potatoes (about 80 ware-size tubers) were enclosed in 1 in. mesh wire-netting bags and placed in clamps
B and C at the time when they were built. Three
such samples, referred to as 'bag-samples', were placed in each section, one half-way up the north face with its outer surface flush with the surface of the bulk of potatoes, another in a similar position on the south face, and a third at the centre of the clamp. For this purpose part of the stock of potatoes was carefully sorted, and all tubers showing 'blight' lesions, or otherwise damaged, were rejected. In this way complications due to rotting of the tubers were almost completely avoided. Only 10 tubers, out of a total of nearly 3000, were found to be rotted when the samples were removed from the clamp, and only a small part of each was affected. On every occasion when sections of the clamps were taken down for weighing, six of these bag samples, three
from each clamp, were removed for analysis. Two similar samples had previously been taken at the time when the clamps were built.
In addition to the bag samples from clamps B and
C, a sample of about 20 lb. of sound, desprouted
ware-size tubers was taken from the bulk of potatoes in clamps A, B and O on each occasion when a section was removed. These are referred to as ' bulk samples'.
On removal from the clamps, the samples were scrubbed in water, dried and weighed. The following determinations were made on the tubers:
(1) Dry-matter percentage of fresh weight. (2) Sucrose, reducing sugars and starch per-centage of dry matter (bag samples only, in 1943-4). (3) Total nitrogen percentage of dry matter. In 1942-3 the distribution of the total nitrogen into three fractions, insoluble, soluble-coagulable and soluble-non-coagulable was determined.
(4) Ascorbic acid, mg. percentage of fresh weight (in 1942-3 only).
Sprouts were first observed on the Arran Banner potatoes in January 1943, and in February 1944. A few were beginning to develop on the Majestic potatoes at the March sampling in 1944, but weigh-able quantities were not present until the following occasion, in April. The Majestic potatoes were thus about 2 months later in producing sprouts than the Arran Banner. This varietal difference is well known, and the late sprouting of Majestic is the reason why it was preferred for late storage during the war years. The sprouts on the bag samples were removed, washed and weighed, and their dry-matter and total nitrogen contents were determined.
In 1943-4, continuous records were made of the temperature of the potatoes at positions corre-sponding to those of the bagged samples, in the section of each clamp which remained until the end of the storage period. A full account of the results will be given later, but use of some of the records has been made in this paper in connexion with the changes in sugar content. Temperature records are not available for 1942-3; recording thermographs were installed in a clamp of similar construction to that used for the present work, but unfortunately the potatoes in this clamp suffered from a severe attack of bacterial rotting following blight infection, and the clamp collapsed at the end of April. It is, therefore, unsafe to assume that the temperatures recorded were the same as in the clamp used for the present work; they were probably much higher.
ANALYTICAL METHODS
Dry-matter content. Each tuber of a sample was
cut off. In this way an approximately constant proportion of each tuber was removed, and the different tissues were sampled in proportion to their weights in the tuber. The wedge-shaped pieces were combined to form a subsample of approximately 200 g. fresh weight. The sub-samples were put in a drying-room at about 50° C. for 2-3 days, and then transferred to a steam-oven for 24 hr. On some occasions in 1942-3 duplicate samples were dried more rapidly by putting them directly into an electric oven at 100° for 24 hr., with ventilation by a current of air for the first 5 or 6 hr. The subsamples taken for alcohol extraction in pre-paration for the estimation of sugars (see below) also provided estimates of dry-matter content, obtained by adding the weight of alcohol insoluble dry matter remaining after extraction, to the weight of soluble dry matter determined on an aliquot of the extract. The three methods of estimation gave almost identical results, as shown by the following means taken over nineteen samples on which determinations were made by all three methods:
Mean dry-matter percentage
Slow Rapid Alcohol drying drying extraction s.E.
20-3 20-3 20-4 ±0-16
The values quoted in the tables are t h e means of all three methods.
Sugar content. A subsample was taken from t h e
tubers in the same way as for the estimation of dry-matter content. The slices were cut up finely, well mixed, and a 20 g. portion was dropped into 100 ml. of boiling 9 5 % alcohol. The extraction was con-tinued under a reflux condenser for about 1 hr. After an interval of storage, t h e material was further extracted in a Soxhlet for 8 hr. An aliquot of the extract was then evaporated under reduced pressure a t 30-35° C. until all alcohol was removed, and t h e residue taken u p in water.
The sugars in the unclarified aqueous extract were estimated, after suitable dilution, by the method of Harding and Downs as modified by van der Plank (1936). Three determinations were made: (1) before inversion, (2) after inversion with invertase, (3) after fermentation with baker's yeast, to provide an estimate of t h e non -sugar reducing substances present. The difference between (1) and (3) gave the reducing sugar content, and t h a t between (2) and (1) the sucrose content. Reducing sugars were estimated as invert sugar.
Starch content. Starch in the insoluble residue
after alcohol extraction was estimated by the method of Hanes (1936), with minor modifications. The dried residue was first treated with boiling alcohol, con-taining 1 % v/v of cone. HC1, to solubilize the starch, washed with alcohol and dried. A portion of t h e solubilized residue was twice extracted with boiling
water, t h e extracts were combined, and together with the insoluble material made up to volume. After shaking, the insoluble material was allowed to settle and the greater part of the supernatant was filtered on a coarse paper with suction, care being taken to avoid stirring up the insoluble material which readily clogged t h e filter. The soluble starch in the extract was hydrolysed with j8 malt-amylase, prepared by Hanes's method. The maltose produced was estimated by Harding and Downs's method as modified by van der Plank (1936), the copper re-agent having previously been standardized with maltose twice recrystallized from 60 % alcohol.
Total nitrogen content. This was determined on t h e
samples previously dried for the determination of dry-matter content. The dried material was finely ground and well mixed, and its total nitrogen content determined b y micro-Kjeldahl, on portions of approximately 100 mg., using a 1:1: 8 CuSO4, SeO2, K2SO4 catalyst. The ammonia liberated on distilla-tion was absorbed in 2 % boric acid and titrated with N/28 HC1, using a methyl red, brom cresol green indicator, as described by Conway & O'Malley (1942). Duplicate determinations were done on each sample.
Nitrogen estimations were done on both sets of dry-matter samples, i.e. those dried slowly in a drying-room, and those dried rapidly in an electric oven (see above). The average nitrogen contents determined on comparable subsamples of sixteen samples of tubers, dried by t h e two methods were:
Mean N percentage of dry matter
Slow drying
1-409
Rapid drying 1425
S.B.
±0-016
The difference between the means was not significant, and there was no evidence of variation with time of sampling between the results for the two methods. The tabulated values are means of the two sets of dried samples.
Ascorbic-acid content. Ascorbic acid was estimated
E. M. CROOK AND D. J. WATSON
443
acid so that the oxidases were inactivated. The mixture of acid and tissue was centrifuged, and the clear supernatant decanted off. The extraction was twice repeated with 15-20 ml. of fresh acid. The combined extracts were made up to 100 ml. with more acid and titrated against a standardized solution of 2:6-dichlorophenolindophenol. Ascorbic-acid content was expressed in mg./lOO g. fresh weight.
Nitrogen distribution. This was determined on two
of the three samples of tubers taken on each occasion in 1942-3. Wedge-shaped slices were cut from each tuber of a sample, as for dry-matter determination, to give a subsample of about 20 g. weight. This was ground in a mortar with 8 g. acid-washed sand and sufficient 2 % NaCl solution to form a slurry. The liquid was separated by squeezing through fine cotton fabric. The grinding and extraction with NaCl solution was repeated twice more. The com-bined extracts were made up to 200 ml. with 2 % NaCl solution and centrifuged, the pellet being added to the insoluble residue. The residue was dried and weighed, and the insoluble nitrogen in it estimated by micro-Kjeldahl. Two 10 ml. aliquots of the super-natant were transferred to hard glass centrifuge tubes, and heated in a boiling water-bath for 5 min. after a coagulum appeared. After cooling they were centrifuged. The pellet was dissolved in 50% sulphuric acid, and the soluble-coagulable nitrogen in it estimated by micro-Kjeldahl. Nitrogen was also estimated in 2 ml. samples of the unheated fluid, giving the total soluble nitrogen, from which the soluble non-coagulable nitrogen was obtained by difference.
Neuberger & Sanger (1942) have shown that the soluble coagulablo nitrogen corresponds closely to that precipitated by various protein precipitants such as trichloracetic acid and lead acetate. It may thus be taken as a measure of the soluble protein. These workers also showed that 2 % NaCl extracts practically all the 'soluble' nitrogen and that very little more is obtained by more drastic and laborious methods. Of the 10% or so of nitrogen which remains insoluble, about half may be rendered soluble by digestion with pepsin at pH 1-5, so that it may be assumed that at least part of this is protein.
Neuberger & Sanger have found that the insoluble nitrogen forms a much greater fraction of the total nitrogen in the peel than in any other part of the tuber; their results show that although the peel contained less than 10 % of the total nitrogen of the potato, this included about 25 % of the insoluble nitrogen.
The non-protein (soluble non-coagulable) nitrogen consists mostly of amides (glutamine and aspara-gine) and amino-acids in approximately equal amounts.
RESULTS
(1) Changes in percentage composition
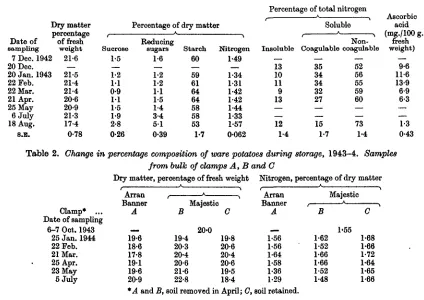
Table 1 shows the changes in percentage composition of the potatoes during storage in 1942-3, and Tables 2 and 3 give corresponding information for the bulk samples and bag samples, respectively, in 1943-4. The standard errors shown in Table 1 were calculated from the variances between samples within sampling times, that is to say, within sections of the clamp, and they are, therefore, not strictly appropriate for comparisons between values for different dates of sampling, involving differences between sections. To obtain appropriate standard errors for such com-parisons, it would have been necessary to take samples from more than one section of the clamp on each date. The standard errors are given as an indication of the variability between comparable samples. Only a small part of this variability, about 9% for dry-matter content and 18% for total nitrogen content, was attributable to the laboratory operations, including subsampling. The main source of error was variability in the composition of the potatoes, and consequently increased accuracy could have been secured only by increasing the size of the samples. The results for 1943-4 are probably more accurate than those for 1942-3, because the single sample taken from each section of a clamp in 1943-4, especially the bag samples, included a larger number of tubers than the three samples taken from a section in 1942-3.
Dry-matter content. Dry-matter percentage of
fresh weight of the Arran Banner potatoes decreased slightly in the period between the setting up of the clamps and the end of April in both years (Tables 1 and 2), -while that of the Majestic potatoes tended to increase (Tables 2 and 3a). In all three clamps from which the soil casing was removed in April (1942-3, A and B of 1943-4) there was an increase in dry-matter content between the end of April and early July. More prolonged storage until early August, in 1942-3, caused a very marked decrease of dry-matter content. When the soil casing was retained (C, 1943-4) there was a steady decrease in dry-matter content between April and July.
444
Studies on the storage of potatoes
normal times would be unsaleable for human con-sumption. The tubers from the clamp on which the soil was retained were still firm in July.
The differences in dry-matter content between the bag samples on the north and south sides and in the centre of clamps B and C, 1943—4, varied somewhat irregularly between sampling times, but means for the first three and last three times (Table 36) show a consistently higher dry-matter content at the side positions than in the centre. The differences were very small, except in the later period (sampling 4-6) for clamp B. The removal of the soil from this clamp
seasons. In the Arran Banner potatoes used in 1942-3 (Table 1) both sucrose and reducing sugars percentage of dry 'matter decreased slowly to a minimum at the end of March, and subsequently rose to high values in August, at which time the total sugars accounted for 8 % of dry matter. The reducing sugar content was usually slightly higher than the sucrose content and the difference increased greatly at the end of the storage period.
In 1943-4 (Table 3 a) the sucrose and reducing sugar contents of the Majestic potatoes increased steadily between October and March. This was Table 1. Change in percentage composition of ware potatoes during storage. Arran Banner, 1942-3
Percentage of total nitrogen
Date of
sampling 7 Dec. 1942 20 Dec. 20 Jan. 1943 22 Feb. 22 Mar. 21 Apr. 25 May 6 July 18 Aug. S.B. Dry matter percentage of fresh weight ! 21-6 : 21-5 21-4 21-4 20-6 20-9 21-3 17-4 0-78 Sucrose 1-5 1-2 1 1 0-9 1 1 1-5 1-9 2-8 0-26
Percentage of dry matter
Reducing sugars 1-6 1-2 1-2 1 1 1-5 1-4 3 4 5 1 0-39 Starch 60 59 61 64 64 58 58 53 1-7 Nitrogen 1-49 1-34 1-31 1-42 1-42 1-44 1-33 1-57 0062 Insoluble 13 10 11 9 13 12 1-4 Soluble Coagulable 35 34 34 32 27 15 1-7 Non-coagulable 52 56 55 59 60 — — 73 1-4 Ascorbic acid (mg./lOO g fresh weight) 9-6 11-6 13-9 6-9 6-3 — — 1 3 0-43
Table 2. Change in percentage composition of ware potatoes during storage, 1943-4. Samples
from bulk of clamps A, B and G
Dry matter, percentage of fresh weight Nitrogen, percentage of dry matter
Clamp* ... Date of sampling 6-7 Oct. 1943
25 Jan. 1944 22 Feb. 21 Mar. 25 Apr. 23 May 5 July .Arr&o A 19-6 18-6 17-8 191 19-6 20-9 A Majestic B 20-0 19-4 20-3 20-4 20-6 21-6 22-8 C 19-8 20-6 20-4 20-6 19-5 18-4 ArrATl X X X l C b l l
A __ 1-56 1-56 1-64 1-58 1-36 1-29 Majestic B 1-55 1-62 1-52 1-66 1-66 1-52 1-48 C 1-68 1-66 1-72 1-64 1-65 1-66
*A and B, soil removed in April; C, soil retained.
caused a n appreciably greater increase in d r y - m a t t e r content of t h e tubers a t t h e n o r t h a n d south sides of t h e clamp t h a n in t h e centre.
The d r y - m a t t e r content of the sprouts fell slightly between t h e April a n d May samplings in 1944, b u t subsequently increased (Table 3). I t was higher in clamp B t h a n in clamp C, a n d a t t h e centre of t h e clamps t h a n a t t h e sides. These differences were in t h e opposite sense t o those found in t h e tubers. T h e water content of t h e sprouts was evidently n o t determined b y t h e s t a t e of h y d r a t i o n of t h e tubers t o which t h e y were a t t a c h e d .
Sugar content. T h e drift with time in t h e sucrose
a n d reducing sugar contents differed in t h e t w o
followed b y a fall a n d later b y a rise between May a n d early J u l y . T h e final rise in reducing sugar content did n o t occur in t h e t u b e r s on clamp C, on which t h e soil was retained. The content of reducing sugars was usually less t h a n t h a t of sucrose, a n d t h e reducing sugar content of t u b e r s in b o t h clamps in J u l y was m u c h below t h a t found in t h e previous year. T h e reducing sugar content of t h e samples t a k e n in October 1943, a t t h e time when t h e clamps were built, was very low compared with those of all other samples in b o t h seasons, a n d this m a y b e a characteristic of tubers immediately after lifting.
E. M. CROOK AND D. J . WATSON
445
a lower sugar content, especially of reducing sugars, than C. There is evidence, set out in a later section, that the rise and subsequent fall of sugar content between January and May 1944, and the difference between clamps in this period, was related to temperature variation, which is known to affect the starch/sugar relation in potatoes. In this year the temperature of the potatoes fell to a minimum in March and then began to rise. The temperature records for 1942-3 showed a fairly steady rise from December onwards, and this may explain the
Barker (1937), who showed that in Bang Edward potatoes stored at 10° C. the total sugar content decreased slowly until April, remained level until the middle of May and then began to rise. The same sequence of changes occurred at 15° C, but more quickly, the minimal sugar content being reached in February. At 7-5° C. there was a small initial rise of sugar content, but this was followed by a fall, and the final rise did not begin until May and was not so rapid as at the higher temperatures. Barker's paper gives no information on the time drifts in the sucrose
Table 3. Change in percentage composition of ware potatoes. Majestic, 1943-4.
Bag samples from clamps B and C (a) Means of north, centre and south positions
Percentage of dry matter
Sample Initial 1 2 3 4 6 6 Clamp* ... Date of sampling 6-7 Oct. 1943
25 Jan. 1944 22 Feb. 21 Mar. 25 Apr. 23 May 5 July
D r j
t B ' matter, of fresh C Tubers 20-1 20-4 20-1 20-7 21-2 21-1 22-7 20-2 20'0 20-3
2 1 1
19-9 19-3 percentage weight B C Sprouts A ( ^ 12-2 130 11-6 12-2 140 16-5 Sucrose K^ t B 1-1 0 1-3 1-7 1-0 1 0 1-5 \ C 1 0-9 1-4 1-9 1-0 0-8 1-8 Reducing sugars A. f B 0 Tubers 0-2 0-7 1 1 1-1 1-2 1 0 1-2 0-9 1-4 1-7 1-0 1-0 0-7 Starch K ( B C 58 57 48 48 47 50 39 58 47 47 46 51 40 B Nitrogen 0 Tubers i \ 1-55 1-60 1-56 1-64 1-58 1-63 1-67 1-60 1-62 1-70 1-66 1-73 1-65 B
a
Sprouts f r 3-28 3-303 1 4
—
—
—
3-33 3-47 3-68(6) Means of first three and last three sampling dates, for each position Percentage of dry matter
Dry matter percentage of fresh weight
Mean of samples ...1-3 4-6 Tubers
Clamp B, North Centre South Clamp 0, North Centre South 20-4 20'2 20-3 200 20-2 221 21-0 22-0 19-9 200 20-4 4-6 Sprouts 12-4 13-2 12-2 13-4 14-3 14-0 Sucrose 1-3 4-6 Reducing sugars 1-3 4-6 Tubers Starch 1-3 4-6 Nitrogen
1-3 4-6 4-6 Tubers Sprouts 1-4 1-3 1-2 1-5 1-5 1-2 12 1-2 1-2 11 11 1-3 1-2 0-8 0-9 20 10 0-9 1-5 10 1-0 1-2 0-9 0-6 49 54 50 50 51 50 46 45 44 48 44 46 1-56 1-63 1-60 1-57 1-72 1-63 1-59 1-68 1-61 1-70 1-65 1-69 316 3-21 3-35 3-60 3-45 3-43
* B, soil removed in April; C, soil retained
absence of a rise in sugar content during the early part of this storage season.
The reducing sugar content of tubers on the north side of the 1943-4 clamps (Table 36) was higher than in those at the centre and on the south side. There was an indication of a similar but smaller variation of sucrose content with position in the clamp in the early part of the storage period (samplings 1-3), but not later (samplings 4-6).
The rise of sugar content which occurred towards the end of the storage period was probably the result of internal changes associated with age, and not of change in the external conditions. Evidence to support this view is provided by the work of
and hexose fractions of the total sugar content, although apparently they were estimated separately, and it is not stated whether or not both of them increased in the later stages of storage. The final rise of sugar content may be an indication of the beginning of senescence and breakdown of the tuber tissues, and probably has no direct relation to the initiation of sprouting, for although it occurred earlier in 1943, when sprouting of the Arran Banner tubers began in January, than in 1944, when the first sprouts appeared on the Majestic tubers in March, it did not begin until some 2-3 months after the sprouts started to develop.
matter of the tubers (Tables 1 and 3 a) tended to fall as the storage period lengthened. The successive values for 1942-3 show little evidence of any change in starch content between December and July, and in March and April there was an apparent rise above the initial content in December. However, there was a sharp decline in the subsequent period. In 1943-4 starch content fell steadily throughout, except for a temporary increase between April and May, •which was followed by a more rapid fall. The increase in May occurred in both clamps, and as a similar increase was recorded in 1942-3, though earlier in the season, it seems likely that the effect was real and not due to sampling errors. Its cause will be discussed later. The initial starch contents were similar in the two seasons, but in 1943—4 the starch content had fallen to a much lower level in July than in the previous year. This is difficult to reconcile with the fact that sprouting began earlier in 1942-3, and that the weight of sprouts produced in July was greater than in 1943-4. If it is attributable to the varietal difference it implies that relatively less starch than other constituents of dry matter was lost from the tubers during storage in Arran Banner than in Majestic potatoes.
No clear evidence was obtained from the 1943-4 results that the starch content percentage of dry matter of the tubers was dependent on their position in the clamp.
Nitrogen content. Total nitrogen percentage of dry
matter of the tubers varied little, and irregularly, during the storage period; there was no consistent time trend. Clamp A (Arran Banner), 1943—4 (Table 2), unlike the others, showed a marked fall between April and July.
The insoluble, presumably structural, fraction of the total nitrogen of the tubers was almost constant throughout the period of storage in 1942-3 (Table 1). The other fractions showed little change until March. The soluble coagulable fraction then began to de-crease, and by August it had fallen to less than half its initial value. Over the same period the soluble non-coagulable fraction increased correspondingly to 73 % in August, from an initial value of about 50 %. Thus throughout the later part of the storage period, beginning at or soon after the initiation of sprouting, there was a breakdown of protein into smaller mole-cules, presumably amino-acids and amides. These changes were analogous to those in the carbohydrate fractions, but began earlier, and like them may be an expression of senescence of the tubers, or may have a direct relation to the process of sprout development. The nitrogen distribution in August corresponds closely with that found by Street, Kenyon & Watson (1946) in sprouted King Edward seed tubers at the end of April.
In the tubers from the bag samples in clamps
B and C, 1943-4 (Table 36), the nitrogen content
percentage of dry matter was higher at the centre of the clamp than at the sides, and at the south side than the north side, except in clamp B in the later part of the storage period (mean samplings 4-6), where the effects were reversed. These differences were small, and of doubtful significance.
The nitrogen content of the sprouts (Table 3) in 1943-4 was slightly less in clamp B than in clamp O. In clamp B, from which the soil cover was removed, the nitrogen content tended to fall with time, and it increased in the direction across the clamp from the north to the south side. In clamp O, on the other hand, it increased between April and July, and was higher at the north side of the clamp than in the centre or at the south side.
Ascorbic-acid content. The ascorbic-acid content of
the Arran Banner tubers in 1942-3 (Table 1) rose from 10 mg./lOO g. fresh weight in December to a maximum of 14 mg./lOO g. in February, and sub-sequently fell rapidly to the very low value of 1 mg./lOO g. in August. The maximum values corre-sponded with the early stages of sprouting, and this agrees with the results of Pett (1936), who showed that both ascorbic acid and glutathione increased when sprouting began, or was induced by ethylene chlorhydrin, and decreased again as the sprouts grew. Lampitt, Baker & Parkinson (1945) found that the ascorbic-acid content of the peel surrounding sprouting eyes, but not of the whole tuber, increased when sprouting occurred. Other workers, e.g. Zilva & Barker (1938), Smith & Gillies (1940), Rolf (1940) and Karikka, Dudgeon & Hauck (1944) have found that the ascorbic-acid content of potatoes decreased throughout storage at a variety of temperatures, and their records show no evidence of a rise coincident with the onset of sprouting; they found that the fall in ascorbic-acid content was more rapid in the early stages of storage than later. The reason for the dis-crepancy between the two sets of results is not known.
Relation of sugar content to temperature. I t is well known that the starch/sugar balance in potato tubers is sensitive to changes of temperature (Miiller-Thurgau, 1882), and accordingly an attempt was made to account for the variation, in sugar content between the samples of Majestic potatoes in 1943-4 by relating them to the temperatures recorded in the different positions in the clamps.
trans-E. M. CROOK AND D. J. WATSON
447
ferredfroml0to3or 1° C. continued to rise for about 30 days before reaching a new steady value, and at — 1° C. the period of adjustment was even longer. The temperature of the potatoes in a clamp changes continually, and consequently the sugar content of the tubers at any time can rarely be in equilibrium with the temperature at that time. Barker also found that the sugar content after prolonged exposure to a given temperature depends not only on that temperature, but also on the previous tem-perature-history of the tubers. Raising the storage temperature to 15° C. for 24 hr. during sweetening at 1° C. caused deactivation of the sweetening system; on return from 15 to 1° C. there was no further accumulation of sugar, although the sugar content continued to rise in comparable tubers held continuously at 1 ° C. The sensitivity of the sweetening system to a given low temperature may be reduced by a process of hardening or adaptation to inter-mediate temperatures, prior to transfer to the final low temperature (Barker, 1938), so that a gradual fall from a high to a low temperature may cause a smaller change of sugar content than a sudden change over the same temperature range. For these reasons it would be expected that the sugar contents of the potatoes in the clamps, plotted against the temperatures of the potatoes at the times when the sugar estimations were made, would not lie on a single smooth curve, and also that sugar content might be more closely related to the mean tempera-ture over a period prior to the time of sampling than to the temperature at that time. It was found that when sugar content was plotted against mean temperature during 3 days or a week before the date of sampling the points showed less scatter than when plotted against temperature at the time of sampling. Accordingly, the mean temperature during the previous week was selected arbitrarily as an appro-priate measure of temperature with which to correlate sugar content.
Fig. 1 shows the sucrose and reducing sugar con-tents of samples of tubers taken from clamps B and
C in 1943-4 plotted against mean temperature
during the week before the date of sampling. The sugar contents were expressed as g./lOO g. water, because it is likely that the rates of interconversion of the different carbohydrate fractions depend on their concentrations in the cell-sap, and not on their amounts relative to other dry-matter constituents. However, as the variations of dry-matter content during storage were relatively small, very similar relations to temperature were found if the sugar contents were expressed as percentage of fresh weight or dry matter instead of water.
The points in the upper half of Fig. 1, representing sucrose content at different times and in different positions in the clamps, lie in a narrow band which shows no upward or downward trend over the
tem-Journ. Agrio. Soi. 38
perature range from 15 to 6° C, but below 6° C. rises rapidly as the temperature falls. The values for the last sampling date, in July, enclosed in the rectangle in the top right-hand corner of the figure, diverge widely from the smooth trend with change of tem-perature shown by the other points, indicating that the rise of sucrose content at this late stage of storage was attributable to some factor other than tempera-ture change. The lines drawn in the figure join the
06
0-5
0-4
0-3
02
1_ O>
| 0-1
I
0ill 07
06
0-5
0-4
0-3
02
01
Sucrose
D Reducing sugars
_, „ North Centre South Mean (.lamp D • • A x Clamp C a o A +
20 5 10 15
Temperature (°C.)
Fig. 1. The relation of the concentrations of sucrose and reducing sugars, g./lOO g. water, in Majestic potatoes to mean temperature during the week before the date of observation; bag samples from clamps B and C, 1943-4. The full lines join the mean values for the three positions in clamp B (north side, centre and south side) at each occasion of sampling, and the broken lines join corresponding means for clamp G. The rectangle in the top right-hand corner of the figure encloses values for the last date of sampling in early July.
mean values of the three positions in each clamp for different sampling dates. At temperatures below 6° C. the lines for the two clamps fall close together; the points in this region refer to the first three dates of sampling when the clamps had identical treat-ment. This suggests that in this period the small differences between clamps in sucrose content of the tubers (Table 3 a)were due to temperature differences.
448
At temperatures above 6° C, which occurred after the soil casing had been removed from clamp B but not from clamp C, the line joining the mean values of sucrose content for clamp B lies above the corresponding line for clamp G, showing that at comparable temperatures the tubers in clamp B had a higher sucrose content than those in clamp C. The values of reducing sugar content at different times and positions in the clamps, plotted against temperature in the lower half of Fig. 1, have a much wider scatter than the values of sucrose content, and at first sight there is little evidence of any dependence ofreducing sugar content on temperature. However, the lines j oining the mean values of the three positions in each clamp for different sampling times show a similar rise with falling temperature below 6° C. to that found for sucrose, but the lines for the two clamps are more widely separated. At temperatures above 6° C. the difference between the two clamps is even more marked. The line for clamp C (soil retained) shows a slight rise and then a fall with rising temperature; as already noted above there was no final rise of reducing sugar content in this clamp at the end of the storage period. The line for clamp B (soil removed), on the other hand, continues to rise throughout the whole temperature range from 7 to 14° C.
Considering the complexity of the effects of temperature on the starch/sugar relation in potatoes, and the arbitrary use of the mean for the previous week as the measure of effective temperature, the values of sucrose content fit reasonably well to a smooth curve and it is fair to conclude that variation of sucrose content was mainly caused by temper-ature changes. The form of the relation between sucrose content and temperature agrees well with that established for total sugar content by Barker (1936a). Although there is some indication that the content of reducing sugars was also dependent on temperature, a large part of its variation remains unaccounted for by the observed temperature changes, and the factors responsible are not known. It is possible that reducing sugar content is more sensitive to previous temperature-history than sucrose content, and is therefore less closely related to the temperature over a short period before the time of estimation.
Fig. 1 shows clearly that the sucrose content at the end of the storage period rose to higher levels than would be expected from the relation of sucrose content to temperature observed at earlier sampling times. This agrees with the results of Barker (1937), referred to on p. 445, who found that in addition to the direct effect of temperature on the starch/sugar balance, there was a time or seasonal factor causing a rise of total sugar content after long storage at constant temperatures above 7-5° C. This time factor presumably represents a change in the
physio-logical state of the tuber tissues associated with advancing age or senescence. There is no clear evidence of the operation of such a time factor on reducing sugar content. If the apparent increase with rising temperature above 7°C. in clamp B, shown by the line joining the mean values in Fig. 1, is assumed to be due to the time factor, it would follow that its effect on reducing sugar content became apparent much earlier in the storage life than its effect on sucrose content. On the other hand, in clamp C there was a final rise of sucrose but not of reducing sugar. Barker found that the increase of sugar content in the later stages of storage began earlier at high storage temperatures than at low temperatures within the range from 7-5 to 15° C. The mean temperature of the potatoes in clamp B, after the soil cover was removed in April, was con-sistently below that in clamp C, on which the soil cover was retained (Table 6), though the diurnal fluctuation was wider. On the basis of Barker's results it would, therefore, be expected that the age-effect would be greater, and consequently that the sugar content at comparable temperatures would be higher, in clamp G than in clamp B. Fig. 1 shows that the observed differences between the sugar contents of tubers in the. two clamps was in the opposite direction to this expectation. Evidently these differences cannot be accounted for by variation with temperature in the time of incidence of the age-effect, and their cause remains obscure.
Barker (1934, 1936a) found that when potatoes previously held at 10° C. were transferred to tem-peratures between 1 and 5° C, the sucrose/hexose ratio increased during the first 5-10 days and then decreased to lower values. After 30 days' storage at constant temperature, however, the ratio increased almost linearly with increase in the storage tempera-ture. In other words, exposure to low temperature caused a more rapid initial increase in sucrose, but ultimately produced a relatively greater increase in hexose. In the present experiment, the sucrose/ reducing sugars ratio was apparently not closely related to temperature. The ratios for individual samples had a wide scatter, and those calculated from the mean values of the three positions in each clamp showed no steady trend with change of temperature between 15 and 5° C, but there was an indication of a rise at lower temperatures. This corresponds with the effect observed by Barker im-mediately after transfer to low temperature, and suggests that as the temperature of the potatoes in the clamps was continually changing, the full effect of low temperature exposure on the ratio was not developed.
E. M. CROOK AND D. J. WATSON
449
Mean temperature (° C.) during week before sampling Mean of
samplings 1-3
4-6
Clamp
B C B C
North side
4-7 5 1 1 0 1 14-5
Centre 5-9 5-0 10-5 14-2
South side
5-3 5-0 10-7 1 5 1
Mean 5-3 5-0 10-4 14-6 Comparison of these with Table 3 b shows no obvious correlation between sugar contents and mean tem-peratures at different positions in the clamps; this was true also of the results for individual sampling times. The differences between positions in mean temperature were small, and it is possible that variation in the temperature fluctuations about these means were of more importance in determining sugar content than the means themselves. Barker & Wallace (1946) made temperature measurements at various positions in clamps over the period from November to March in two seasons, and found that the total sugar contents of potatoes taken from different positions at the end of February showed a fairly close inverse correlation with the mean temperatures over the whole storage period at these different positions. The temperature differences between positions were greater, and apparently more consistent, throughout the storage period than those found in the present experiment.
(2) Changes in the absolute weights of
different constituents
The dirt tare and percentage composition deter-mined on samples of Majestic potatoes, taken at the time when the clamps were built in October 1943, "were u^sed. to estimate the weights of different con-stituents present initially in the bag samples removed from the clamps at intervals during the storage period. The final weights of the constituents in each sample at the time of removal from the clamp were determined from the fresh weight of the sample after washing, and its percentage composition. The final weight of each constituent was then expressed as percentage of its initial weight, and in this way it was possible to measure the progressive loss or gain in the absolute weight of each constituent through-out storage.
The account which follows deals mainly with the means of the three positions in each clamp. During the earlier part of the storage period the observed differences between positions were usually small, and were not consistent at successive samplings, but later they tended to increase and become less variable. Accordingly, it has been considered sufficient to present the differences between positions for the last date of observation, when they were maximal (Table 4).
Water and dry matter. The changes with time in the
weights of water and dry matter present in tubers and sprouts, percentage of the initial weights of water and dry matter respectively in the tubers, are shown in Fig. 2, and the weights remaining in July are given in Table 4. About 2 % of the water and rather less of the dry matter originally present had been lost in the interval between October and the first opening of the clamps in January. It is probable that much of the water loss occurred before the earthing-up of the clamps was completed in late
100 95 90 85 80 75
85
Water
Tubers
Tubers and o-—o o a sprouts
1
Jan.1 Feb. ' Mar. ' Apr. ' M a y ' June ' July
Fig. 2. Changes with time in weights of water, dry matter and total nitrogen in tubers and sprouts of Majestic potatoes, percentage of initial weight in the tubers; bag samples from clamps B and O, 1943-4; means of three positions in each clamp. The arrow marks the date when the soil casing was removed from clamp B.
November, for the subsequent loss between January and March was negligible. By the end of April the loss of water had increased to about 5 %, but there was apparently no increase in the loss of dry matter. The dry weights of tubers in clamp B on 21 March, and in both clamps on 25 April were apparently above 100% of the initial dry weight; this must be attributed to sampling errors, for no way is known by which dry matter could accumulate during storage. From the end of April onwards, the rate of loss of water from clamp B and of dry matter
450
from both clamps rapidly increased. In clamp G the loss of water continued at about the same rate as in the earlier period, so that much more water was lost between April arid July from clamp B than from clamp C. The dry-matter loss, on the other hand, was about the same in both clamps. In clamp B, from which the soil cover was removed in April, 27 % of the water originally present had been lost from the tubers by the end of the storage period, but the loss in clamp G, which retained its soil cover, was
12% (Table 4, mean of three positions). The corsponding losses of dry matter, 15 and 16 % re-spectively, were nearly equal, and this accounts for the rise of dry-matter content percentage of fresh weight in clamp B, and the fall in clamp 0 (Tables 2 and 3).
About 1 % of the initial water content of the tubers had passed into the sprouts by the end of .
April, and by early July this had increased to 8 %
in clamp B and to 6 % in clamp C (Table 4). Thus
than in the centre (Table 4), and as the recovery in the sprouts varied little with position, there was a greater net loss of dry matter at the centre than at the sides. The dry weight of sprouts was slightly greater at the sides in clamp B, but in clamp 0 it was greater at the centre.
The changes with time in the fresh weight of the tubers, and the differences between and within clamps were determined mainly by the changes in water, because the corresponding changes in dry matter were relatively smaller, and the tubers con-tained about four times as much water as dry matter. This is illustrated in Table 5, which shows the mean losses of water and of dry matter from the tubers and the gains in the sprouts, percentage of the initial fresh weight of the tubers, during the whole period of storage. In clamp B (soil removed) the tubers lost 25 % of their initial fresh weight, and of this 22 % was water and 3 °/o dry matter. In clamp C (soil
retained) the loss of fresh weight was only half as
Table 4. Effect of position in the clamp on the weights of water, dry matter and nitrogen in tubers and sprouts
on 5 July 1944, percentage of the initial weights present in the tubers at the time of clamping on
6-7 October 1943; bag samples of Majestic potatoes
Water Dry matter Nitrogen
Clamp
B (soil removed)
C (Boil retained)
Position North side Centre South side Mean
North side
Centre South side Mean
Tubers 70 77 72 73 90 86 89 88
Sprouts 10
6
9
8 5 7 5 6
Total
79 82 81 81 95 93 94 94
Tubers 84 83 87 85 88 81 83 84
Sprouts
6 4
5
5 3 5 4 4
Total
90 86
93
90 91 86 87 88
Tubers
88 91 94 91 97 82 89 89
Sprouts
17 8 14 13 7 19 17 14
Total
105 99 109 104 104 101 106 104
half of the water lost by July from the tubers in clamp C was present in the sprouts, so that the net loss of water was only 6 %; removal of the soil cover (clamp B) increased the net loss of water to 19%, although more water was present in the sprouts. The recovery of dry matter in the sprouts, like that of water, was slightly greater in clamp B than clamp 0; removal of the soil cover reduced the net dry-matter loss from 12 to 10%.
The weight of water remaining in the tubers on 3 July, percentage of the initial weight (Table 4), was higher at the centre of clamp B than at the sides, but less water was recovered in the sprouts at the centre, so that the total weight of water present in tubers and sprouts varied little with position in the clamp. In clamp C, these effects were reversed; the percentage of original water present in the tubers was lower, and in the sprouts higher, at the centre than at the sides, but again the total weight in tubers and sprouts was almost the same at all positions.
In July, a larger fraction of the original dry matter remained in the tubers at the sides of both clamps
great, and the difference is accounted for entirely by a smaller loss of water; the dry-matter loss per-centage of fresh weight was the same as in clamp B. The recovery of fresh weight in the sprouts was greater in clamp B than in clamp C, and again the difference was almost wholly attributable to the water fraction.
E. M. CROOK AND D. J. WATSON
451
net water loss, allowing for the water recovered in the sprouts, at different positions in the clamp was very small, but there is an indication that it was correlated with the extent of sprouting. In clamp B the weight of sprouts and the net water loss were both smaller, and in clamp C both were greater, at the centre than at the sides. The mean temperature for the period from April to July was higher at the sides than in the centre, especially in clamp G (Table 6), and presumably there was a gradient of atmospheric humidity falling from the centres to the sides. Both these factors would favour more rapid evaporation at the sides. The fact that the net water loss was greater in the centre of clamp O, where the weight of sprouts was also greater, indicates that the presence of sprouts appreciably increased the rate of water loss. However, as the variation between positions in net water loss was slightly smaller than
these results, Barker & Wallace (1946) found that sprouting at the end of February in King Edward potatoes stored in clamps receiving varied treat-ments, and at different positions within a clamp, was correlated directly with mean temperature over the storage period, and inversely with sugar content, but potatoes near the surface of the clamp, and especially at the ridge, were exceptional, in showing high or medium sprouting with high sugar content and low temperature.
Loss of dry matter during storage is attributable to respiration, and would therefore be expected to show a correlation with temperature. It is probable, also, that the sprouts have a higher respiration rate than the tuber tissue, so that the net loss of dry matter might be expected to increase with increase in the weight of sprouts. Barker (19366) has shown that the respiration rate of potatoes is closely
Table 5. Loss of water and dry matter from tubers, and recovery in sprouts, percentage of initial fresh weight
of tubers, during storage from 6 October 1943 to 5 July 1944; bag samples of Majestic potatoes, mean of three positions in each clamp
Loss from tubers Recovery in sprouts
Clamp JB (soil removed)
C (soil retained)
Water
9-2
Dry matter
3 1 3-2
Total 24-9
124
Water 6-4 4 1
Dry matter
10 0-8
Total 7-4 4-9
Water 15-4
6 1
Net loss Dry
matter Total 2-1 17-5 2-4 7-5
Table 6. Mean daily temperatures, ° C , of potatoes at different positions in clamps B and C, and
of the ambient air, for the period 10 April to 2 July 1944
Clamp B (soil removed) Clamp C (soil retained)
Maximum Minimum Mean Range
Air (in screen) 16-6
7-0 11-8 9-6
North side 13-7 9-5 H-6 4-2
Centre 11-8 10-6 11-2 1-2
South side 13-5 9-9 11-7 3-6
Mean 13-0 10-0 11-5
30
North
side 15-6 14-8 15-2 0-8
Centre 14-6 14-1 14-4 0-5
South side 16-6 15-4 160 1-2
Mean 156 14-8 152
0-8
that in the weight of water present in the sprouts, it follows that the removal of water from the tubers for incorporation in the sprout tissue was more important in determining the weight of water re-maining in the tubers, than the effect of sprouting in increasing the rate of transpiration.
The cause of the variation between and within clamps in the weight of sprouts produced is not known, but it is clear that temperature was not the only factor controlling sprouting. The weight of sprouts produced, percentage of initial tuber weight, was higher in clamp B than in clamp 0 (Table 4), but the mean temperature during the period of sprout production was more than 4° C. lower (Table 6). The mean temperature was lower at the centre of both clamps than at the sides, and though in B the weight of sprouts was also lower at the centre, in C it was higher. Similarly, comparison of Tables 3 and 4 shows that sprouting was not con-sistently related to sugar content. In contrast with
dependent on their sucrose content. The increased rate of loss of dry matter from both clamps, observed in the period from April onwards, was probably caused by rise of temperature and by sprouting, and not by change in sucrose content with age. Barker (1937) found that although the sucrose content of potatoes stored at constant temperatures between 7-5 and 15° C. began to increase rapidly after 5-7 months, the respiration rate showed only a slight rise, and when storage was prolonged for about a year, respiration rate began to decline although the sucrose content continued to increase.
The differences in net dry-matter loss within clamps, however, were not in accordance with the differences in either mean temperature or sprout weight. In both clamps the net dry-matter loss was greater at the centre than the sides, but the temperature was lower, and in clamp B the weight of sprouts was also smaller. Table 3 shows that during the period from April onwards when appreciable dry-matter loss occurred, sucrose content varied little between or within clamps. Evidently some other factor than temperature, sprouting or sucrose content was re-sponsible for the greater wastage of dry matter during storage at the centre of the clamp than at the sides.
Total nitrogen. Fig. 2 shows the weight of total
nitrogen present in tubers and sprouts, percentage of the initial weight in the tubers, at successive dates of observation, averaging the three positions in each clamp. Except for one point (clamp B, February) the total recovery of nitrogen, including that in the sprouts from April onwards, was consistently greater than 100%, and there is evidence of an increase between January and March. Table 4 shows that on the last sampling occasion in July the apparent gain of nitrogen was observed only in the samples at the sides of the clamp, but this difference was not consistent, and means for the three positions taken over all samplings showed a slightly higher recovery at the centre. It is clear from Fig. 2 that there was no net loss of nitrogen from the potatoes during storage, but it is difficult to believe that the apparent gain of 5 % or more was real. I t is just possible that there was some uptake of nitrogen from the soil adhering to the tubers, but the apparent gain seems far too large to be accounted for in this way, and a more probable explanation is that by chance, the nitrogen content of the tubers in the initial samples taken in October was below the mean value of the samples stored in the clamps.
From April onwards there was an increasing loss of nitrogen from the tubers by translocation to the developing sprouts, and in July the sprouts con-tained about 14 % of the initial nitrogen content of the tubers, though owing to the apparent net gain in nitrogen, the tubers had lost only 10 % (Table 4). Slightly less nitrogen passed into the sprouts in clamp B than in clamp C, although the dry weight of sprouts was greater, and this accounts for the lower nitrogen content percentage of dry matter of the sprouts in clamp B than in clamp C, shown in Table 3. Within each clamp, more nitrogen was present in the sprouts at the end of the storage period, and less remained in the tubers, in the positions which produced the greater weight of sprouts. The weight of nitrogen in the sprouts varied more widely with position than the weight of dry matter, and consequently there was an association between high sprout, weight and high nitrogen
per-centage of dry matter in the sprouts (cf. Tables 3 and 4). Thus, comparing clamps, increased sprout production was associated with relatively greater increase in the translocation of non-nitrogenous compounds than of nitrogen compounds, while com-paring positions within a clamp the reverse effect was found.
Sugars. The changes with time in the amounts of
sucrose and reducing sugars present in the tubers (Fig. 3) reflect the changes in sugar concentration
180 160 140 120 100 80
800 700 600 500 400 300 200 100 100 90 80
70 60
Clamp 8< Clamp Co—o
Starch
130
120
110
innI w /
• A
A
J'
6
\ .
Residual V dry matter
^ . ^^^^ O
V '
Jan.1 Feb. Mar. ' Apr. ' May 'June 'July Fig. 3. Changes with time in weights of sucrose, reducing
sugars, starch and residual dry matter, percentage of initial weight, in Majestic potato tubers; bag samples from clamps B and 0,1943-4; means of three positions in each clamp. The arrow marks the date when the soil casing was removed from clamp B.
tem-E. M. CROOK AND D. J . WATSON
453
perature rose, the amount of sucrose present rapidly decreased to values below the initial weight in April and May. The final rise, between May and July, has been attributed to an effect of age.
The initial reducing sugar content percentage of dry matter was very much below the values observed subsequently, and in consequence the weight of reducing sugars in the tubers throughout the period from January to July was four to eight times that initially present, Between January and May the weight of reducing sugars percentage of initial weight rose to a maximum and subsequently fell, but in clamp B the maximum was attained later than in clamp 0. The variation in amount of reducing sugars, like that in sucrose may have been partly the result of temperature change, but the evidence for this is not so clear as for sucrose, and the difference between the two clamps has not been adequately explained.
Starch and residual dry matter. The weight of starch
present in the tubers, percentage of its initial weight (Fig. 3), was almost identical in the two clamps throughout the whole storage period. No change in the weight of starch occurred between October and January, but in the following month there was a rapid decrease and by the end of February 20 % of the initial starch had disappeared. For the next 3 months the weight of starch present was nearly constant, but there was a further loss of 20% between the end of May and early July.
Fig. 3 also shows the changes with time in the weight of residual dry matter in the tubers, denned as total dry matter less sugars and starch, per-centage of its initial weight. The weight of residual dry matter present in January, like that of starch, was almost the same as the initial weight, but it increased rapidly during February and then more slowly to a maximum at the end of April. During May more than half the residual dry matter accumu-lated in the previous 3 months was lost, and it was this change which caused the increase in starch percentage of dry matter between the April and May samplings shown in Table 3 a, and not an increase in the absolute amount of starch. Between May and July the slow rise of residual dry matter was resumed. There was little difference between the two clamps until April, but subsequently the weight of residual dry matter percentage of initial weight was higher in clamp B than in clamp G.
Evidently, from January onwards, starch was con-verted into some component of residual dry matter not hydrolysable by |3 malt-amylase. It is surprising that this change did not begin until after 4 months' storage, and then proceeded so rapidly that 20 % of the starch of the tubers disappeared within a month. After February the change proceeded only very slowly, perhaps because of the fall in the temperature of the potatoes at the end of February and in early
March. Between the April and May samplings, in the early stages of sprout development, the accumula-tion of residual dry matter was interrupted. This might be taken as evidence that components of residual dry matter were translocated to the sprouts, but this is not an adequate explanation, for the loss of residual dry matter greatly exceeded the gain in dry matter by the sprouts, as the following figures show:
Change between April and May samplings, percentage of initial
dry matter of tubers Clamp B Clamp C Loss of residual dry matter of tubers 6-1 9-1 Gain in dry matter of sprouts 1-4 1-9 It is unlikely that residual dry matter provided the respiratory substrate in this period only and not at other times. The most probable explanation is that residual dry matter was reconverted to starch, but that the weight of starch did not increase because the gain from residual dry matter was offset by increased respiration loss. The apparent increase in total dry matter in March and April (Fig. 2) has been attributed to sampling errors, and if the estimated weights of starch and residual dry matter were corrected on this assumption they would indicate an increase in starch over the period April-May, and an earlier onset of the fall of residual dry matter. Between May and July, residual dry matter began to accumulate again at the expense of starch. The increase in starch percentage of dry matter during February and March 1943, shown in Table 1, suggests that in the 1942-3 experiment there was a similar change in the starch and residual dry-matter fractions during the early stages of sprouting. To summarize the time changes discussed in the previous sections and to show the relative magnitude of the changes in the different components of dry matter, the weights of each have been recalculated as percentage of initial dry weight of the tubers. It is sufficient for this purpose to consider only the means of both clamps and all positions in the clamp. These means are shown in Fig. 4. The weights of the components are plotted additively at each date of observation, so that their sum represents the total dry matter present in the clamp, percentage of initial dry matter. The weights of total nitrogen have been converted to 'crude protein' by multi-plying them by the conventional factor, 6-25. The ' protein' fraction in Fig. 4 is a rough estimate of the weight of nitrogenous compounds, but it must be remembered that, in fact, more than half of the total nitrogen was present in non-protein form (Table 1). The sum of 'protein' and residual dry matter in Fig. 4 corresponds to residual dry matter as denned in the earlier discussion.
454
there was an apparent gain, presumably due to sampling errors. The most important change during this part of the storage period was the rapid loss of starch by conversion into a component of residual dry matter. The increase in weight of sugars caused by low-temperature sweetening was presumably also at the expense of starch, but its effect on the weight of starch present was negligibly small compared with that of the other cause of loss.
After April the rate of loss of dry matter from the tubers was greatly increased. About a third of the loss was recovered in the sprouts, so that the net loss through respiration was twice as great as the loss
Reducing sugars
Sprouts
110
100
90
" I , BO
Lo
T3
1 60
•5 50 V
I 40
£ 30
20
10
Sucrose
Starch
Residual dry matter
:Protein-. Jan:Protein-.' Feb:Protein-. ' Mar:Protein-.1
Apr. ' May June'July Fig. 4. Changes with time in the weight of dry matter
present in Majestic potatoes, percentage of the initial weight in the tubers, in its partition between tubers and sprouts, and in the distribution of dry matter in the tubers between sucrose, reducing sugars, starch, 'protein' and residual dry matter; bag samples, 1943-4; means of both clamps and three positions in each clamp.
accounted for by the production of sprout tissue. It does not necessarily follow that sprouting was a minor cause of dry-matter loss from the tubers, for respiration of the sprouts as well as of the tubers contributed to the net loss, and if sprouting were inhibited, the respiration loss might be considerably reduced. As in the earlier phase of storage, changes in the starch and residual dry-matter fractions were predominant. During May there was a temporary reversal of the conversion of starch into a component of residual dry matter, but subsequently it was resumed. By comparison, the changes in the weights of sugar and 'protein' were very small. At the end of the storage period the nitrogen compounds trans-located to the sprouts amounted to about 1 % of the
initial dry matter of the tubers. As the weights of sugars and residual dry matter at the end of the storage period were both greater than the initial weights, the remainder of the loss of 16 % of initial dry matter from the tubers was entirely at the expense of starch.
Cooking tests. Tests of cooking quality were made
on all samples taken from the clamps in 1943-4, using half-tubers left after subsampling for dry matter determination and chemical analysis. 2 lb. of half-tubers were peeled, put into cold water, brought to the boil, and kept at boiling point for 35 min. The water was drained off and the cooked potatoes were allowed to dry on an asbestos mat over a low flame for 5 min. They were then scored for texture and colour, and after cooling, for blackening. For the texture score, each piece of potato was tested by pricking with a fork, and graded according to the scale: soapy 0, slightly soapy 1, mealy 3, broken down 2. The number of broken down pieces was determined by counting the number of pieces before boiling, and the number remaining whole after boiling. The total of points scored was divided by the number of pieces in the sample to give the average score, with a maximum of 3 if all were mealy. The results of the scoring for texture are shown in Table 7.
No steady change with time in texture after boiling was found in the period between January and April, but subsequently there was a rapid deterioration, and the July samples were very soapy. Evidently this deterioration was not closely related to sprouting, for though Arran Banner sprouted 2 months earlier than Majestic, the decline of texture began at about the same date in both varieties. Arran Banner had a slightly better texture than Majestic in the early part of the storage period. No difference between the two Majestic clamps was detectable, but the bulk samples were apparently inferior to the bag samples in the period from January to April. This difference, if real, implies that the sound tubers selected for the bag samples were of better cooking quality than the bulk of tubers in the clamps. There was an indication from the bag samples that tubers stored at the centre of the clamps were of poorer cooking quality than those near the sides.
The colour immediately after boiling deteriorated slightly with prolonged storage from February onwards. Until the May sampling, no consistent variation with time or difference between clamps in the intensity of blackening on cooking was observed, but the samples taken in July showed more intense blackening than any taken earlier.
Practical significance of the results. Apart from the