Abstract—Knitted fabrics are widely used by the underwear apparel industry due to their good elasticity. Modeling the mechanical behavior of knitted fabrics using Kelvin model is one of the discussed subjects in the textile industry. The purpose of this study is to investigate the accuracy of a nonlinear Kelvin model for determining the drying behavior of knitted fabrics. To fulfill this aim, genetic algorithm was used to optimize the model to achieve the lowest error between experimental and model results. The Kelvin model consists of a concentrated mass, a spring and a damper which are arranged in parallel. In the model a time-varying mass was considered due to the fabric drying process. Also, the behavior of the spring and damper were considered to be two-order nonlinear. Because of the nonlinear behavior of the spring and damper, the determination of the spring and damper coefficients by numerical methods was complicated. These coefficients were determined by minimizing the errors between the model and experimental results using the genetic algorithm. The results of the modeling of the knitted fabrics were compared to the experimental data for five samples with different course densities. The meaningful 4.5 percent difference between the purposed model and the experimental values proved that the presented system had acceptable results which could be used to investigate the length changes of knitted fabrics during drying processes. So, it was confirmed that the drying behavior of the knitted fabrics can be simulated by the nonlinear Kelvin model.
Keywords: drying behavior, genetic algorithm, model accuracy, non-linear Kelvin model, weft knitted fabric
I. INTRODUCTION
volutionary Strategies by Meta-heuristic methods play an increasing role in the optimization of functions of several variables in textile industry, especially in cases where a numerical or analytical solution is not easily obtainable. Genetic algorithm is a population-based evolutionary algorithm inspired by biological evolution.
Some researchers have applied genetic algorithm to solve and optimize problems in textile industry recently. For example, Chen et al. [1] used genetic algorithm for the mathematical formulation of knitted fabric spirality in both dry relaxed and wash-and-dry relaxed states of fabric. The proposed function were determined using the relationship
V. Mozafary and P. Payvandy are with the Department of Textile Engineering, Yazd University, Yazd, Iran. Correspondence should be addressed to P. Payvandy (e-mail: [email protected]).
between the fabric spirality and properties like yarn twist, tightness factor, dyeing method, number of feeders and gauge.
Blaga et al. [2] presented original software, Knitting Machine Simulator (KMS), developed to design and to optimize a knitting machine’s cam profiles. The program applied a genetic algorithm in a simulation knitting machine in order to test the generated cam profiles. The utilization of KMS software in knitting machine cam design ensured a reduction of about 25% in the time ofthe design process , which involved lower costs for this phase. Chen et al. [3] developed a scheduling system for elastic knitted fabric production using genetic algorithm. The system was designed to assist the production controller to schedule production rapidly on customer’s order. In this system, the input data were collected directly from the Enterprise Resource Planning system. The input data contained the basic information regarding the orders such as order number, order value and so on. The system was designed to be easy to use, flexible, automatic and adjustable. For this reason, the system was suitable for the production of elastic knitted fabrics. Line et al. [4] investigated the use of genetic algorithm for searching the weaving parameters for woven fabrics. A searching mechanism was developed to find the best combination of warp and weft counts and weaving densities for fabric manufacturing, considering costs. Jasper et al. [5] presented a method to design a wavelet-filter that minimizes entropy in the wavelet transform of the images of woven fabrics using genetic algorithm. The filters that minimized entropy in the images tended to filter out the fabric texture while highlighting the fabric defects.
One of the applications of genetic algorithm is to find the optimal solution for nonlinear complex modeling problems. Few researches have reported the modeling of the knitted fabric dimensional changes, maybe due to the complex mechanical behavior of knitted fabrics. Thus, complex optimized models of fabric behaviors based on genetic algorithm can be of interest.
Knitted fabrics are widely used by the apparel industry due to their good comfort, flexibility, elasticity, and formability properties. Nevertheless, their dimensions are not stable due to the shrinkage after various processes of washing.
The knitted fabric dimensional stability has been studied by some researchers. For instance, Higgins et al. [6] reported the effect of washing time, temperature setting, and moisture content on fabric shrinkage. Their study found that maximum drying occurred in the first cycle of drying shrinkage. They also showed that the temperature
Investigating Nonlinear Kelvin Model Accuracy
Optimized by Genetic Algorithm for Determining Drying
Behavior of Knitted Fabric
Vajihe Mozafary and Pedram Payvandy
does not have a significant effect on the amount of shrinkage. Onal et al. [7] investigated the influence of material type, the percentage of the mixed fiber, and the thickness on fabric shrinkage. They found that these properties have significant effects on the amount of shrinkage. Also, they showed that the thickness of fabric is directly proportional to the width shrinkage and inversely relates to the length shrinkage. Chen et al. [8] studied the effects of loop length, yarn linear density, cover factor, yarn twist and fiber diameter on the shrinkage of plain knit woolen fabric using regression analysis. The result of the multiple regression analysis indicated that the major factors affecting felting properties are cover factor and loop length. Furthermore, fiber diameter and yarn twist have a significant effect on the amount of shrinkage as well. Lo et al. [9] studied the effect of resin finish on dimensional changes of knitted fabric. Furthermore, they analyzed the relationship between the degree of set and dimensional stability and showed that the degree of set increases with increase in resin level.
After production, knitted fabrics encounter dimensional loss (shrinkage). In fact they tend to achieve stable and sustainable conditions. These changes lead to a jamming structure. A large number of factors are responsible for causing these changes in knitted structures; these are all associated with the yarn, knitting, finishing and making-up of the fabrics. The major reason of shrinkage is the yarn tension during feeding and picking up. Another problem that manufacturers have to contend with is the factors affecting the variability in customer washing processes. Fibers will swell due to moisture absorption and so their diameter increase. Therefore, the fabric yarns become close to each other and the fabric dimensions are reduced [10].
In our previous research, a model was presented to predict the plain knitted fabric length changes during the drying process. The results showed, there was a better consistency between experimental and theoretical results in higher stich densities. However, by decreasing stich density errors increased. Therefore, it could be said that the proposed model was appropriate for high stich density knitted fabrics which are more used in clothes [11].
The dimensional stability of fabrics is important to both manufacturers and consumers. Dimensional changes in knitted fabrics can cause problems in wearing. Considering that transverse changes compared to longitudinal changes are very small and can be neglected, this study only has focused on the longitudinal changes.The objective of this paper is to investigate the ability of the nonlinear Kelvin model to predict changes in knitted fabrics during the drying process. In this context, a nonlinear kelvin model optimized by genetic algorithm is used to model the behavior of knitted fabric drying. The fabric is modeled as a concentrated mass, a nonlinear spring and a damper. The derived equations of the model are solved numerically by implicit Euler method. The errors between the theory and experimental data have been minimized by using genetic algorithm to achieve the best values of the spring and damper coefficients.
II. MODELING
The models developed to describe a viscoelastic material are combinations of springs and dampers. The spring represents the elastic portion of the material, whereas the dashpot represents the viscous portion. Combinations of spring and dashpot can be used to represent different linear viscoelastic materials [12].
The springs follow Hooke’s law as (1):
'
F KX (1)
where K is the spring coefficient, F'is the force and X is the extension.
The dashpots follow Newton’s law as (2):
.
F C X (2)
where C is the dashpot coefficient, F is the force and
X is the rate of extension (
. dx
X dt
).
The three most popular models of viscoelasticity are the Maxwell model, the Voigt model and the Kelvin model. If a spring and a damper are arranged in parallel, the composed element is called a kelvin model. The Kelvin model is a common tool for modeling in textile industry [13-16].
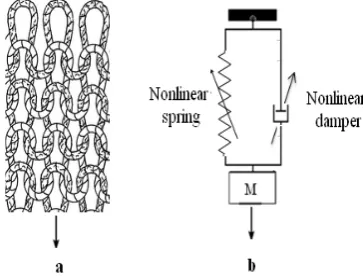
In this study, a nonlinear Kelvin model is used to investigate the drying behavior and length changes of knitted fabrics. In the Kelvin model, the spring and the damper are linear. But in this paper the spring and damper behavior are considered to be nonlinear because the fabric behavior is not linear in reality. The model is illustrated in Fig. 1.
Fig. 1. a) Structure of weft knitted fabric. b) Nonlinear Kelvin model for determining the drying behavior and length changes of fabric.
According to Fig. 1, the equation of motion of a plain knitted fabric can be presented as:
'
( ) ( )
where M is the mass of the fabric and F X( ) ,F X'( )are
damping and spring forces, respectively. Every nonlinear equation can be regarded as a polynomial according to the Taylor series. So in this study, spring and damper behavior are considered as polynomials to cover the general state of nonlinear equations. Nonlinear damping and spring forces are considered polynomials as (4) and (5), respectively:
' 1
1 2
( ) n n ...
F X K X K X (4)
.
1
1 2
( ) n n ...
F X C X C X (5)
where n is the polynomial degree.
In this study, to describe the nonlinear behavior of damper and spring, a polynomial of degree two is used. Equations (6) and (7) can be obtained by substituting n=2 into (4) and (5):
' 2
1 2
( )
F X K X K X (6)
.
2
1 2
( )
F X C X C X (7)
Equation (8) can be obtained by substituting (6) and (7) into (3):
2 2
1 2 1 2
M X K X K X C X C X M g (8)
Initially the fabric is wet. Over time it loses moisture, therefore the mass varies with time. The total fabric mass can be presented as follows:
M m m t (9)
where m is the wet fabric mass andm t
is the mass ofoutlet water over time.
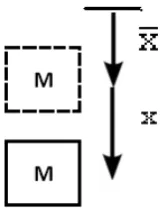
Fig. 2. Mass center position
.
By introducing two new variables, the position of the fabric initial static equilibrium and the position of the fabric center of mass, shown in Fig. 2, we have:
x x X (10)
where x is the position of the fabric initial static equilibrium and x is the position of the fabric center of
mass. So, (11) can be written as follows:
2 2
1 2 1 2
K x K x C x C x mg (11)
where:
0
x (12)
so:
2
1 2
K x K x mg (13)
Equation (14) can be obtained by substituting (10) and (9) into (8):
21 2
2
1 2
( ) (x ) (x )
( )
m m t x K x K x
C x C x m m t g
(14)
Considering that xx is small, it can be ignored in computation. Thus, (15) can be obtained by substituting (13) into (11):
21 2
2
1 2
( )
m m t x K x K x
C x C x m t g
(15)
Equation (15) shows the length changes of knitted fabrics during the drying process. Determining the spring and damper coefficients (K1, K2, C1, C2) experimentally is complicated. Thus using the genetic algorithm, the best values for the spring and damper coefficients were obtained by minimization of the errors between theory and experimental results.
III. GENETIC ALGORITHM
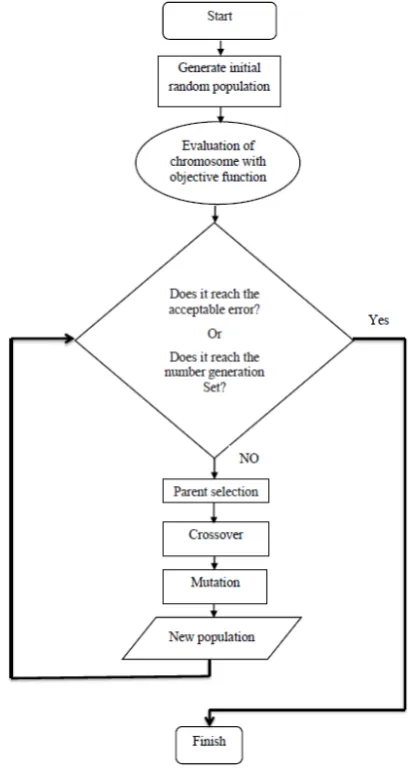
The genetic algorithm is a computational model inspired by biological evolution that can be used for optimization. This algorithm acts based on the genetic processes of biological organisms. Population grows up based on the principles of selection and survival of best that was reported by Charles Darwin. Following this process, the genetic algorithm can find a good solution to nonlinear problems by simultaneously exploring multiple regions of the solution space and exponentially exploiting promising areas through mutation, crossover and selection operation. The basic principle of genetic algorithm was first introduced by John Holland in the 1960s [17]. Fig. 3 shows the flowchart of a typical genetic algorithm.
A. Encoding
string of fixed length. Each chromosome shows a solution for problem. In this study, a chromosome has four genes. The first and second genes are related to the nonlinear spring coefficients and the other genes are related to the nonlinear damper coefficients. Genes and chromosome are shown in Fig. 4.
Fig. 3. Flow-chart of a Genetic algorithm.
Fig. 4. Genes and chromosome.
B. Initial Population
The generation of an initial population is the first step. Each solution is represented by a chromosome that is converted to a code by considering the type of problem.
Then evaluates these structures and allocates reproductive opportunities in such a way that those chromosomes which represent a better solution to the target problem are given more chances to reproduce than those chromosomes which represent poorer solutions. The
goodness of a solution is typically defined with respect to the current population.
Population sizing has been one of the important topics to consider in evolutionary computation. The initial population should be enough to allow the displacement operations by genetic algorithms in general search spaces. A large population size could make the algorithm expend more computation time in finding a solution [17].
C. Parent Selection
In the selection phase, a pair of chromosomes is chosen to be combined; the selection operator is the Interface between the two generations and transfers some members of the current generation to the next generation. After selection, genetic operators are applied on the selected members. Values conformity is the criteria for the selection of members. In the selection process the selection chance of each chromosome is proportional to its fitness.In this study, the Roulette Wheel selection method is used [18].
D. Crossover
The crossover is a method for sharing information between chromosomes; it combines the features of two parent chromosomes to form two offspring, with the possibility that good chromosomes may generate better ones. Crossover types are: single-point crossover, two-point crossover and uniform crossover. The uniform crossover is used in this study [18].
E. Mutation
The mutation operator arbitrarily alters one or more components, genes, of a selected chromosome so prevent falling into local optimization, although variability of the population is remained. Mutation types are: swap mutation, reversion mutation and insertion mutation [18].
F. Objective Function
Objective function determines the selection chance and existence of a solution proportional to its fitness value. Objective function is both ascending and descending. According to the type of problem, fitness is more when the value of function is more provided that the aim is to maximize a function. If the aim is to minimize a function, cost is more when the value of function is more.
To solve (15) (Equation of knitted fabric length changes during the drying process), spring and damper coefficients should be determined. In this paper, the errors between the equation of knitted fabric length changes and the experimental data was minimized by using the genetic algorithm to achieve the best values for spring and damper coefficients. On the other hand, it is desirable to minimize the error between the theory and experimental results.
Here, the objective function is defined as follows:
mod 1
n el real
i i
R
X X (14)where n is the number of tests, real i
X is the experimental
data of fabric length changes during drying process, and
model i
X is the model dynamic response of fabric length
IV. EXPERIMENTAL
The purpose of this article is to investigate the effect of structure parameters on longitudinal changes of knitted fabrics. It is known that the knitted fabric structure is made from loops and the loop dimensions in fabric determine the viscoelastic behavior of the knitted fabric. By changing the loop dimensions (course and wale density), the fabric behavior is changed. So in this study, the yarn count, the wale density and the yarn material were kept constant. Fabric specimens (100% acrylic (8/2 Ne). 60×60 cm2)
were produced with a circular knitting machine (gauge no. 6). The specifications of the 5 samples are listed in Table I. Before taking any measurement, all fabrics were placed on a flat surface for 24 hours in standard atmospheric conditions of 20 ± 2°C and 65 ± 2% RH (dry relaxed fabrics).
TABLE I SPECIFICATIONS OF SAMPLES
Course density (cm-1)
Wale density
(cm-1)
Yarn count (Ne) Weave Weight (g) Material Sample. No 14.8 6.7 8/2 Plain 145 Acrylic 1 14.3 6.7 8/2 Plain 137 Acrylic 2 13.9 6.7 8/2 Plain 132 Acrylic 3 13.5 6.7 8/2 Plain 126 Acrylic 4 13.1 6.7 8/2 Plain 113 Acrylic 5
After relaxation, the wale and course density of the samples were determined based on the Standard BS5441:1988 [19]. All specimens were then subjected to the wash relaxation treatment in a standard washing at water 60°C for 20 minutes (according to AATCC Test Method 150) [20]. After the washing and dry relaxation treatment, the length changes of the samples with time were recorded.
The wet samples were weighed and hung under their weight in standard atmospheric conditions. The samples length decreased as fabrics were drying until the percentage of moisture became zero. Longitudinal and transverse changes were recorded every 30 minutes. Three measurements were taken on each sample and their averages were recorded. The results are given in Table II.
It is observed from Table II that there is a significant initial change in the length and weight of the samples, which decrease with the reduction of moisture.
V. OPTIMIZATION BY USING GENETIC ALGORITHM
In this part, the best value for nonlinear spring and damper coefficients were selected using genetic algorithm to minimize the objective function, (14).
Matlab.R2012 software was employed to write the program and for its final execution. Table III shows the optimization variable limits and changes accuracy. The genetic algorithm parameters are shown in Table IV.
After 50 runs of genetic algorithm, the best of the achieved value of parameters (K1,K2,C C1, 2) for 5 samples were determined, which are shown in Table V.
TABLE II
THE AVERAGE OF CHANGES IN THE LENGTH AND WEIGHT Length change (the difference between wet and
dry samples) (mm) Mass change (the
difference between wet and dry samples) (g) Time (min) Sample(No) 10 8 6 4 3 1 1 502 403 328 246 174 98 21 0 30 60 90 120 150 180 1 13 10 7 4 3 2 1 15 11 7 5 4 3 1 18 13 9 7 6 3 2 20 14 10 7 6 4 2 533 423 341 267 186 118 30 0 30 60 90 120 150 180 2 577 454 361 282 196 101 33 0 30 60 90 120 150 180 3 584 463 352 246 178 109 36 0 30 60 90 120 150 180 4 603 484 391 286 212 123 41 0 30 60 90 120 150 180 5 TABLE III
OPTIMIZATION VARIABLE LIMITS AND CHANGES ACCURACY C2 C1 K2 K1 Parameter -100 -100 -100 -100 Lower limit +100 +100 +100 +100 Upper limit 0.01 0.01 0.01 0.01 Changes accuracy TABLE IV
GENETIC ALGORITHM PARAMETERS Value/Property Parameter
1000 Population size
50 Number of generations
0.8 Crossover percent
0.3 Mutation percent
Roulette Wheel Selection Selection of parents
Uniform Selection of crossover
Fig. 5. Variation of the best and mean values of the objective function (Sample1).
Fig. 5 shows the average of the minimum value of the objective function and the objective function for different number of generations during optimization for the best result after 50 runs of the genetic algorithm (sample 1). This figure clearly shows the convergence of the optimization process by using the genetic algorithm. By increasing the number of generations, the mean value of the objective function decreases and approaches gradually to the best value.
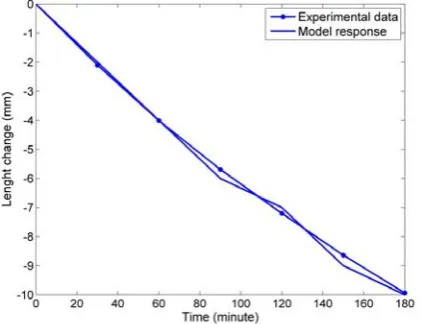
Fig. 6. Comparison between presented model result and experimental data of length changes for sample 1.
VI. RESULTS AND DISCUSSION
After determining the spring and damper coefficients, (15) was solved numerically by implicit Euler method. The results of the model are compared with the experimental data at seven times (0, 30, 60, 90, 120, 150 and 180 min). Fig. 6 compares the model result with the experimental data of length changes for sample 1. It is observed that the model is able to determine the length changes of the wet fabric sample over time.
The experimental data of the length changes of wet fabric samples over time and the result of the model and the error rate between the experimental and theoretical data for five samples are shown in Table VI.
It is observed from Table VI that the nonlinear Kelvin model is able to determine the length changes of a plain knitted fabric during the drying process. The error mean for 5 samples in all time steps is 4.5 percent. Therefore it can be concluded that nonlinear Kelvin model is suitable for simulating the behavior of knitted clothes.
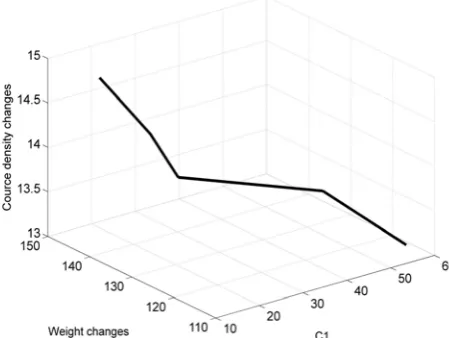
By using the data in Table I and V, the diagram of the changes in the model coefficients versus the weight and course density were obtained, which are shown in Figs. 7 to 10.
It is observed from Figs. 7 to 10 that by increasing the fabric weight and course density, the spring and damper coefficients of the model decrease. These Figures just show a procedure of model coefficient changes with the weight and course density changes. In order to determine the precise relationship between the model parameters and the structure parameters of knitted fabrics, more experiments are needed. This is one of the conditions necessary for further evaluation of the potential applications of nonlinear Kelvin models to knitted fabrics.
TABLE VI
RESULTS OF THE PREDICTING MODEL AND EXPERIMENTAL DATA Error percent (between experimental and model) Experimental results (mm) Results of model (mm) Time (min) Sample. No 5% -2 -2.1 30 1 0.25% -4 -4.01 60 5.1% -6 -5.69 90 2.8% -7 -7.2 120 4% -9 -8.64 150 0.6% -10 -9.94 180
Error average 2.95%
6.6% -3.2 -3 30 2 1.5% -5.9 -6 60 10.1% -8.09 -9 90 0.5% -9.05 -10 120 4.5% -11.5 -11 150 0.1% -13.02 -13 180
Error average 3.8%
3.7% -3.85 -4 30 3 11.2% -7.1 -8 60 4.5% -9.55 -10 90 6% -11.67 -11 120 3% -13.4 -13 150 0.2% -15.04 -15 180
Error average 4.76%
17% -4.15 -5 30 4 8.7% -8.21 -9 60 3.6% -11.4 -11 90 18.3% -14.2 -12 120 1.8% -16.3 -16 150 1.1% -17.8 -18 180
Error average 8.4%
1.66% -5.9 -6 30 5 2.4% -9.76 -10 60 0.2% -12.97 -13 90 11.4% -15.6 -14 120 0.3% -17.94 -18 150 0.4% -19.91 -20 180
Fig. 7. Diagram of model coefficient changes (K1) versus weight and course density changes.
Fig. 8. Diagram of model coefficient changes (K2) versus weight and course density changes.
Fig. 9. Diagram of model coefficient changes (C1) versus weight and course density changes.
Fig. 10. Diagram of model coefficient changes (C2) versus weight and course density changes.
VII. CONCLUSION
In this study, the drying behavior of plain knitted fabrics was investigated. A nonlinear Kelvin model was used to study the length changes of knitted fabrics during the drying process. The nonlinear Kelvin model consisted of a concentrated mass and a nonlinear damper and spring which were arranged in parallel. The mass was time dependent because the fabric was wet at first and dried over time. Also, the behavior of spring and damper was considered to be two-order nonlinear. Because of the nonlinearity of the spring and damper behavior, the determination of spring and damper coefficients by numerical methods was complicated. Thus the genetic algorithm was used to find the best values for these coefficients through minimization the error between the model and experimental data.The results of this paper showed that drying behavior of knitted fabrics could be simulated by using the nonlinear Kelvin model with a 4.5 percent error mean. There was a relationship between the model parameters and fabric structure parameters. In order to predict the precise relationship, more experiments are needed which can be done in future research.
REFERENCES
[1] Z. Chen, B. Xu, Z. Chi, and D. Feng, “Mathematical formulation of knitted fabric spirality using genetic programming”, Text. R. J., vol. 82, no. 7, pp. 667-676, 2012.
[2] M. Blaga, and M. Draghici,“Application of genetic algorithms in knitting technology”, J. Text. Inst., vol. 96, no. 3, pp. 175-178, 2004. [3] R. C. Chen, T. S. Chen, and C. C, Feng, “Application of genetic algorithm on production scheduling of elastic knitted fabric”, J. Eng. Applied. Sci., vol. 1, no. 2, pp. 149-153, 2006.
[4] J. J. Lin,“A Genetic Algorithm for Searching Weaving parameters for woven fabrics”, Text. Res. J., vol. 73, no. 2, pp. 105-112, 2003. [5] W. Jasper, J. Joines, J. Brenzovich,“Fabric defect detection using a
genetic algorithm tuned wavelet filter”, J. Text. Inst., vol. 96, no. 1, pp. 43-54, 2005.
[7] L. Onal, and C. Candan, “Contribution of fabric characteristics and laundering to shrinkage of weft knitted fabrics”, Text. Res. J., vol. 73, no. 3, pp. 187-191, 2003.
[8] Q. H. Chen, K. F. Au, C. W. M, Yuen, and K. W. Yeung, “An analysis of the felting shrinkage of plain knitted Wool fabrics”, Text. Res. J.,vol. 74, no. 5, pp. 399-404, 2004.
[9] W. S. Lo, T. Y. Lo, and K. F. Cho, “The effect of resin finish on the dimensional stability of cotton knitted fabric”, J. Text. Inst., vol. 100, no. 6, pp. 530-538, 2009.
[10] R. Postle, and D. L. Munden,“Analysis of the dry-relaxed knitted-loop configuration: part I: two-dimensional analysis”, J. Text. Inst., vol. 58, no. 8, pp. 329-351, 1967.
[11] Mozafary, P. Payvandyand M. M Jalili,“Non-linear behavior simulation of the drying of weft knitted fabric by using mass- spring-damper model and straight forward expansion”, Modares. Mech. Eng., vol. 14, no. 1, pp. 1-8, 2014 (in Persian).
[12] Y. Li, and X. Q, Dai, Biomechanical engineering of textiles and clothing, North America: CRC Press LLC. Woodhead Publishing Limited, pp. 115-120, 2006.
[13]S. Kumar and V. B. Gupta, “Nonlinear viscoelastic model for textile fibers”, Text. Res. J., vol. 48, no. 7, pp. 429-431, 1978.
[14]J. Zhang, L. General, and P. Beijing, “The model of viscoplastoelastic behavior of tencel fiber”, J. Northwest. Inst. Text. Sci., vol. 13, no. 4, pp. 399–402, 1999.
[15]Z. Cai, “A Nonlinear Viscoelastic model for describing the deformation behavior of braided fiber seals”, Text. Res. J, vol. 65, no. 8, pp. 461–470, 1995.
[16]J. J. M.Baltussen, and M. G. Northolt, “The Eyring reduced time model for viscoelastic and yield deformation of polymer fibers”, Polymer, vol. 45, no. 5, pp. 1717-1728, 2004.
[17]F. G. Lobo and D. E. Goldberg, “The parameter less genetic algorithm in practice”, Inform. Comput. Sci., vol. 167, no. 1, pp. 217-232, 2004.
[18]L. Scrucca, “GA: A Package for genetic algorithms in R. J”, Statistical Software, vol. 53, no. 4,pp. 1-37, 2013.
[19]BS 5441, Methods of test for knitted fabrics, (1988).