Patron: Her Majesty The Queen Rothamsted Research Harpenden, Herts, AL5 2JQ Telephone: +44 (0)1582 763133 Web: http://www.rothamsted.ac.uk/
Rothamsted Research is a Company Limited by Guarantee Registered Office: as above. Registered in England No. 2393175.
Rothamsted Repository Download
A - Papers appearing in refereed journals
Weir, A. H., Bragg, P. L., Porter, J. R. and Rayner, J. H. 1984. A
winter-wheat crop simulation-model without water or nutrient limitations. The
Journal of Agricultural Science. 102 (2), pp. 371-382.
The publisher's version can be accessed at:
•
https://dx.doi.org/10.1017/s0021859600042702
The output can be accessed at:
https://repository.rothamsted.ac.uk/item/8v5q3
.
© Cambridge University Press (CUP) Cambridge.
With 7 text-figures Printed in Great Britain
A winter wheat crop simulation model without water
or nutrient limitations
BY A. H. WEIR*, P. L. BRAGGf§, J. R. PORTER* AND J. H. RAYNER* * Bothamsted Experimental Station, Harpenden, Herts., AL5 2JQ
t Agricultural Research Council Letcombe Laboratory, Wantage, Oxfordshire, 0X12 9JT
t Long Ashton Research Station, University of Bristol, Long Ashton, Bristol, BS18 9AF
(Revised MS. received 18 August 1983)
SUMMARY
A whole crop computer simulation model of winter wheat has been written in FORTRAN
and used to simulate the growth of September- and October-sown crops of Hustler wheat at Rothamsted for the years 1978-9, 1979-80 and 1980-1. Results of the simula-tions, which are for crops with adequate water and nutrients, are compared with observations from experiments at Rothamsted. The model uses daily maximum and minimum temperatures and daylength to calculate the dates of emergence, double ridge, anthesis and maturity of the crops and the growth and senescence of tillers and leaves. In the simulations, the canopy intercepts daily radiation and produces dry matter that is partitioned between roots, shoots, leaves, ears and grain. Partial simulations, using observed LAI values, produced dry matter in close agreement with observations of late-sown crops, but consistently overestimated the total dry-matter production of the early-sown crops. Full simulation described satisfactorily the average difference in dry-matter production to be expected with changes in time of sowing, but did not give as close correspondence for individual crops. A grain growth submodel, that linked maximum grain weight to average temperatures during the grain growth period, cor-rectly simulated the observed growth of individual grains in the 1981 crop. The benefits to be obtained by combining whole crop modelling with detailed crop observations are discussed.
Moorby (1979), and Penning de Vries & Van Laar (1982). Wheat models have been produced by The construction of this model, which we call Morgan (1976) and Hochman (1979), by the
ARCWHEAT 1, is a collaborative project between Wageningen school and by Ritchie and co-workers four Institutes supported by the Agricultural Re- at Temple, Texas. The principles of the ARC model search Council: Letcombe Laboratory, Long Ash- were described by Landsberg & Porter (1982) and ton Research Station, Plant Breeding Institute, Porter et al. (1983). This model has now been de-Cambridge, and Rothamsted Experimental Station, veloped to the point at which it can simulate the The long-term aim is to develop a mechanistic growth of healthy crops with adequate nutrients simulation model of the growth of winter wheat for different sowing dates and seasons. In this form that can be used to emphasize areas where research the only driving variables are radiation and temper-into growth processes is needed, to explain differ- ature. This paper describes the model and compares ences in yields from field experiments in terms of the results of simulations with observations of the sites and seasons, and to estimate yield differences growth of six experimental crops,
attributed to the effects of soil and weather through -out the United Kingdom.
Whole-crop modelling has increased greatly in
the past few years with notable contributions by THE MODEL
Thornley (1976), De Wit et al. (1978), Milthorpe & A R C W H E A T i, s h o w n diagrammatically in Fig. 1,
372
A. H. WEIR AND OTHERSI Daily maximum | and minimum
temperature
Day length
Julian time
Simulate phenological development
Simulate shoot population
Simulate leaf area develop-ment
Simulate i Simulate dry light interception imatter partitioning and photosynthesis I and grain growth
Sowing — — — —>•'— — — — — — — — — — — — — _ _ _ — — — — —
Accumulate Tt
Seedling emergence
Accumulate PVTt
Double ridges on main >< shoot apices
-Accumulate PTt
Anthesis — — — - * ' — — — —
Accumulate Tt
Maturity — — — — — — —
No. of shoots Leaf area Weights of roots, stems, leaves, ears + grain Fig. 1. Diagrammatic representation of the wheat computer model showing the interaction between the submodels: phenological development, tiller and leaf growth, root growth, light interception and photo-synthesis, dry-matter partitioning and grain growth. The arrowed boxes show the driving variables. Tt, thermal time; PTt, thermal time modified by photoperiod; PVTt, thermal time modified by photo-period and vernalization. For details, see the text.
light interception and photosynthesis, dry-matter partitioning and grain growth.
Phenological development submodel
The submodel is given sowing date, site latitude and daily maximum and minimum temperatures, and calculates the dates of occurrence of the de-velopment stages: seedling emergence, appearance of double ridges on the main shoot apex, anthesis and maturity. Maturity is chosen to represent the state of experimental crops at hand-harvest date.
Four types of thermal time (°C days for a function of maximum and minimum temperature) are used. For the phase from sowing to emergence thermal time is calculated using a base temperature of 1 °C. From emergence to double ridges this thermal time is modified by vernalization and photoperiod factors and for the phase from double ridges to anthesis by photoperiod only. From anthesis to maturity, thermal time is calculated assuming a base temperature of 9 °C. Calculation of thermal time of the first three phases uses the method of Gallagherand Lumsden (Lumsden, 1980; Gallagher, Thome & Taylor, 1981). Lumsden (1980) chose the base temperature of 1 °C and other parameters used in the photoperiodic and vernalization responses of the crop from consideration of the development of wheat crops grown at Rothamsted and Sutton Bonington in the period 1974-8. The base temperature of the
last phase is based on the analyses shown in Fig. 2 using unpublished data of G. N. Thorne and P. J. Welbank.
Thermal time. This is obtained as the sum of
eight contributions each day of a cosinusoidal
varia-0°C
500
Thermal time (°C days)
1000
373
tion between the observed maximum and minimum temperatures:
°Cdays (1)
where TH = TmiB + / , (Tmal - TmlB) °C (2)
BXld
/r = Jt1 + c°9 ¥ (2r~ 1)J (3) TH, T^,t, Tm>1 and Tm|n are in °C; negative con-tributions are treated as zero.
There are reduced contributions for 1/8-day temperatures above 26 °C (Topt) falling to zero at 37 °C (Ti>mM) (Arndt, 1945). At Topt the contribu-tion TH-T^ is T^-T^ °C. Between Topt and SP-D^j the contribution becomes (Tofl — 2^,
Photoperiod effects. The number of
photoperiod-effective hours (PH) (after Francis, 1970) is calcu-lated for each day. If a day has 20 or more photo-period-effective hours, thermal time is not reduced, but if it has fewer, thermal time is proportionally reduced by multiplication by a photoperiod factor (FP).
PH is calculated from site latitude (Lat) and Julian day number (Jday) using formulae des-cribing the relative movement of the earth and sun. The angle of the sun above the equator (Dec) is given by
Dec = sin-1 (0-3978 sin 6) rad, (4)
where 0 = <?I + 58rad (5)
and 0, = 2TT (Jday-80)/365 rad (6)
and d2 = 0-0335 (sin In J d a y - s i n 2TT80)/ 365 rad. (7)
Photoperiod-effective radiation for each day gins and ends when the sun is 6° (0-10453 rad) be-low the horizon.
Then if D = -0-10453/cos Lat.cos Dec (8)
and PR = cos"1 (D —tan Lat.tan Dec) rad, (9)
PH = 24PR/n hours, (10)
FP = (PH-PbM.)/(Popt-PbM.). (11)
Gallagher and Lumsden set Popt at 20 h and limited FP to vary between 0 and 1. Thus FP can reduce, but not increase, the accumulation of thermal time. They also set PbM, to 0 h for the phase from emergence to double ridge, but to 7 h from double ridge to anthesis. These settings have been re-tained.
Vernalization. The vernalization factor used to
modify thermal time in the growth phase between emergence and double ridges depends on the temperature history of the plant summarized as
cumulative vernalized day degrees (VDD). VDD accumulates from time of germination, although the factor (FV) derived from it modifies thermal time only after emergence. If TmaI exceeds 30 °C for any day, half the VDD accumulated up to that time is lost.
To calculate VDD and FV, temperatures are obtained from equations (2) and (3) by putting
r = 1...8 and are used to derive vernalization
effectiveness factors (Vtlt)
for TH values of 3-10 °C VM = 1, (12)
for TH values of - 4-3 °C Vtit = (TH + 4)/7, (13)
for TH values of 10-17 °C Fel, = (17 - TH)/T. (14)
Thus full vernalization is obtained between 3 and 10 CC and reduced amounts between —4 and 3 °C and 10 and 17 °C. Cumulative vernalization is given by summing all the 1/8 day contributions
i=nir=8
VDD = 2 - 2 VM vernal days, (15)
i=i8r = 1
where i is the day number and n the number of days from germination. The vernalization factor (FV) is given by
FV = (VDD-Ft o)/(FM t-Fb M e). (16)
Gallagher and Lumsden (Lumsden, 1980) set V^t at 33 and T^M at 8 vernal days and normalized FV between 0 and 1. As with FP their values have been retained unchanged. In the calculation of photovernalized thermal time, PVTt, the daily thermal time contri-bution is multiplied by both FP and FV.
Appendix Table 1 shows the base temperatures and thermal time totals used for Hustler wheat.
Tiller and leaf growth submodel
Details of the simulation of tiller and leaf growth are given in an accompanying paper (Porter, 1984). In this submodel a given population of main stems grows tillers on a weekly basis using a tiller pro-duction rate and the accumulated thermal time of the previous week. Tiller production ceases at the double ridge stage and is succeeded by tiller death in which the latest formed tillers have the greatest probability of dying. Tillers surviving at anthesis are considered to develop ears.
374
A. H. WEIB AND OTHERSRoot growth submodel
In this submodel each plant grows five seminal roots at a linear rate that is modified by the daily mean air temperature and availability of assimilate (Porter et al. 1983). The specific weight of seminal roots is set to 1-5 x 10"4 g/cm, and the temp erature-related growth rate factor, TR, is given by
TR = 0-2 + 0-12 T, (17)
where T °C is the daily mean temperature. A sur-plus of assimilate over that required for seminals is used to grow lateral roots, which have a specific weight of 4 x 10"6 g/cm. Thirty per cent of the assimilate available is retained in each layer and the remainder passed to the layer below. Thus the amount of lateral root per layer decreases ex-ponentially with depth down to the limit of penetration of the seminal roots.
Light interception and photosynthesis submodel
The amount of photosynthetically active radia-tion (PAR) falling on each square metre of crop is calculated from daily values of net short-wave energy incident at crop height. These are combined with values of green leaf area index (LAI) obtained from the tiller and leaf growth submodel to obtain incident PAR each hour at the mid-points of each leaf area layer, using a radiation interception model similar to that of Charles-Edwards (1978). The amounts of CO2 fixed per layer/hour as
synthate are then calculated using the photo-synthesis equations of Marshall & Biscoe (1980 a, b). A modification, after Tenhunen, Yocum & Gates (1976), varies the rate of photosynthesis with temperature. The total photosynthate produced during the hours of daylight is reduced by amounts lost to growth respiration and maintenance respira-tion, calculated according to McCree (1974), to give the assimilate produced each day.
Radiation interception. If Qp is the PAR at the top of the canopy, then the intensity of PAR at level z (Qv(z)) in the canopy is given by
Q,.k
(l-m) exp [ - k. LAI (z)] W/m
a
, (18)
where LAI(z) is the green leaf area index at level z with z = 0 at the top of the canopy, k is an extinc-tion coefficient and m a leaf transmission coefficient for PAR.
Photosynthesis. The rate of photosynthesis, net of
photorespiration, Pg (mg CO2/m2 per sec), is
ob-tained from the quadratic equation fitted to the photosynthesis-light response curve of Marshall &
Biscoe (1980 a). It is the same as equation (5) of Thornley (1976, p. 94) with 6 = 0-995
0-9$5P2a-PJPDM + aQJz)) + a.QJz)Pnai = 0, (19)
a (mg/J) is the photosynthetic efficiency. The maxi-mum photosynthesis rate, PmM[, is given by
PmM = 0-995 Ca/rp mg/m 8
per sec, (20)
where Ca (mg/ms) is the ambient CO2 concentration
and rv is the total physical resistance to CO2
diffusion.
rv = ra + r, + rm sec/m, (21)
where the crop boundary layer resistance, r0, and
the mesophyll resistance, rm, have fixed values and
the stomatal resistance, r,, has the form
r, = 1-56 x 75 (1 + 1QO/Qv(z)) (1 - 0-3Z>) sec/m, (22)
where D (kPa) is the vapour pressure deficit. In this model the crop is considered to be free from water stress and thus r, is not affected by leaf water status.
Values of Pa, obtained by solving equation (18)
for each unit leaf area layer and part layer for each daylight hour, are summed to give the gross amount of CO2 transformed to carbohydrate each day.
Temperature correction of maximum photosyn-thetic rate. Low temperatures limit the maximum
photosynthetic rate at saturating light and COa
concentrations (Tenhunen, Weber, Yocum & Gates, 1976). The temperature-dependent maximum photo-synthetic rate (Pm) is given by
_ 0044 x 6 x 10»T(k) exp ( - &HJRT{k)) m =
1 + exp (-&HJRT(k)) exp (AS/i?) mg/m2 per sec, (23)
where T{k) is leaf temperature in degrees Kelvin, Ai/X and Aflr2 (cal/mol) are the activation and
denaturation energies for the electron transport system, R (cal/K per mol) is the gas constant, and AS (cal/K per mol) is the entropy change on de-naturation of the electron transport system. This modifies the photosynthesis equation, as follows:
pa 0-995-2- 1
F
+p
Ll
+ 1 = 0-
(24)p rj
Respiration. Total respiration, R, is calculated
daily as the sum of growth and maintenance respira-tion. Growth respiration is a fixed fraction of the hourly values of photosynthate production, Ps,
375
CHaO equivalent (P,(CH2O) = 0-65P0(CO2)).Main-tenance respiration is temperature sensitive (McCree, 1974) and is a fraction, changed after anthesis, of the whole crop weight
g/ma per day, (25)
where o is the growth respiration coefficient, H the number of daylight hours, TF(g/ma) the crop weight and 6 the maintenance respiration coefficient.
Dry-matter partitioning and grain growth submodel Daily net photosynthate production, Pn(CH2O),
calculated as the difference between daily photo-synthate production and respiration
Pn (CH2O) = PO(CH2O) - R g/m2 per day
(26) is divided between roots, leaves and stems, and later, ears. The proportions of dry matter allocated to stems, leaves and roots change in a preset manner at double ridge, anthesis and maturity (see Appendix Table 1). Ear growth occurs during the last 400 PTt °C days before anthesis; during ear growth 30 % of new net assimilate is allocated to
the ears. Following R. A. Fischer (personal com-munication), the number of grains per ear is deter-mined from ear weight at anthesis by assuming that each 10 mg of ear weight is equivalent to one grain.
Grain growth is modelled by making all the net assimilate produced between anthesis and maturity available for grain growth, together with an as-similate pool of 30 % of shoot weight at anthesis (Austin et al. 1977). It is assumed that chaff weight at maturity is equal to ear weight at anthesis (Pearman, Thomas & Thome, 1977; Martinez-Carrasco & Thome, 1979). The phase from anthesis to maturity is divided 55:240:55 in thermal time into three grain growing periods: initiation, linear growth and mature. During the initiation period all net assimilate accumulates in the pool. During the mature period grain does not increase in weight, but if daily net assimilate is negative it loses weight proportionately to the other plant parts. During the linear period grain growth has a temperature-limited maximum growth rate, OmBLX (Spiertz,
1977),
(27) 0-045 (Tm
mg/grain per day.
•3 1000 E
0
I A S l O l N l D l J l F l M l A I M I J I J
376
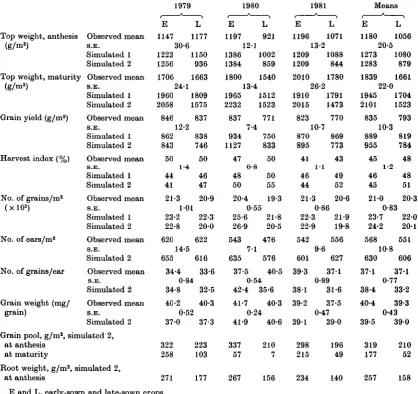
A. H. WEIR AND OTHERSTable 1. Observed and computer-simulated dry matter weights and yield components for Hustler winter wheat
grown at Rothamsted in 1978-81
Top weight, anthesis Observed mean (g/m2) S.E.
Simulated 1 Simulated 2 Top weight, maturity Observed mean
(g/m2) S.E. Simulated 1 Simulated 2 Observed mean S.E. Simulated 1 Simulated 2 Observed mean S.E. Simulated 1 Simulated 2 Observed mean S.E. Simulated 1 Simulated 2 Observed mean S.E. Simulated 2 Observed mean S.E. Simulated 2 Observed mean S.E. Simulated 2 Grain yield (g/m2)
Harvest index (%)
No. of grains/m2 (xlO3)
No. of ears/m2
No. of grains/ear
Grain weight (mg/ grain)
Grain pool, g/ma, simulated 2, at anthesis
at maturity
Root weight, g/m2, simulated 2, at anthesis 1979
E
1147 L 1177 30-6 1223 1150 1256 936 170& 1663 24-1 1960 1809 2058 1575 846 837 12-2 862 838 843 746 50 44 41 1-4 50 46 47 21-3 20-9 101 23-2 22-3 22-8 20-0 620 622 14-5 655 616 34-4 33-6 0-84 34-8 32-5 40-2 40-3 0-52 37-0 322 258 271 37-3 223 103 177 1980 E L 1197 921 12-1 1386 1002 1384 859 1800 1540 13-4 1965 1512 2232 1523 837 934 1127 47 48 50 7-4 0-8 771 750 833 50 50 55 20-4 19-3 0-55 25*6 21*8 26-9 20-5 543 476 7-1 635 576 37-5 40-5 0-54 42-4 35-6 41-7 40-3 0-24 41-9 40-6 337 57 267 210 7 156 1981 E L 1196 1071 13-2 1209 1088 1209 844 2010 1780 26-2 1910 1791 2015 1473 823 770 10-7 870 895 869 773 41 46 44l - l
21-3 43 49 52 20-6 0-86 22-3 21-9 22-9 19-8 542 556 9-6 627 601 39-3 38-1 39-2 391 298 215 234 371 0-89 31-6 37-5 0-47 390 196 49 140 Means E L 1180 1056 20-5 1273 1080
1283 879
1839 1661 22-0 1945 1704 2101 1523 835 793 10-3 889 819 955 784 45 46 45 1-2 48 48 51 21-0 20-3 0-83 23-7 220 24-2 201 568 551 10-8 630 606 371 38-4 40-4 39-5 319 177 257 37-1 0-77 33-2 39-3 0-43 390 210 52 158
E and L, early-sown and late-sown crops.
S.E. is the pooled standard error of the means of 32 plots for 1980, 16 plots for 1979 and 1981.
Simulated 1 is for computer simulations using observed LAI values, Simulated 2 for calculations using simulated LAI values.
Grains grow at the maximum rate unless limited by the availability of daily and pool assimilate.
RESULTS AND DISCUSSION
Observed weather and crop data
The six crops used to test the model came from the early- and late-sown treatments of the multi-factorial wheat experiments at Rothamsted in the seasons 1978-9, 1979-80 and 1980-1.
Weather. Figure 3 summarizes the weather for
period for the two 1980 crops. Solar radiation was very similar during the three winters, but 1981 was duller from the beginning of April onwards, so that during the period of rapid growth to the end of July 1981 the crops received about 8% less radiation.
Test crops. The predictions of the model were
compared with observations made on the early and later sown treatments of the multifactorial experi-ments on Hustler winter wheat made at Roth-amsted in 1978-9, 1979-80 and 1981-1 (Prew et al. 1983; Thome et. al 1981, 1982). Mean values for the two sowing dates, averaged over all other treat-ments, were used except when pests or diseases were known to have reduced growth. When this occurred means from the plots treated with the appropriate pesticide were used. Hence in all years the data for the last two samplings are from plots given fungicide and, in 1979, aphicide. Data for the crops in 1981 from the March sampling onwards were taken from plots given aldicarb. As a result of this selection, and of variation in the number of plots sampled on the different occasions, the number of plots included in the means quoted below was either 16 or 32. All the means quoted are averages of all the nitrogen treatments tested and, after irriga-tion started, of the two irrigairriga-tion treatments. Nitro-gen and irrigation had only small effects on grain yield although larger ones on some aspects of growth. These have been ignored in this paper. The sampling procedure ensured that stem bases were included in estimates of above ground crop until April, but not from May onwards when crop samples were cut at ground level. The figures quoted in this paper for these later samplings in-clude a correction for the stem bases estimated as 50 g/ma at maturity and anthesis but reduced pro-portionately to top weight for the May sampling. The grain yields quoted are for hand harvest samples.
The figures for leaf area index given here and by Porter (1984) include the area of green sheath esti-mated as height x diameter. In the original publica-tions sheath area was estimated as height x circumference.
The mean weights of the above-ground crops (top weights) for the 3 years of the early- and of the late-sown crops increased from 1180 and 1056 g/ma at anthesis to 1839 and 1661 g/m2 at harvest (Table 1), increases of 659 and 605 g/m2. Grain weights were 835 and 793 g/m2, 176 and 188 g/m2 more than the additional dry weight gains made during the grain-filling periods. This extra weight, which represents 20 and 23% of stem and leaf weights at anthesis, was supplied from a carbo-hydrate pool temporarily stored in the upper stems and leaves. The early-sown crops were about 5% heavier in grain yield and 11 % in top weight than
the late-sown, the harvest index, the ratio of grain weight to total top weight, being 45 and 48 % for the two groups.
When considering individual years, the 1980E crop had the largest top weight at anthesis and 1981E at maturity, and 1980L the smallest, but these differences were not maintained in the grain yields, which were very similar for all six crops. Variation in number of ears tended to be com-pensated for by number of grains per ear, so that number of grains per unit area of ground showed little variation. The range of top weights at an-thesis was 25%, and at harvest 27%, of the mean of the six crops. Number of grains per square metre had a range of 10% of the mean and grain yield a range of 9 %.
Simulated crops
It was our intention to use published crop data to develop the model and test its performance by comparing simulation runs against the observed crop data from the WW/3 experiments. This did not prove entirely possible, however, because of the lack of alternative crop data on Hustler winter wheat. Thus, the values of 0-002 and 0001 used for the maintenance respiration coefficient (Appendix Table 1) were modified from that of 0-003 for young clover plants (McCree, 1974) to represent more closely the reduced respiration of wheat crops, as deduced from the observed average growth rates of the six test crops. Similarly, the general scheme of partitioning of assimilate as given by R. A. Fischer (personal communication) was modified to conform to the mean weights of the different parts of the test crops.
378
A. H. WEIR AND OTHERSS E DR A M
,13, 167 | 98 55 3 3 3
11 I \Z 7. A H 1979 E
12 ' Tff" 90 52 326
A [55 | 104 63 328
L!+ -+ -\
12 151 108 60 331
tt ^ . ^ - * — 330
i_j i__ i I
10 160 103 60 333
& 1^4 82 55 3 1 5
£
£
l
I . L
hJ
i' 1979 L
14 170 75 49 308
A6, 151 . 75 . 62 , 3 04
<-+- J H 3 0 4 1980 L
V 149 f " " 80 * 57 305
H24H 138 78 49_^ 2 8 9
26 128 83 54 291
' S ' O ' N ' D ' J ' F ' M ' A ' M ' J ' J ' A '
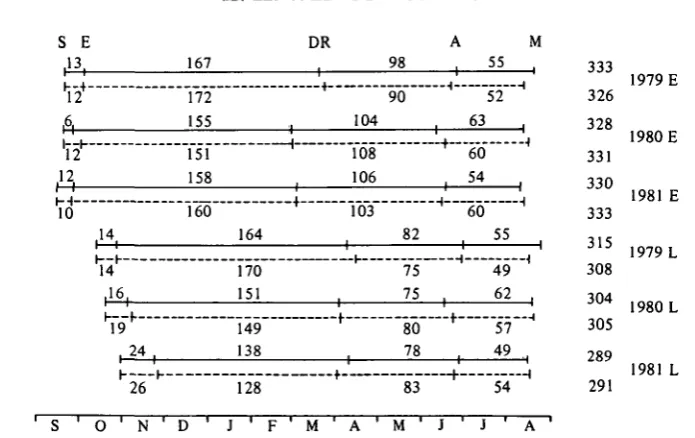
Fig. 4. Diagram showing the timing of phenological development stages for observed ( ) and simulated ( ) wheat crops. S, sowing; E, emergence; DR, double ridge; A, anthesis; M, maturity. The numbers indicate phase durations, in days.
10 r
0
-\ 3000
2000
- 1000 *
O ' N J M M
Fig. 5. Diagram showing the changes in observed LAI with time of the 1979L wheat crop ( ), the observed total dry-matter values (#—#), and simulated total dry-matter values using the observed LAI with temperature-modified photosynthesis (O — O) and without temperature modification ( H
1-)-within 5 days on average, the range being 3-8 days. The observed period from anthesis to maturity varied from 49 to 63 days. The longest grain-filling periods were for the early- and late-sown crops in the cool summer of 1980. The simulated intervals varied from 49 to 60 days, a slightly smaller range than that observed. Thus the use of a rather high base temperature of 9 °C did not cause overestima-tion of the differences between crops.
Dry-matter production and partitioning. Figure 5
shows the observed LAI and dry-matter variations
differ-379
D M
/
/ /
/A
Ar
s+R
GR
MR
_^-Gr
L
1354
570
838
^ 0 3
—1U3
649 242
r4000
2000 E
2 (2
M J
Fig. 6. Changes with time in total photosynthate, net of photorespiration, and its partitioning for the simulated 1979L crop with observed LAI and temperature-modified photosynthesis. GR, growth respira-tion; MR, maintenance respirarespira-tion; Gr, grain; E, ears; P, pool of photosynthate for grain growth; S + L,
stems and leaves; R, roots.
enoes in respiration of the simulated and observed crops.
Figure 6 shows the changes with time of pro-duction of total photosynthate, net of photorespira-tion, of the same simulation as in Fig. 5. The amounts of respired COa and thus of residual dry
matter depend on the values of the respiration constants (Appendix Table 1). In the simulation growth respiration accounted for 34% of gross photosynthate production throughout growth, whereas cumulative maintenance respiration in-creased from 6% at double ridges to 12% at anthesis and 15% at maturity. Figure 6 also illustrates how the dry matter produced is par-titioned into the different plant parts. With
AEC-WBEAI 1 the functioning of the root submodel does not affect the growth of the plant and the roots are used solely as a sink for assimilate. Further, root data for the six experimental crops are in-complete. For these reasons the effectiveness of the submodel in simulating root growth is not further commented upon. The assimilate pool for grain growth is created at anthesis and thereafter all new assimilate goes to the pool or to the grain. This simulated crop has a grain yield of 8-4 t/ha (9-9 t/ha at 85% moisture content), very similar to that observed, but a harvest index of only 46%, com-pared with 50 % for the observed crop.
Crop simulation using observed leaf areas. These are listed as simulated 1 in Table 1. The closer correspondence is with the late-sown crops. At anthesis these have 2 % more top weight than the observed crops and only 3 % (43 g/ma) more on average at maturity. Grain yields average 26 g/m2 more, most of the difference being for the observed 1981 crop which produced 100g/ma of grain less than the simulated crop. This is in agreement with
observations made at the time that the 1981 crops did not make as large grain yields as had been ex-pected on the basis of general crop growth.
In contrast to the late-sown crops, the simula-tions of the early-sown crops overestimated the observed dry-weight gains. Thus, at anthesis the simulated crop weights are 8% greater and at maturity 6 % greater. In terms of dry-matter pro-duction, the canopies of the early-sown crops may be less efficient at producing dry matter than those of the late-sown, although the observations are rather few on which to base such a claim. The simulated grain yields of the early-sown crops are 6% more than the observed, compared with 3 % for the late-sown.
Crop simulation using simulated leaf areas. In these calculations a uniform stand of 250 emerged plants produced tillers and a canopy, as described in more detail by Porter (1984). Table 1 shows that use of the simulated canopies underestimated the dry weight at anthesis of the late-sown crops by 17 % but overestimated those of the early-sown by 9 %. At maturity these differences are — 8 and
+ 19 % respectively, and the grain yield differences are — 1 and +14%. The least well matched of the six crops is that of 1980E, but in general the use of full simulation does not give as close correspond-ence, particularly of the late-sown crops, as does the use of observed LAIs in the simulations. The remainder of Table 1 shows the proportions of the grain pool used in the simulations, simulated root weights at anthesis and other components of yield. Components such as number of grains per ear and weight per grain agree quite closely between ob-served and simulated crops.
380
A. H. WEIR AND OTHERS+ 9 I I I
I!
50-2 i
I
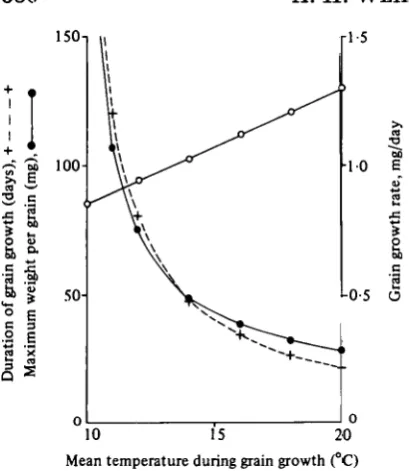
Mean temperature during grain growth (°C) Fig. 7. Illustration of the relationship used in the model between average temperatures during grain growth, grain growth rates, the duration of grain growth and maximum grain weights. Duration of grain growth in days (H 1-), maximum grain weight per grain in mg (#—0), and maximum grain growth rates in mg/day (O—O).
grain by the number of grains per square metre. The number of grains per square metre, which is calculated from ear weight at anthesis, is a function of total crop growth and thus of light interception during the ear growth period. The other component of yield, weight per grain, is obtained from the product of the grain growth rate and the duration of grain growth. Carbohydrate for grain growth is supplied either from daily photosynthesis or the pool, and while supplies are adequate growth pro-ceeds at its maximum rate. As shown above, both the maximum grain growth rate and the duration of the grain growth period are functions of temper-ature and so they and their product are related to the average temperatures of the grain growth period. Figure 7 illustrates this relationship after making the simplifying assumption that the fluctu-ating temperatures from anthesis to maturity can be adequately represented by single average tem-peratures. The interval from anthesis to maturity increases asymptotically to infinity as the average temperature falls towards the base temperature of 9 °C, and the grain growth period rises with fall in temperature in a similar fashion. The maximum rate of grain growth falls with mean temperature, but this is more than compensated for by the in-crease of the duration of the grain-filling period.
The only crop for which detailed measurements of grain weights during grain growth were available was 1981E (G. N. Thome, personal communica-tion), and grain weights were available for only the four central grains and not for all the grain in the ears. The period of linear grain growth was 37 days and for this the mean temperature was 15-4 °C. Figure 7 shows that a maximum grain weight of 41 mg/grain would be expected. The final observed weight was 37-5 mg/grain, but the detailed ob-servations showed that in this crop the four measured grains reached a maximum weight and then declined, presumably by respiration, by 9 %. Thus the average maximum weight for all the grains may have been very close to the value of 41 mg predicted by the grain growth model.
CONCLUSIONS
The simulation of the test crops has shown that
it is possible to reproduce quite closely the growth of October-sown crops using observed LAI values, but the use of comparable values for September-sown crops leads to overestimation of dry-matter production. Using the limited published leaf data available it has been possible to reproduce many details of the leaf canopy (Porter, 1984), but simula-tions of dry-matter production based on such canopies exaggerate the differences observed be-tween September- and October-sown crops and do not reproduce year-to-year fluctuations very well, possibly because of the sensitivity of the simulated canopy to the timing of development stages, par-ticularly anthesis.
During the assessment of these results it has become obvious that improvements can be made to the model in phenological development, canopy structure, respiration, partitioning of assimilate, and ear growth. For some parts, such as canopy structure, new data are already becoming available and the modelling process can be advanced. For other aspects, such as timing of development, there is urgent need for more observations on a range of cultivars and over sites spread throughout the country, especially as this can be used as a practical management tool.
this it will be very difficult to be certain that it was solely temperature and radiation that limited the yields at Rothamsted to 10 t/ha. The power and range of the model thus depends on the data base that it uses. Even at present it is a powerful tool for interpreting observations and pointing to where gaps in knowledge are a limit to understanding.
We thank R. D. Prew and his colleagues for permission to use data from the Rothamsted multi-factorial wheat experiments, and G. N. Thome for providing unpublished data and giving us valuable advice. We also thank Lynn Parry for computing assistance, J. J. Landsberg for much early planning and inspiration and W. Day for help with the till-ering and photosynthesis submodels and valuable discussion and criticism.
REFERENCES
ABNDT, C. H. (1945). Temperature-growth relationships of the roots and hypocotyls of cotton seedlings. Plant
Physiology 20, 200-220.
AUSTIN, R. B., EDBICH, J. A., FORD, M. A. &
BLACK-WELL, R. D. (1977). The fate of the dry matter, carbohydrates and 14C lost from the leaves and stems of wheat during grain filling. Annals of Botany 41, 1309-1327.
CHARLES-EDWARDS, D. A. (1978). An analysis of the photosynthesis and productivity of vegetable crops in the United Kingdom. Annals of Botany 42, 717— 731.
D E W I T , C. T., GOUDRIAAN, J., VAN LAAR, H. H., PENNING DE VRIES, F. W. T., RABBINGE, R. R., VAN KEULEN, H., LOTTWERSE, W., SIMBA, L. <fc DE JONGE,
C. (1978). Simulation of assimilation, respiration and transpiration of crops. Pudoc, Wageningen, The Netherlands.
FRANCIS, C. A. (1970). Effective day-lengths for the study of photo-period sensitive reactions in plants.
Agronomy Journal 62, 790-792.
GALLAGHER, J. N., THORNE, G. N. & TAYLOR, P. J.
(1981). Development of winter wheat. Rothamsted
Ex-perimental Station, Report for 1980. Part 1, pp. 53-54.
HOCHMAN, Z. (1979). Wheat in a semi-arid environment: a field and simulation study of the effects of water stress on yield. M.Sc. thesis, University of Sydney.
LANDSBERQ, J. J. & PORTER, J. R. (1982). The ARC
Wheat Model. In Aspects of Crop Growth Agronomy
Conference (ed. J. E. Davies and F. E. Shotton). MAFF Reference Book 341, pp. 104-115. London:
H.M.S.O.
LUMSDEN, M. E. (1980). The influence of weather on the development of winter wheat. B.Sc. thesis, University of Bath.
MCCREE, K. J. (1974). Equation for the rate of dark respiration of white clover and grain sorghum, as functions of dry weight, photosynthetic rate, and temperature. Crop Science 14, 509-514.
MARSHALL, B. & BISCOE, P. V. (1980a). A model for
C3 leaves describing the dependence of net photo-synthesis on irradiance. I. Derivation. Journal of
Experimental Botany 31, 29-39.
MARSHALL, B. & BISCOE, P. V. (19806). A model for C3
leaves describing the dependence of net photosyn-thesis on irradiance. I I . Application to the analysis of flag leaf photosynthesis. Journal of Experimental
Botany 31, 41-48.
MARTINEZ-CARRASCO, R. & THORNE, G. N. (1979).
Effects of crop thinning and reduced grain numbers per ear on grain size in two winter wheat varieties given different amounts of nitrogen. Annals of Applied
Biology 92, 383-393.
MILTHORPE, F. L. & MOORBY, J. (1979). An Introduction
to Crop Physiology. Cambridge: Cambridge University
Press.
MORGAN, J. M. (1976). Asimulation model of the growth of the wheat plant. Ph.D. thesis, Macquarie Uni-versity.
PEARMAN, I., THOMAS, S. M. & THORNE, G. N. (1977).
Effects of nitrogen fertilizer on growth and yield of spring wheat. Annals of Botany 41, 93-108.
PENNING DE VRIES, F. W. T. & VAN LAAR, H. H. (ed.)
(1982). Simulation of Plant Growth and Crop
Produc-tion. Pudoc, Wageningen, The Netherlands.
PORTER, J. R. (1984). A model of canopy development in winter wheat. Journal of Agricultural Science,
Cambridge 102, 383-392.
PORTER, J. R., BRAGG, P. L., RAYNER, J. H., WEIR,
A. H. & LANDSBERG, J. J. (1983). The ARC wheat simulation model - principles and progress. In
Oppor-tunities for Manipulations of Cereal Productivity (ed.
A. Hawkins and B. Jeffcoat). British Plant Growth
Regulator Group, Monograph 7, pp. 97-108.
PREW, R. D., CHURCH, B. M., DEWAB, A. M., LACBY, J., PENNY, A., PLUMB, R. T., THORNE, G. N., TODD,
A. D. & WILLIAMS, T. D. (1983). Effects of eight factors on the growth and nutrient uptake of winter wheat and on the incidence of pests and diseases.
Journal of Agricultural Science, Cambridge 100,
363-382.
SPIERTZ, J. H. J. (1977). The influence of temperature and light intensity on grain growth in relation to the carbohydrate and nitrogen economy of the wheat plant. Netherlands Journal of Agricultural Science 25,
182-197.
TENHUNEN, J. D., WEBER, J. A.,YOCUM,C. S. & GATES,
D. M. (1976). Development of a photosynthesis model with an emphasis on ecological applications. I I . Analysis of a data set describing the PM surface.
Oecologia 26, 101-119.
TENHUNEN, J. D., YOCUM, C. S. & GATES, D. M. (1976).
Development of a photosynthesis model with an emphasis on ecological applications. I. Theory.
Oecologia 26, 89-100.
THORNE,G. N . , D E W A R , A . M.,WILLIAMS,T. D.,LACEY, J., PLUMB, R. T., PREW, R. D., CHURCH, B. M. &
382
A. H. W E I R AND OTHERS wheat. Rothamsted Experimental Station, Report for1980, Part 1, pp. 19-20.
T H O K N E . G . N.,DEWAR,A. M.,WIIXIAMS,T. D...LACEY, J., P L U M B , R. T., P B E W , R. D., P E N N Y , A., CHUBCH,
B. M. & TODD, A. D. (1981). Factors limiting yield of Press.
winter wheat. Rothamsted Experimental Station,
Report for 1981, Part 1, p. 18.
THORNXEY, J. H. M. (1976). Mathematical Models in
Plant Physiology. London and New York: Academic
Sowing to emergence Emergence to double ridge Double ridge to anthesis Anthesis to maturity
Appendix Table 1. Parameter values
Phenological development
Base temperature (°C) 1
1 1 9
PAR interception Extinction coefficient, k
Leaf transmission coefficient, m
Photosynthesis
Photosynthetio efficiency, a
Ambient CO8 concentration, Ca Boundary layer resistance, r0 Mesophyll resistance, rm
Activation energy of the electron transport system, AH! Denaturation energy of the electron transport system, A/?8
Entropy change on denaturation of the electron transport system, AS Gas constant, R
Growth respiration coefficient, a Maintenance respiration coefficient, 6:
Emerge to anthesis Anthesis to maturity
Respiration
Dry-matter partitioning
Thermal time 148 °C days
2 8 4 F V x F P x "Cdays 600 FP x °C days 350 °C days
0-44
010
0-009 mg/J 600 mg/m' 30 sec/m 400 sec/m 14200 cal/mol 47000 cal/mol 153-4 cal/K per mol 1-987 cal/K per mol
0-34
0-002 0001
Proportions of current assimilate
Emergence to double ridge
Double ridge to beginning ear growth Beginning ear growth to anthesis
Roots 0-35 0-20 0-10
Leaves 0-55 0-40 0-30
Stems 010 0-40 0-30