DEMOGRAPHIC RESEARCH
VOLUME 31, ARTICLE 46, PAGES 1365–1416
PUBLISHED 9 DECEMBER 2014
http://www.demographic-research.org/Volumes/Vol31/46/ DOI: 10.4054/DemRes.2014.31.46
Research Article
The educational gradient of childlessness and
cohort parity progression in 14 low fertility
countries
Jonas Wood
Karel Neels
Tine Kil
© 2014 Jonas Wood, Karel Neels & Tine Kil.
This open-access work is published under the terms of the Creative Commons Attribution NonCommercial License 2.0 Germany, which permits use, reproduction & distribution in any medium for non-commercial purposes, provided the original author(s) and source are given credit.
1 Introduction 1366
2 Theoretical framework 1368
2.1 Education and fertility 1368
2.1.1 Enrolment and role incompatibility 1368 2.1.2 Attitudes toward childbearing and fertility intentions 1368 2.1.3 Labour market position and opportunity costs 1369 2.1.4 Knowledge and contraceptive use 1371 2.1.5 Confounding factors and selectivity 1371 2.2 Contextual variation in the association between education and
fertility
1372
2.3 The European and Australian contexts 1372
2.3.1 Northern Europe: Norway 1372
2.3.2 Anglo-Saxon countries: Australia and the UK 1373 2.3.3 Western Europe: Belgium, France, and the Netherlands 1373 2.3.4 Southern Europe: Italy and Spain 1374 2.3.5 Central and Eastern Europe: Bulgaria, Estonia, Georgia, Hungary,
Romania, and Russia
1375
3 Data and methods 1377
3.1 Data 1377
3.2 Methods 1378
4 Results 1381
4.1 Transition to parenthood 1382
4.2 Second births 1384
4.3 Third births 1387
5 Conclusions 1395
References 1399
The educational gradient of childlessness and cohort parity
progression in 14 low fertility countries
Jonas Wood1
Karel Neels2
Tine Kil3
Abstract
BACKGROUND
Although the association between fertility and education is central to several theories of fertility behaviour and is frequently explored in empirical work, educational differentials in childlessness and cohort parity progression have been scarcely documented and few cross-country comparisons have been made.
OBJECTIVES
This article explores educational gradients with respect to entry into parenthood and parity progression for cohorts born between 1940 and 1961 in 14 low-fertility countries.
METHODS
Using longitudinal microdata, discrete-time event history models for repeated events are estimated for first, second, and third births including a random effect at the level of individual women (shared frailty). Subsequently, estimated hazards are used to calculate cohort parity progression ratios by level of education.
RESULTS
Educational gradients in fertility differ strongly between countries whereas change over time within countries is limited. In all countries childlessness is more frequent among highly educated women, suggesting that negative effects of opportunity costs outweigh positive income effects. The effect of unequal selection into motherhood across educational groups on educational gradients in higher order births through unobserved time-invariant characteristics is limited. For second births, Central and Eastern
1 University of Antwerp, Centre for Longitudinal and Life Course Studies, Belgium.
E-Mail: [email protected].
2 University of Antwerp, Centre for Longitudinal and Life Course Studies, Belgium.
E-Mail: [email protected].
3 University of Antwerp, Centre for Longitudinal and Life Course Studies, Belgium.
European countries (Bulgaria, Estonia, Georgia, Romania, Russia, Hungary) show negative educational gradients, whereas the educational gradient is neutral or positive in other countries (Norway, Australia, UK, Netherlands, Belgium, France, Spain, Italy). For third births results show that Central and Eastern European countries more often display negative educational gradients, whereas other European regions and Australia show negative gradients, positive gradients, and U-shaped patterns of association. The strong differences between countries suggest that context plays an important role in shaping educational gradients in childlessness and parity progression.
1. Introduction
The socio-economic position of women has changed markedly over recent decades. The share of women in tertiary education has been increasing since the 1970s across Europe and in Australia (World Bank 2012). In non-communist countries increasing education and earning potential of women entailed rising female labour force participation (Esping-Andersen 1999; McDonald 2006), whereas in communist countries female labour force participation was assumed a civic duty and was routinely encouraged by the communist party up to the collapse of the communist regimes (Klesment and Puur 2010; Oláh and Fratczak 2004; Spéder and Kamarás 2008; Kocourková 2002; UN 2004).
In many countries educational expansion and increasing female labour force participation coincided with rapid postponement of motherhood and a decline of period fertility levels well below the replacement level. The coincidence of these trends has fuelled interest in the association between female education and fertility. Both cultural and economic theories of fertility have referred to increasing education in recent generations – particularly of women – as an important factor in fertility decline, assuming that fertility and female educational attainment are negatively associated (Becker 1991; Cigno 1991; Lesthaeghe and Surkyn 1988).
Romania (Muresan and Hoem 2010). Van Bavel (2006) finds a negative educational gradient in motherhood across Europe. Studies on the educational gradient of second and higher-order births have come up with mixed results. In Western, Northern, and Southern European countries, second and third birth hazards have been found to be higher for highly educated people (Kreyenfeld 2002; Bratti 2003; Andersson, Hoem, and Duvander 2006; Köppen 2006; Kravdal and Rindfuss 2008; Caltabiano, Castiglioni, and Rosina 2009; Muresan and Hoem 2010; Neels and De Wachter 2010; Rønsen and Skrede 2010). By contrast, CEE countries are characterized by a negative association between education and progression to higher-order births (Berent 1970; Kharkova and Andreev 2000; Kreyenfeld 2004; Koytcheva 2006; Gjonca, Aassve, and Mencarini 2008; Muresan 2008; Moskoff 1980; Perelli-Harris 2008; Muresan and Hoem 2010). Estonia seems to be an exception, where positive effects of education on second order births have been found (Klesment and Puur 2010).
Despite the theoretical and empirical interest in the association between education and fertility, few studies have investigated whether the association has changed over time. For Belgium (Neels and De Wachter 2010), Italy (Caltabiano, Castiglioni, and Rosina 2009), and Norway (Kravdal and Rindfuss 2008) studies have found that the relation between higher education and fertility has become more positive, which has been associated with changes in the institutional context (e.g., child care provision). Similarly, studies on educational differentials in order-specific cohort fertility are relatively scarce. Although largely neglected until the early 2000s (Sobotka 2004) the relation between education and ultimate childlessness has been increasingly addressed in recent publications (Parr 2004; Hoem, Neyer, and Andersson 2006; Van Bavel 2006; Neyer and Hoem 2008; Bagavos 2010), but less work has been done on the educational gradient of cohort parity progression. Whereas several studies have drawn attention to the potential impact of unobserved characteristics on the association between education and parity progression to higher-order births, only a few studies have attempted to control for such selectivity (Kravdal 2001; Kreyenfeld 2002; Kravdal 2007; Jenkins 2011).
This paper contributes to the literature on the association between education and cohort fertility by breaking down order-specific cohort parity progression ratios (CPPR) by level of education for successive birth cohorts (1940–1961) in 14 low-fertility countries4. In doing so the paper explores between-country variation in the association between education and fertility, as well as within-country variation over subsequent birth cohorts. With respect to the educational gradient of higher-order births, we use shared frailty models to control for selective entry into parenthood.
4 Australia, Belgium, Bulgaria, Estonia, France, Georgia, Hungary, Italy, the Netherlands, Norway, Romania,
2. Theoretical framework
The theory section consists of three parts. First, we consider the various pathways through which education and childbearing may affect each other. Second, we consider how context may mediate the relationship between education and family formation. Finally, we consider aspects of the institutional and societal context of countries included in the analysis that may be relevant to the relation between education and fertility outcomes.
2.1 Education and fertility
Education and fertility are related through diverse mechanisms (Lappegård and Rønsen 2005) and both processes may affect each other. We consider enrolment and role incompatibility, attitudes to childbearing and fertility intentions, opportunity costs associated with family formation, and contraceptive knowledge.
2.1.1 Enrolment and role incompatibility
Several studies have illustrated the negative effect of enrolment in education on family formation, suggesting that in most contexts the roles of student and parent are incompatible (Blossfeld and Huinik 1991; Kravdal and Rindfuss 2008; Lappegård and Rønsen 2005). Highly educated women’s prolonged enrolment in education has been shown to be closely related to postponement of parenthood, but may also limit the time left for progression to higher-order births (Neels and De Wachter 2010; Ni Bhrolchain and Beaujouan 2012). Conversely, having a child while being enrolled in education is likely to cause an exit out of the educational system (Cohen, Kravdal, and Keilman 2011). This lower educational position resulting from dropping out of the educational system may in turn affect labour market positions and subsequent childbearing decisions.
2.1.2 Attitudes toward childbearing and fertility intentions
and Rosina 2009; Lesthaeghe 2010). Although initially geared to trends in North-Western Europe, the SDT narrative has subsequently been applied to explain trends in Southern and Eastern Europe, the United States, Latin America, and Asia (Lesthaeghe and Neidert 2006, 2009; Lesthaeghe 2010; Esteve, Lesthaeghe, and López-Gay 2012). Contrary to these expectations, post-materialist attitudes do not seem to be negatively correlated to ideal family sizes and a considerable number of studies find higher fertility intentions for highly educated women (De Wachter and Neels 2011; Mills et al. 2008; Ruokolainen and Notkola 2002). Also, recent findings show unclear educational gradients in fertility intentions across Europe (Beaujouan et al. 2013). Rather than higher-order needs directly and negatively affecting fertility intentions, recent work on the SDT (Lesthaeghe 2010) has increasingly drawn attention to the impact of institutional context in shaping fertility outcomes.
2.1.3 Labour market position and opportunity costs
Becker’s New Home Economics (Becker 1960, 1991; Cigno 1991) claims that children are desired but costly goods and that childbearing decisions are rational actions based on costs and benefits within the household production model. The relation between education, labour market participation, and childbearing is explained by two behavioural mechanisms. On the one hand, the income effect suggests that higher education may increase fertility, as the higher earnings put highly educated (wo)men in a better position to cope with the direct costs associated with childbearing. The positive income effect may be attenuated, however, when higher earnings are invested in the quality of children rather than having an additional child (Becker and Lewis 1973). On the other hand, the favourable labour market prospects and earnings associated with higher education may negatively affect fertility, as they increase the cost of engaging in non-market activities such as childrearing. Rising opportunity costs negatively affect the demand for children and curtail fertility. The effect of education on fertility outcomes largely depends on the balance between the income effects and opportunity costs, which may vary substantially in terms of societal and institutional context (Blossfeld and Huinink 1991; Liefbroer and Corijn 1999; Lappegård 2002; Smith and Ratcliffe 2009; Neels and De Wachter 2010; Adsera 2011).
employment5, adding a normative aspect to the work-family tension (Friedman, Hechter, and Kanawaza 1994; Buchholz et al. 2009; Neels and Theunynck 2012a, 2012b). As a result, highly educated women are unlikely to enter parenthood early in the life-course as they face potential loss of career prospects and future income (Lappegård 2002; Sobotka 2004; Lappegård and Rønsen 2005). Given that income typically rises with age for highly educated groups, highly educated women may have accumulated sufficient earnings at older ages to progress to motherhood or higher parities6. Having achieved a stable labour market position may also allow a temporary retreat for childbearing and taking up flexible work arrangements at lower opportunity costs (Kravdal 2001, 2007; Hakim 2003; Köppen 2006). Literature shows that highly educated mothers are more likely to remain active in the labour market and are more likely to make use of (in)formal childcare arrangements (Desmet, Glorieux, and Vandeweyer 2007; Ghysels and Van Lancker 2009; OECD 2011a; Martin and Juarez 1995; Neels and Theunynck 2012a, 2012b). Allowing variation between institutional contexts, it is also likely that highly educated women will more easily be able to afford private or partially subsidized childcare, assuming higher earnings (Kreyenfeld 2002; Köppen 2006; McDonald 2006).
Labour market positions for low-educated women are characterized by lower earnings and a flat income curve over age. Building up experience in order to safeguard a stable labour market position later in the life course only plays a minor role, which results in relatively low opportunity costs at young ages. Provided that they can cope with the direct costs related to parenthood, low-educated women can be expected to progress to motherhood earlier in the life-course compared to highly educated women (Liefbroer and Corijn 1999; Lappegård and Rønsen 2005). At later stages of family formation household income may become relatively more important as low-educated mothers may – depending on educational homogamy and household income – face financial restrictions when progressing to a second or third child. Additionally, literature indicates that low-educated mothers are more likely to retreat from the labour market for childrearing (Köppen 2006; Neyer and Andersson 2008; De Wachter and Neels 2011; Neels and Theunynck 2012a; Neels and Theunynck 2012b). This may lower the opportunity costs of having a second or third birth, but at the same time it weakens household income.
5 We do not claim that these differences are mere effects of education, as women are likely to self-select
themselves into educational groups (Sobotka 2004).
6 However, a quantity-quality swap – meaning that higher income can also be used to enhance the quality of
2.1.4 Knowledge and contraceptive use
The most explicit function of education – transfer of knowledge – can also affect childbearing decisions (Martin and Juarez 1995). First, highly educated people are trained to think more rationally about decisions affecting their life course and thus might have a clearer view of the difficulties of childrearing (Sobotka 2004). Hence, in the case where prevailing two-child norms or other normative pressures exist (e.g., pronatalist governmental pressures in communist regimes), highly educated people have more arguments to resist these pressures (Muresan and Hoem 2010; Sobotka 2004). Second, assuming that contraceptive knowledge is required to avoid timing and/or parity failures, variation in contraceptive use by level of education may translate into educational differentials in fertility behaviour (Sobotka 2004). Women’s education is considered particularly important as female contraceptives are most frequently used. Literature shows evidence for better contraceptive use among highly educated persons (Kravdal 1992, 2007; Kravdal and Rindfuss 2008).
2.1.5 Confounding factors and selectivity
The relationship between education and fertility may be affected by unobserved factors determining both educational attainment and level of fertility7. In this sense, educational and childbearing choices can be considered as a joint decision (Steele et al. 2005; Martin-García and Baizán 2006).
Selective entry into parenthood among highly educated women may be particularly relevant for parity progression to second and higher-order births. Women who have made the transition to parenthood may constitute a selective subgroup (e.g., more family-oriented or childbearing-prone) of women initially at risk of parenthood. If the constraints on transition to motherhood are stronger for highly educated women (due to higher opportunity costs), the group of women at risk of having a second child may be more selective among highly educated women (e.g., in terms of being family-oriented) than is the case among low-educated women, which can positively bias the educational gradient in parity progression to higher-order births (Kravdal 2001, 2007; Muresan and Hoem 2010). However, to the extent that having only one child is an effective strategy to comply with social norms regarding parenthood while controlling opportunity costs, the group of higher-educated women entering parenthood need not be strongly selective in terms of being family-oriented and the impact on parity progression to second and higher-order births may be limited.
7 Prior intentions may affect both educational outcomes and family formation (e.g., a woman may decide to
2.2 Contextual variation in the association between education and fertility
As economic and cultural theories of fertility suggest, the institutional and normative context potentially affects the relation between education and fertility. First, the impact of a birth while enrolled in education on the final level of education depends on the nature of the educational system. If an educational system is open to re-entry, women may return to education and continue their education (Hoem, Neyer, and Andersson 2006; Kravdal and Rindfuss 2008; Kravdal 2007). Similarly, the degree to which women face work-family incompatibilities depends on the context they live in. Family policies can facilitate the work-family combination and reduce opportunity costs by providing or subsidizing services that assume partial responsibility for childcare (e.g., day care institutions). In addition to and interrelated with social policy, the broader cultural climate vis-à-vis gender equality will affect the division of work within households and the additional workload for working women associated with childrearing (McDonald 2006). Finally, labour policies and tax systems affect the income available to educational groups (e.g., progressive versus proportional or regressive tax systems).
2.3 The European and Australian contexts
The following sections provide a brief description of the institutional and societal contexts of the countries included in the analysis. We focus on openness of educational systems to re-entry at older ages, family policies supporting the combination of work and family, and redistributive social policies that affect the income position of individuals and households.
2.3.1 Northern Europe: Norway
In Norway the educational system is characterized by flexible re-entry and lifelong learning (OECD 2001). Kravdal and Rindfuss (2008) find that more than one fifth of the women born in 1964 had a higher level of education at age 39 than when they first became a parent.
2012b) and high commitment to gender equity (Duvander, Lappegård, and Andersson 2010).
In addition to the supportive climate towards family, Norway is also characterized by low income inequality and comprehensive social insurance (e.g., universal benefits) (Arts and Gelissen 2002; Esping-Andersen 1990; Esping-Andersen 1999; Korpi 2000).
2.3.2 Anglo-Saxon countries: Australia and the UK
The share of women who graduate from university at age 30 and older is only slightly smaller in Anglo-Saxon countries than in Norway (OECD 2011b) and adult participation in formal education is even higher in the UK than in Norway (EURYDICE 2011). This indicates that the educational system is open to re-entry at older ages.
Anglo-Saxon countries, however, show limited public support (e.g., parental leave, childcare) toward families and maternal employment (Esping-Andersen 1999; Gauthier 2002; Korpi 2000; Thévenon 2008). The UK is characterized by expensive private childcare (Viitanen 2005) and high reliance on informal childcare (Esping-Andersen 1999; Korpi 2000; Sobotka 2004). In line with low public support for families, Australia also shows relatively negative attitudes to women’s employment, whereas attitudes are more positive in the UK (Korpi 2000).
The social security system in the UK and Australia’s targeted redistribution strategy provide relatively low protection and income benefits tend to be targeted at the lowest income groups (Esping-Andersen 1990; Arts and Gelissen 2002; Korpi 2000). However in the UK (tax) benefits for families with children are relatively high and targeted towards lower incomes (Van Lancker and Van Mechelen 2014). Anglo-Saxon countries – especially the UK – display higher inequality in earnings and higher poverty (Korpi 2000). In the UK educational differentials in earnings are relatively large from a comparative European perspective (OECD 2011b).
2.3.3 Western Europe: Belgium, France, and the Netherlands
Countries in Western Europe generally show strong variation in adult participation in education, with high participation in Belgium, intermediate levels in the Netherlands, and low participation in France (EURYDICE 2011). Hence the degree to which educational careers can be interrupted and continued at later ages is subject to between-country variation.
(Gauthier 2002; Thévenon 2008), but also by strong variation between countries. Support for families and dual earners through formal childcare was expanded during the 1970s and 1980s in Belgium and France, whereas the combination of work and family for mothers in Germany remains more cumbersome and mothers in the Netherlands rely heavily on part-time work (Korpi 2000; Köppen 2006; Morel 2007; Thévenon 2011; Klüsener, Neels, and Kreyenfeld 2013).
Concerning attitudes toward working mothers, several authors argue that Western European countries are characterized by attitudes that regard women as supplementary income providers, thus emphasizing their role as care-takers and resulting in a male breadwinner and female part-time-carer model (Korpi 2000; Baranowska-Rataj and Matysiak 2014).
Income protection is well established in most Western European countries, although to a lesser extent than in Nordic countries (Esping-Andersen 1990; Arts and Gelissen 2002). The Netherlands resembles the UK in that the social security system is characterised by flat rate benefits, whereas Belgium and France display a state corporatist model where insurance programmes are differentiated by occupational category (Korpi 2000).
2.3.4 Southern Europe: Italy and Spain
Southern European countries are characterized by low adult participation in education in European comparison, particularly among the low-educated (OECD 2011b; EURYDICE 2011).
Sobotka (2004) indicates that Spain and Italy in particular are characterized by institutional and normative climates that hinder working mothers, which leads to later and lower fertility. In the literature this has been referred to as the paradox of “familialistic” policies in Southern Europe (Esping-Andersen 1999; Delgado, Meil, and Zamora-López 2008; Thévenon 2008). In line with a lack of social policy, Southern European countries are characterized by a climate where male-breadwinner couples are considered the best environment for childbearing (Mencarini and Tanturri 2006; Matysiak and Vignoli 2010). The rigidity of the labour market – which unlike flexible Northern labour markets focuses on stable jobs for male-breadwinners in tandem with high job protection – further supports the male-breadwinner model (Esping-Andersen 1999).
2.3.5 Central and Eastern Europe: Bulgaria, Estonia, Georgia, Hungary, Romania, and Russia
During communism educational enrolment was more compatible with childbearing8 (Kantorová 2006; Klesment and Puur 2010; Koytcheva 2006; Kreyenfeld 2004), so having a child while being enrolled in education did not necessarily preclude graduation from education.
Due to the abrupt rate of fertility decline in the 1970s9, communist regimes installed extensive pronatalist policies. Nursery attendance (children under 3) and especially kindergarten attendance (3- to 6-year olds) was high from a European perspective10 and extensive leave arrangements were provided (Avdeyeva 2009; Keil and Andreescu 1999; Oláh and Fratczak 2004; Klesment and Puur 2010; Kocourková 2002; Moskoff 1980; Spéder and Kamarás 2008; Aassve, Billari, and Spéder 2006; UNICEF 1999). In addition, housing policies favoured young married couples with children (Keil and Andreescu 1999; Sobotka 2004; McIntyre 1975), cash family benefits were granted (McIntyre 1975), and access to rationed goods was easier for parents (Keil and Andreescu 1999). Despite high labour force participation, women were also expected to take care of all childrearing and household tasks (Sobotka 2004; Spéder and Kamarás 2008; Oláh and Fratczak 2004; Zakharov 2008). Hence, while gender equality was reached in the labour market, this was much less the case in the household, leaving women with a so-called ‘double burden’11 (Kocourková 2002; Moskoff 1980).
Communist regimes were also characterized by repressive pronatalist measures. Tax schemes often favoured married couples and parents (Keil and Andreescu 1999; McIntyre 1975; Moskoff 1980; Zakharov 2008) and contraceptives were scarce or legally restricted (McIntyre 1975; Keil and Andreescu 1999). The latter resulted in high abortion rates in the CEE region compared to other European countries12 (UNICEF 1999).
8
Family formation of women in CEE countries born between 1940 and 1961 largely took place before the fall of communist regimes in these countries.
9 Partly due to the legalization of abortion (McIntyre and Lindley 1972) and elevated female employment
rates (Kocourková 2002)
10 Literature shows that overcrowding of public childcare was a persistent problem (e.g., Romania (Moskoff
1980)) (UNICEF 1999). The overcrowding of nurseries did not occur in Hungary and attendance further decreased as many mothers took childcare leave in the 1980s (Kocourková 2002). Enrolment in nurseries was also low in Bulgaria whereas it was higher in Georgia and relatively high in Russia (UNICEF 1999).
11 Moskoff (1980) claims this burden was exacerbated in Romania due to fact that the government gave low
priority to decreasing the labour-intensiveness of housework (e.g., stoves, fridges, supermarkets).
12 UNICEF (1999) reports that in CEE the abortion rate was around 100 per 100 live births in 1994 whereas in
Although pronatalist policies in the CEE region during communism strongly differed from policies in other regions of Europe there were, also important differences between communist countries (McIntyre 1975). Notwithstanding the severe housing problems (Hegedüs, Eszenyi, and Teller 2009; Bodnár and Böröcz 1998; Oláh and Fratczak 2004), communist Hungary has often been referred to as "the happiest barrack in the socialist camp” in that Hungary resembled Western Europe the most (available amenities, urbanization, industrialization, education, etc.) (Keil and Andreescu 1999; Zakharov 2008). Furthermore, Hungary almost exclusively relied on non-repressive policies to stimulate second and third births (McIntyre 1975). By contrast, Bulgaria introduced a mix of repressive (restrictions on abortion) and stimulating measures (family allowances, maternity leave, child-care facilities, housing) at the end of the 1960s with the aim of increasing second and third birth rates. While displaying a relatively moderate package of stimulating policies (Moskoff 1980), Romania holds a remarkable position with respect to abortion policy (abortion was banned in 1966 after strong falls in fertility) (Keil and Andreescu 1999; Moskoff 1980; Muresan et. al. 2008). This entailed a relatively low abortion rate (UNICEF 1999), but also quasi-legal or illegal abortions, which were only affordable for women with relatively high household incomes (Moskoff 1980). The Soviet Union13 did not restrict abortion availability (McIntyre 1975) and consequently in 1989 shows the highest abortion rates in the region (UNICEF 1999). Furthermore, the availability of contraceptives was higher, allowing for more freedom in family planning (Moskoff 1980).
Since wage differences in CEE countries were generally constrained, (near-)full employment was reached, and returns to education were low (Klesment and Puur 2010; Kertesi and Köllö 2001; Ferge 1997), limited income differences by education can be expected. However the literature shows that the socialist states were not freed from inequality and poverty risks (Berent 1970; Ferge 2002; Kremer, Sziklai, and Tausz 2002). Highly educated women, for instance, earned considerably higher wages than low-educated women (Oláh and Fratczak 2004). Access to higher education was limited (Spéder and Kamarás 2008), with admission being based on academic qualifications but also Communist Party membership (Kantorová 2004). Members of the Communist Party were also favoured in the housing market (Bodnár and Böröcz 1998) and enjoyed luxury residential areas, separate hospitals, cars, shops, and many more consumer goods (Ferge 2002).
3. Data and methods
3.1 Data
The analysis uses longitudinal microdata for 14 countries. For Australia, Bulgaria, Estonia, France, Georgia, Hungary, Italy, the Netherlands, Norway, Romania, and Russia, partnership and maternity histories were drawn from the first wave of the Generations and Gender Surveys (GGS), which were conducted between 2002 and 2008. Validation of cohort total fertility rates (CTFR) estimated retrospectively from the GGS shows that fertility indicators for cohorts born since the mid-1940s do not deviate substantially from vital registration for most countries (Vergauwen, Wood, and Neels 2012). Because GGS data typically underestimate cohort fertility for older cohorts, cohorts born before 1940 are not considered in the analysis. For Romania, Bulgaria, Georgia, and Italy all results must be interpreted with caution, since the GGS underestimate cohort TFRs for all birth cohorts. To the extent that this bias occurs differentially across educational groups, educational differentials may also be affected14. For Spain and the UK the analysis draws microdata from the harmonized histories provided by the non-marital childbearing network (Perelli-Harris, Kreyenfeld, and Kubisch 2010). For Belgium the analysis uses a 10 per cent sample from the 2001 census. Validation of the 2001 census shows close correspondence with vital registration data for all birth cohorts (Neels and Gadeyne 2010).
The analyses consider women born between 1940 and 1961. A cohort approach to fertility allows us to draw clear conclusions on the quantum of first births, whereas in a period approach, timing effects can be misinterpreted as affecting lifetime fertility. Since fertility after the age of 39 is limited (Frejka and Calot 2001), we assume that cumulated cohort fertility at age 39 closely approximates cohort-completed fertility. In the data for the 14 countries considered, the share of women born between 1940 and 1961 that had a first, second, or third birth after age 39 is limited to 0.73 per cent, 1.27 per cent, and 2.94 per cent, respectively. Since the share for highly educated women is larger in most countries, we acknowledge that censoring at age 39 may entail an underestimation of fertility of highly educated women. However, since the number of
14 People with higher socioeconomic status or education are generally more willing to participate and thus are
births after age 39 is also small among highly educated women, we expect that the impact on educational gradients is limited.
3.2 Methods
Using retrospective maternity histories, fertility is decomposed by natural order of birth and educational level for birth cohorts of women born between 1940 and 1961. We distinguish three educational groups using the international standard classification of educational levels (ISCED 1997):
i) low education (ISCED 0–2), ii) middle education (ISCED 3–4), and iii) high education (ISCED 5–6).
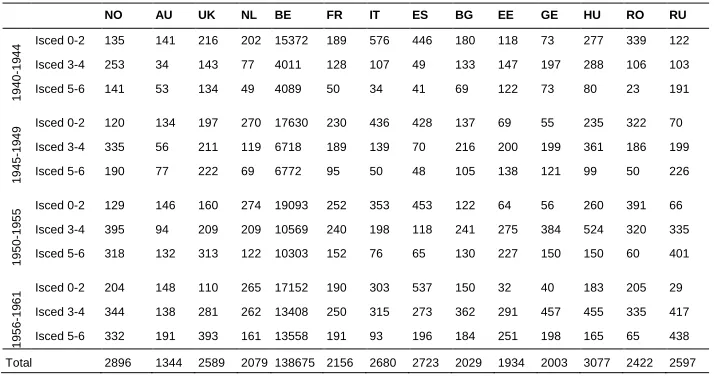
The relative distribution of women by level of education and birth cohort is shown in Table 115. Women with missing data for educational attainment were excluded from the analysis. The analysis includes education at the time of the survey as a time-constant variable. This is done for several reasons. The design of the GGS questionnaire does not allow a complete reconstruction of education histories. Combining the GGS Wave 1 questions “What is the highest level of education you have successfully completed?” and “In what month and year did you reach that level?” does not provide sufficient information to evaluate whether an individual was continuously enrolled in education up to the date of the highest educational attainment. In addition, no question regarding the date of highest attainment was included in the Australian GGS, and dates of highest educational attainment in the Norwegian GGS prior to 1971 were coded “Norway deviation: 1970 or earlier”. Hence the GGS Wave 1 data do not allow us to assess if a birth occurred when enrolled in education. In line with Hoem and Kreyenfeld (2006), we acknowledge that the use of level of education at the time of the survey impedes causal inferences to be made due to reverse causality (i.e., parity progression may determine educational level (Cohen, Kravdal, and Keilman 2011)). This paper does not aim to establish a causal mechanism between education and parity progression, but rather to assess the association of education and parity progression at the end of the reproductive lifespan.
Table 1: Educational distribution of women by birth cohort, 14 low-fertility countries
NO AU UK NL BE FR IT ES BG EE GE HU RO RU
1940
–
1
944
Isced 0–2 25.5 61.8 43.8 61.6 65.5 51.5 80.3 83.2 47.1 30.5 21.3 42.9 72.4 29.3
Isced 3–4 47.8 14.9 29.0 23.5 17.1 34.9 14.9 9.1 34.8 38.0 57.4 44.7 22.6 24.8
Isced 5–6 26.7 23.2 27.2 14.9 17.4 13.6 4.7 7.6 18.1 31.5 21.3 12.4 4.9 45.9
1945
–
1
949
Isced 0–2 18.6 50.2 31.3 59.0 56.7 44.7 69.8 78.4 29.9 17.0 14.7 33.8 57.7 14.1
Isced 3–4 51.9 21.0 33.5 26.0 21.6 36.8 22.2 12.8 47.2 49.1 53.1 51.9 33.3 40.2
Isced 5–6 29.5 28.8 35.2 15.1 21.8 18.5 8.0 8.8 22.9 33.9 32.3 14.2 9.0 45.7
1950
–
1
955
Isced 0–2 15.3 39.2 23.5 45.3 47.8 39.1 56.3 71.2 24.7 11.3 9.5 27.8 50.7 8.2
Isced 3–4 46.9 25.3 30.6 34.5 26.4 37.3 31.6 18.6 48.9 48.6 65.1 56.1 41.5 41.8
Isced 5–6 37.8 35.5 45.9 20.2 25.8 23.6 12.1 10.2 26.4 40.1 25.4 16.1 7.8 50.0
1956
–
1
961
Isced 0–2 23.2 31.0 14.0 38.5 38.9 30.1 42.6 53.4 21.6 5.6 5.8 22.8 33.9 3.3
Isced 3–4 39.1 28.9 35.8 38.1 30.4 39.6 44.3 27.1 52.0 50.7 65.8 56.7 55.4 47.2
Isced 5–6 37.7 40.0 50.1 23.4 30.7 30.3 13.1 19.5 26.4 43.7 28.5 20.5 10.7 49.5
Source: GGS, Harmonised histories and SEE 2001 Belgian Census, Calculations by authors.
Selective entry into parenthood may bias progression ratios to second and third births as these increasingly reflect the fertility experience of a select group of women. To the extent that selection operates differently across educational groups, this may also affect educational differentials in parity progression. To control for this effect of selective entry into parenthood on second and third birth hazards, random-effects discrete-time hazard models (Wooldridge 2002) are estimated where birth intervals are nested in women and a random effect µj is included at the individual level (shared
frailty) to control for time-constant unobserved characteristics that affect birth hazards of women across spells or birth intervals (see equation 1). The individual-level random effect captures selectivity with respect to the transition to parenthood, as both the occurrence of a first birth as well as its timing determine the value for µj. An additional
⎩ ⎪ ⎪ ⎪ ⎪ ⎪ ⎪ ⎪ ⎪ ⎨ ⎪ ⎪ ⎪ ⎪ ⎪ ⎪ ⎪ ⎪
⎧𝑙𝑛[−𝑙𝑛(1− ℎ𝑡1)] = 𝛽0𝑗+ 𝛽𝑖𝐸𝑋𝑃𝑖 +𝛽𝑖𝐸𝑋𝑃𝑖2+� 𝛽𝑘𝑖𝐸𝐷𝑈𝑘𝑖+� 𝛽𝑗𝑖𝐶𝑂𝐻𝑗𝑖+� � 𝛽𝑘𝑗𝑖𝐸𝐷𝑈 ∗ 𝐶𝑂𝐻𝑘𝑗𝑖
4 𝑗=1 3 𝑘=1 4 𝑗=1 3 𝑘=1 +
� 𝛽𝑗𝑖𝐶𝑂𝐻𝑗𝑖∗ 𝐸𝑋𝑃+ � 𝛽𝑗𝑖𝐶𝑂𝐻𝑗𝑖∗ 𝐸𝑋𝑃2+ � 𝛽𝑗𝑖𝐸𝐷𝑈𝑗𝑖∗ 𝐸𝑋𝑃+ � 𝛽𝑗𝑖𝐸𝐷𝑈𝑗𝑖∗ 𝐸𝑋𝑃2+
3 𝑗=1 3 𝑗=1 4 𝑗=1 4 𝑗=1 � � 𝛽𝑘𝑗𝑖𝐸𝐷𝑈 ∗ 𝐶𝑂𝐻𝑘𝑗𝑖 4 𝑗=1 3 𝑘=1 ∗ 𝐸𝑋𝑃+ � � 𝛽𝑘𝑗𝑖𝐸𝐷𝑈 ∗ 𝐶𝑂𝐻𝑘𝑗𝑖 4 𝑗=1 3 𝑘=1
∗ 𝐸𝑋𝑃2+ 𝜇
𝑗
𝑙𝑛[−𝑙𝑛(1− ℎ𝑡2)]
𝑙𝑛[−𝑙𝑛(1− ℎ𝑡3)]
=
=
𝛽′0𝑗+ 𝛽′𝑖𝐸𝑋𝑃𝑖 +𝛽′𝑖𝐸𝑋𝑃𝑖2+� 𝛽′𝑘𝑖𝐸𝐷𝑈𝑘𝑖+� 𝛽′𝑗𝑖𝐶𝑂𝐻𝑗𝑖+� � 𝛽′𝑘𝑗𝑖𝐸𝐷𝑈 ∗ 𝐶𝑂𝐻𝑘𝑗𝑖+ 𝜇𝑗
4 𝑗=1 3 𝑘=1 4 𝑗=1 3 𝑘=1
𝛽"0𝑗+𝛽"𝑖𝐸𝑋𝑃𝑖 +𝛽"𝑖𝐸𝑋𝑃𝑖2+� 𝛽"𝑘𝑖𝐸𝐷𝑈𝑘𝑖+� 𝛽"𝑗𝑖𝐶𝑂𝐻𝑗𝑖+� � 𝛽"𝑘𝑗𝑖𝐸𝐷𝑈 ∗ 𝐶𝑂𝐻𝑘𝑗𝑖 4 𝑗=1 3 𝑘=1 4 𝑗=1 3 𝑘=1 + 𝜇𝑗 (1)
The model considers entry into parenthood and progression to second and third births. For the first birth interval, duration in years elapsed since age 15 is used as the exposure dimension in the analysis. For the analysis of second and third births hazards the duration in years since the previous birth is used. A quadratic baseline hazard function is included for all three birth intervals, meaning that birth hazards increase at earlier ages and/or durations and decrease at higher exposures. Further covariates included in the analysis are level of education (three levels with low as a reference) and cohort (four cohorts with the 1940–44 cohort as a reference). The effect of education is allowed to vary across cohorts.
The relation between education and first birth hazards typically depends on which part of the reproductive lifespan is considered, since education-specific fertility schedules intersect. For first births the model includes two-way interactions between the quadratic baseline function on the one hand and educational levels and cohort on the other. Also, the three-way interaction between the quadratic baseline function, education, and cohort is included. As a result of the education*baseline, cohort*baseline, and education*cohort*baseline interactions the parameter estimates for education merely reflect educational differentials in first-birth hazards in the youngest age group and provide little information on educational differentials in final intensities under the model. For second and third order births the effect of exposure since previous birth is assumed not to vary across birth cohorts or educational levels, which allows us to interpret the parameter estimates for education as educational differentials in final intensities. Additional sensitivity models16 – including the interaction between the quadratic baseline function, education, and cohort – do not yield substantially different results for second and third births.
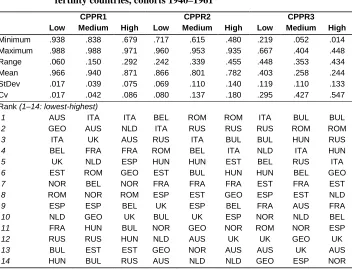
Using the estimated hazards for each country, the proportions of women entering parenthood (CPPR1) and cohort parity progression ratios (CPPR2 and CPPR3) were
calculated by cohort and level of education. The use of regression-based CPPRs has several advantages. First, the regression-based approach provides more stable estimates of education-specific parity progression rates compared to CPPRs calculated directly from the survey data, which are subject to considerable sampling variation. Second, the results from the hazard models provide additional information on the statistical significance of educational gradients in order-specific birth hazards over subsequent cohorts in each of the countries considered. Finally, the regression-based CPPR control for differential selection in terms of time-constant unobserved characteristics.
4. Results
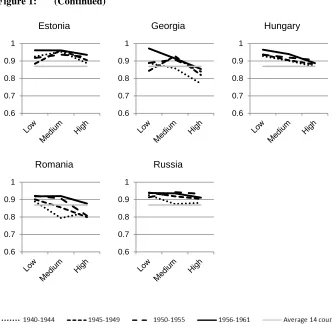
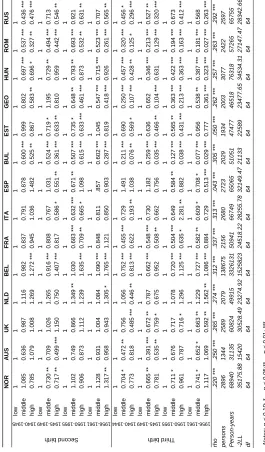
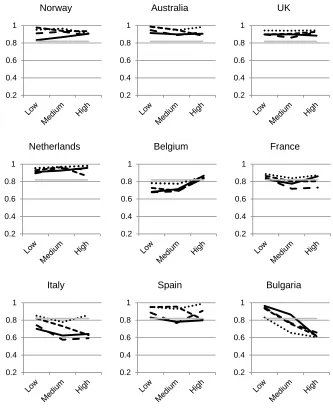
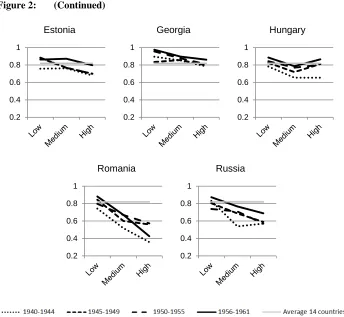
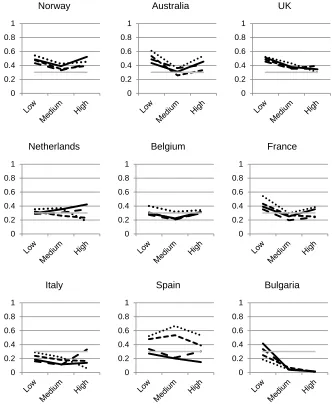
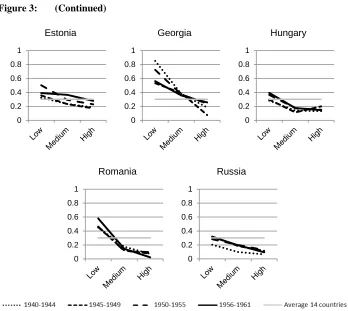
Figure 1 illustrates the estimated proportions of women entering parenthood (CPPR1) by cohort and educational level in each of the 14 low-fertility countries considered. Whereas increasing and decreasing lines represent positive and negative educational gradients respectively, horizontal lines indicate the absence of educational differences. U-shaped and inverse U-shaped patterns are also illustrated by corresponding lines. By comparing dotted, dashed, and solid lines we can investigate whether educational gradients have changed over subsequent birth cohorts. The figure also includes the average estimated progression to motherhood across all countries and cohorts (CPPR1=0.869)17. Figure 2 shows the estimated CPPR2 from the shared frailty models by cohort and level of education and also includes the average shared-frailty estimated CPPR2 across all countries and cohorts17 (CPPR2= 0.820). For third births Figure 3 illustrates the estimated CPPR3 from the shared-frailty models and the corresponding average17 (CPPR3=0.302). Parameter estimates of the shared-frailty model for second and third births are provided in Table 2.
Table 2 shows that for all European countries in this study a significant fraction of the variance in birth hazards is due to the unobserved women-specific heterogeneity component (rho). An investigation of the random disturbance18 showed that women who progressed to motherhood later show lower values, as do women who never progressed to motherhood. The comparison of estimated and shared-frailty estimated CPPRs shows that the joint modelling of first, second and third birth hazards entails lower CPPR3 and also lower CPPR2 for some groups. However the woman-specific characteristics connected to timing of and entry to motherhood have little impact on the educational gradient in progression to second and third births (see Tables A1–A3 in appendix). Hence, our results indicate that selection in terms of timing and occurrence
17 Averages are computed as unweighted mean progression ratios across all educational groups in all cohorts
(1940–1961) in all 14 countries studied in this paper.
of first births does not affect the educational patterns in progression to second and third births.
4.1 Transition to parenthood
In general, the CPPR1 for low- and middle-educated women in Norway is higher than the average CPPR1 found across countries. A weak negative educational gradient appears in Norway with respect to entry into parenthood. Since the inclusion of interactions between education and cohort do not significantly improve the model (∆-2LL = 19.03, ∆df = 18, p = .390), this educational gradient does not vary significantly across cohorts. Compared to low-educated women, middle-educated women display lower progression in some cohorts, but predominantly the proportion of highly educated women making the transition to parenthood is up to 13 percentage points lower.
In Australia most cohorts show lower than average progression to motherhood among middle- and highly educated women, whereas progression for low-educated women lies around the average CPPR1 found across countries. Even in the cohort born in 1956–1961, the proportion of highly educated women having a first child is 16 percentage points lower than among low-educated women. Among middle-educated women, the CPPR1 depends strongly on the cohort considered. Although the negative educational gradient seems to intensify for younger cohorts, a likelihood ratio test for the interaction between cohort and education suggests that the educational gradient does not change significantly across cohorts (∆-2LL = 21.12, ∆df = 18, p = .273).
The UK is equally characterised by a negative educational gradient for entry into parenthood. The proportion of low-educated women having a first child in the UK is higher than the average across countries and their CPPR1 has increased in recent cohorts. For middle-educated women substantial variation in the CPPR1 is found across cohorts. Although the proportion of women having a first child was somewhat higher in the 1945–49 cohort, the CPPR1 for the most recent cohort of women born in 1956– 1961 is again similar to that of women born in 1940–1944. As a result of increasing CPPR1 for low educated women, substantial variation for middle educated women, and a decline in CPPR1 for highly educated women the educational gradient in CPPR1 has changed significantly (∆-2LL = 30.86, ∆df = 18, p = .030) over subsequent birth cohorts. The lowest proportion of women having a first child is found among the highly educated: the CPPR1 for this group is lower than the average CPPR1 across countries, with little variation over subsequent birth cohorts.
(∆-2LL= 20.46, ∆df= 18, p = .308). Compared to the level found across countries, the CPPR1 for low-educated women is consistently higher than average, around average for middle-educated women, and particularly low for highly educated Dutch women.
From an international perspective, the negative educational gradient for entry into parenthood in Belgium is weak, particularly in the most recent cohort, as the CPPR1 declined among low-educated women (Neels and De Wachter 2010). Given the sample size of the 2001 census data, the weakening of the negative educational gradient across subsequent birth cohorts is significant (∆-2LL = 142.74, ∆df = 18, p = .000).
Also in France, low-educated women show higher than average progression to motherhood compared to the average CPPR1 found across countries, whereas middle- and particularly highly educated women remain childless more often. Despite the fact that the 1950–55 cohort seems to display the strongest negative educational gradient in first birth progression, a likelihood ratio test shows no significant cohort*education ( ∆-2LL = 21.49, ∆df = 18, p = .256).
From a comparative perspective, progression to motherhood in Italy is characterized by a particularly articulated negative educational gradient. Whereas the CPPR1 of low-educated women equals the average CPPR1 found across countries, the CPPR1 is much lower for middle-educated and particularly highly educated women. The difference in CPPR1 between low- and highly educated women ranges from 15 to
25 percentage points. A likelihood ratio test of the cohort*education interaction indicates that only the 1950–55 cohort – having a negative educational gradient that is somewhat less articulated – deviates significantly from the overall pattern (∆-2LL = 31.16, ∆df = 18, p = .028).
For Spain, progression to motherhood among low- and middle-educated women is higher than the CPPR1 found across countries, while childlessness is more frequent than average among highly educated women in all considered cohorts. In general the difference in progression between low- and middle-educated women is limited, while the percentage of highly educated women entering parenthood is up to 15 percentage points lower. A likelihood ratio test of the cohort*education interaction indicates that the educational gradient does not change significantly over subsequent birth cohorts ( ∆-2LL = 23.02, ∆df = 18, p = .190).
In Bulgaria the progression to parenthood is more frequent among low- and middle-educated women compared to the average CPPR1 found across countries, while being lower than average for highly educated women born before 1950. For highly educated women the CPPR1 has increased for women born after 1949, which has entailed a significant weakening of the negative educational gradient (∆-2LL = 45.82, ∆df = 18, p: .000).
more neutral relation between education and motherhood in younger cohorts. Over subsequent birth cohorts the CPPR1 for middle-educated women has remained similar, while progression to parenthood has increased among low- and highly educated women. Depending on the cohort considered, the results for Georgia show a negative educational gradient (cohorts 1940–1944, 1956–1961) or an inverse U-shaped pattern (1945–1949, 1950–1955). A likelihood ratio test for the cohort*education interaction indicates that the educational gradient has not changed significantly across birth cohorts (∆-2LL = 23.16, ∆df = 18, p = .185).
The transition to parenthood in Hungary is characterised by a negative educational gradient, regardless of the cohort considered. In all cohorts the CPPR1 for low- and middle-educated women is consistently higher than the average found across countries. For highly educated women the CPPR1 is close to the average found across countries, resulting in a negative educational gradient. A likelihood ratio test for cohort*education interaction shows that the educational gradient has not changed significantly across cohorts (∆-2LL = 18.59, ∆df = 18, p = .417).
In Romania transition to parenthood among low-educated women is more frequent in all cohorts than the average CPPR1 found across countries, while CPPR1 is lower for middle- and highly educated women. Similar to other CEE countries, Romania seems to have witnessed an increase in the proportion of women having a first child over subsequent cohorts. Although the rise was most pronounced for middle-educated women and least pronounced for low-educated women, this has not resulted in a significant change in the educational gradient across birth cohorts (∆-2LL = 19.68, ∆df = 18, p = .351).
Finally, in line with other CEE countries, Russia has witnessed an increase of CPPR1 over subsequent birth cohorts. The educational gradient of entry into parenthood is weakly negative to neutral and has not changed significantly across birth cohorts (∆-2LL = 21.46, ∆df = 18, p = .257).
4.2 Second births
The changes in the relation between education and second births over cohorts were found to be significant (∆-2LL = 16.35, ∆df = 6, p = .012).
Similarly to the UK and the Netherlands, all educational groups in all cohorts in Australia show higher than average CPPR2. Although all educational groups have witnessed a limited decline in CPPR2 over subsequent birth cohorts, the onset of the decline differs between the educational groups. In the two youngest birth cohorts a neutral educational gradient in second births is found. Results show that the changes in the relation between education and second births across cohorts are not significant ( ∆-2LL = 7.84, ∆df = 6, p: .250).
The UK is characterised by a neutral education gradient in progression to second births. No significant relation between educational level and second birth hazards is found for any cohort considered and no significant changes are found across cohorts ( ∆-2LL = 3.49, ∆df = 6, p = .746).
In the Netherlands the birth cohorts 1950–1955 and 1956–1961 show a positive educational gradient in progression to a second child. Changes in the educational gradient across cohorts are limited and the inclusion of an interaction between cohort and education does not significantly improve the model fit (∆-2LL = 7.32, ∆df = 6, p = .292).
In Belgium progression to a second birth is characterised by a positive educational gradient, with parity progression being particularly high among highly educated women. This positive effect of education has become stronger in younger cohorts, with the odds of a second birth increasing by more than 63 per cent for highly educated women born between 1950-1961. A likelihood ratio test indicates that the trend towards an increasingly articulated positive educational gradient in younger cohorts is statistically significant (∆-2LL = 132.21, ∆df = 6, p = .000).
In France CPPR2 seems to be slightly lower among middle-educated women. This negative effect is only significant for the 1950–55 birth cohort due to a temporary decline in second births among middle- and highly educated women. All other birth cohorts are characterized by a neutral educational gradient. A likelihood ratio test shows that there is no significant change in the effects of education over birth cohorts (∆-2LL = 4.28, ∆df = 6, p = .639).
Similar to Italy, Spain also shows lower CPPR2 for younger birth cohorts regardless of the educational group considered. However, due to the fact that this decline did not occur at the same time across the educational groups, the educational effects change significantly over birth cohorts (∆-2LL = 11.77, ∆df = 6, p = .067). The strongest drop in CPPR2 for highly educated women occurred in the 1945–49 birth cohorts – while other educational groups did not experience such a decline – resulting in a negative educational gradient in recent birth cohorts. A similar drop in CPPR2 for middle educated women occurred in the 1950-1955 birth cohort, entailing a U-shaped educational pattern in CPPR2.
In contrast to findings for other European countries, the results for CEE countries generally show negative educational gradients for the progression to a second child.
In Bulgaria a strong negative educational gradient is found for CPPR2, which does not change significantly over subsequent birth cohorts (∆-2LL = 7.41, ∆df = 6, p = .284).
Estonia is characterized by rises in CPPR2 at different times for different educational groups. From the 1945 birth cohort on, low-educated women display higher CPPR2 compared to older cohorts. A rise in CPPR2 of a similar magnitude occurred also for middle- and highly educated women, though this occurred for the 1956–61 cohort. These differences in the onset of changes in CPPR2 have resulted in a negative gradient in the 1945–55 cohorts and a neutral gradient in the oldest and youngest cohorts. A likelihood ratio test indicates, however, that changes in the educational gradient of progression to a second child over subsequent birth cohorts are not significant (∆-2LL = 4.37, ∆df = 6, p = .627).
The educational gradient in Georgia is negative for younger birth cohorts due to a rise in CPPR2 for low-educated women compared to the oldest cohorts considered. Hence the negative educational gradient is strongest in the younger birth cohorts. The results of a likelihood ratio test indicate, however, that changes in the educational gradient over subsequent birth cohorts are not significant (∆-2LL = 6.71, ∆df = 6, p: .348).
In Hungary CPPR2 increased strongly among highly educated women. Although Hungary seems to have evolved from a negative to a U-shaped educational gradient in progression to second births, this change is not significant, suggesting a neutral educational gradient (∆-2LL = 2.57, ∆df = 6, p = .861).
Results for Romania indicate a strong negative educational gradient in CPPR2, which has not changed significantly over subsequent birth cohorts (∆-2LL = 7.92, ∆df = 6, p = .244).
gradient in progression to second births is negative, however, and has been stable across cohorts (∆-2LL = 6.95, ∆df = 6, p = .325).
4.3 Third births
Progression ratios to a third birth in Norway are higher for all educational levels and birth cohorts than the average CPPR3 found across countries and cohorts. The educational gradient shows a U-shaped pattern with CPPR3 being significantly lower among middle-educated women compared to low- and highly educated women. This U-shaped gradient has not changed significantly across birth cohorts (∆-2LL = 3.07, ∆df = 6, p = .800).
Also in Australia the educational gradient of cohort parity progression ratios to a third birth shows a U-shaped pattern, which has not changed significantly across birth cohorts (∆-2LL = 5.14, ∆df = 6, p = .526).
In the UK, progression to a third birth is higher in most cohorts and educational groups than the average CPPR3 found across countries. In all cohorts considered a negative educational gradient emerges for progression to third births, which has not changed significantly across birth cohorts (Δ-2LL = 4.22, Δdf = 6, p = .646).
In the Netherlands a negative educational gradient for third births emerges in the earliest cohort considered. However, due to a rise in CPPR3 for highly educated women the educational gradient has changed significantly across cohorts (Δ-2LL = 12.52, Δdf = 6, p = .051), resulting in a positive educational gradient in the 1956–61 birth cohort.
In Belgium progression to a third birth is characterized by a negative educational gradient in the cohort born in 1940–1944. The educational gradient changed significantly over subsequent birth cohorts (∆-2LL = 69.61, ∆df = 6, p = .000), resulting in a U-shaped gradient among women born after 1945 similar to the educational gradient observed in Norway and Australia.
In Francea U-shaped educational gradient in CPPR3 is also found. For all birth cohorts middle-educated women show lower progression to third births. This U-shaped gradient is stable across birth cohorts (∆-2LL = 3.16, ∆df = 6, p = .789).
In Italy progression to third births has declined among low- and middle-educated women, whereas highly educated women have witnessed more variation. As a result, the educational gradient of CPPR3 is also subject to variation over subsequent birth cohorts, ranging from a negative gradient in the 1940–44 cohort to a positive gradient in the 1950–55 cohort. A Likelihood ratio test indicates that this variation for highly educated women is significant (∆-2LL = 12.65, ∆df = 6, p = .049).
significant educational gradient is found in third birth hazards, although a negative educational gradient seems to emerge in the most recent cohorts as a result of the more substantial decline of CPPR3 among highly educated women. Likelihood ratio tests indicate that the change of the educational gradient across birth cohorts is significant (∆-2LL = 11.78, ∆df = 6, p = .067).
In contrast to the neutral and U-shaped educational gradients found in other countries, most CEE countries are characterised by a negative educational gradient in progression to third births, in line with the negative parity progression ratios to second births found in CEE countries. However, the educational gradient varies strongly across countries within the CEE region.
Bulgaria is characterized by low CPPR3 for middle- and highly educated women in all cohorts, resulting in an articulated negative educational gradient that has not changed significantly over subsequent birth cohorts (∆-2LL = 9.57, ∆df = 6, p = .144).
Compared to other CEE countries, the negative educational gradient is relatively weak in Estonia, with CPPR3 being significantly lower among highly educated women. The negative educational gradient has not changed significantly across birth cohorts ( ∆-2LL = 2.24, ∆df = 6, p = .896).
Georgia is characterized by a strong negative educational gradient, which has changed significantly across cohorts (∆-2LL = 21.62, ∆df = 6, p = .001). The educational gradient is weakest in the most recent cohort.
Hungary shows lower than average CPPR3 for middle- and highly educated women, regardless of the cohort considered. The negative effect of education does not change significantly across cohorts (∆-2LL = 4.62, ∆df = 6, p = .594).
The educational gradient in third births in Romania is strongly negative with the CPPR3 for middle- and highly educated women being well below the average CPPR3 found across countries. The educational gradient has not changed significantly across birth cohorts (∆-2LL = 5.53, ∆df = 6, p = .477).
Figure 1: Estimated cohort parity progression ratio to first birth (CPPR1) for female cohorts (1940-1944, 1945-1949, 1950-1955, 1956-1961) by educational level in 14 low-fertility countries
0.6 0.7 0.8 0.9 1
Norway
0.6 0.7 0.8 0.9 1
Australia
0.6 0.7 0.8 0.9 1
UK
0.6 0.7 0.8 0.9 1
Netherlands
0.6 0.7 0.8 0.9 1
Belgium
0.6 0.7 0.8 0.9 1
France
0.6 0.7 0.8 0.9 1
Italy
0.6 0.7 0.8 0.9 1
Spain
0.6 0.7 0.8 0.9 1
Figure 1: (Continued)
Source: GGS, Harmonised histories and SEE 2001 Belgian Census, Calculations by authors.
0.6 0.7 0.8 0.9 1
Estonia
0.6 0.7 0.8 0.9 1
Georgia
0.6 0.7 0.8 0.9 1
Hungary
0.6 0.7 0.8 0.9 1
Romania
0.6 0.7 0.8 0.9 1
NO R AU S UK NL D B EL F RA IT A ESP BUL EST G EO HUN RO M RUS Sec ond birt h 1940-1945 lo w 1 1 1 1 1 1 1 1 1 1 1 1 1 1 m iddl e 1. 085 0. 636 0. 987 1. 116 0. 982 0. 837 0. 791 0. 878 0. 600 * ** 0. 999 0. 802 0. 697 *** 0. 537 * ** 0. 436 * ** hi gh 0. 785 1. 079 1. 008 1. 269 1. 272 * ** 0. 945 1. 036 1. 482 0. 525 * * 0. 867 0. 583 * * 0. 696 * 0. 327 * * 0. 476 * ** 1945-1949 lo w 1 1 1 1 1 1 1 1 1 1 1 1 1 1 m iddl e 0. 730 * * 0. 709 1. 026 1. 265 0. 916 * ** 0. 808 0. 767 1. 031 0. 524 * ** 0. 719 * 1. 195 0. 729 * * 0. 494 * ** 0. 713 hi gh 0. 717 * * 0. 499 * ** 1. 150 0. 750 1. 407 * ** 0. 817 0. 586 * 0. 551 * * 0. 361 * ** 0. 633 * * 0. 810 0. 959 0. 442 * ** 0. 546 * * 1950-1955 lo w 1 1 1 1 1 1 1 1 1 1 1 1 1 1 m iddl e 1. 102 0. 749 0. 866 1. 349 * * 1. 030 0. 68 3 *** 0. 632 * ** 0. 671 * * 0. 507 * ** 0. 735 * 0. 648 * * 0. 793 * * 0. 693 * ** 0. 921 hi gh 0. 906 0. 873 1. 112 1. 239 1. 635 * ** 0. 709 * * 0. 665 * 1. 098 0. 615 * ** 0. 633 * ** 0. 461 * ** 0. 873 0. 532 * * 0. 631 * * 1956-1961 lo w 1 1 1 1 1 1 1 1 1 1 1 1 1 1 m iddl e 1. 128 0. 931 1. 004 1. 084 1. 090 * ** 0. 848 0. 811 .857 0. 602 * ** 1. 045 0. 547 * ** 0. 715 * ** 0. 523 * ** 0. 707 hi gh 1. 317 * * 0. 958 0. 943 1. 305 * 1. 765 * ** 1. 121 0. 850 0. 903 0. 287 * ** 0. 819 0. 418 * ** 0. 926 0. 261 * ** 0. 565 * * Thi rd bi rth 1940-1944 lo w 1 1 1 1 1 1 1 1 1 1 1 1 1 1 m iddl e 0. 704 * 0. 472 * * 0. 756 1. 056 0. 752 * ** 0. 455 * ** 0. 729 1. 491 0. 211 * ** 0. 690 0. 250 * ** 0. 457 * ** 0. 320 * ** 0. 456 * hi gh 0. 773 0. 818 0. 485 * ** 0. 446 * * 0. 813 * ** 0. 622 0. 193 * * 1. 038 0. 076 * * 0. 569 * 0. 107 * ** 0. 428 * * 0. 125 * 0. 296 * ** 1945-1949 lo w 1 1 1 1 1 1 1 1 1 1 1 1 1 1 m iddl e 0. 665 * * 0. 391 * ** 0. 672 * * 0. 787 0. 662 * ** 0. 548 * ** 0. 730 1. 182 0. 259 * ** 0. 636 0. 652 0. 346 * ** 0. 213 * ** 0. 527 * * hi gh 0. 781 0. 535 * * 0. 759 * 0. 675 0. 952 0. 508 * * 0. 662 0. 756 0. 035 * ** 0. 466 * * 0. 104 * ** 0. 631 0. 129 * ** 0. 320 * ** 1950-1955 lo w 1 1 1 1 1 1 1 1 1 1 1 1 1 1 m iddl e 0. 711 * 0. 676 0. 717 1. 078 0. 720 * ** 0. 504 * ** 0. 649 0. 584 * * 0. 127 * ** 0. 565 * * 0. 363 * ** 0. 422 * ** 0. 194 * ** 0. 673 hi gh 0. 961 0. 787 0. 716 * 1. 296 1. 125 *** 0. 635 * 2. 281 * * 0. 882 0. 038 * ** 0. 431 * ** 0. 213 * ** 0. 363 * ** 0. 163 * ** 0. 412 * ** 1956-1961 lo w 1 1 1 1 1 1 1 1 1 1 1 1 1 1 m iddl e 0. 741 * 0. 652 * 0. 663 * * 1. 229 0. 727 * ** 0. 582 * * 0. 609 * 0. 708 * 0. 077 * ** 0. 956 0. 538 * * 0. 387 * ** 0. 181 * ** 0 .5 68 hi gh 1. 117 1. 069 0. 592 * * 1. 562 * * 1. 086 * ** 0. 884 0. 729 0. 513 * ** 0. 029 * ** 0. 777 0. 361 * ** 0. 323 * ** 0. 027 * ** 0. 263 * ** .220 * ** .250 * ** .265 * ** .274 * ** .312 * ** .337 * ** .313 * ** .043 * ** .305 * ** .050 * ** .262 * ** .257 * ** .263 * ** .292 *** s ons 2896 1344 2589 2079 138675 2156 2680 2723 2029 1934 2003 3077 2422 2597 s on -y e ar s 68940 31135 60824 49915 3326131 50941 66749 65065 51051 47477 46518 76318 57265 65755 35175. 88 15420 30528. 49 23274. 92 1525823 24518. 22 28255. 78 32149. 47 21133 22589 23477. 65 34534. 31 27147. 47 28342. 66 64 64 64 64 64 64 64 64 64 64 64 64 64 64 ot es
: p <
0. 10 : * p < 0. 0 5: ** p < 0. 01: * ** our c e : G G S , H ar m oni z ed hi s tor ies a nd S E E 2001 B e lg ian C ens us ( C a lc u lat ions by au thor s ).
Table 2: Shared-frailty estimates of the educational gradient in progression to
Figure 2: Shared frailty estimates of cohort parity progression ratios to 2nd birth (CPPR2) for female cohorts (1940-1944, 1945-1949, 1950-1955, 1956-1961) by educational level in 14 low-fertility countries
0.2 0.4 0.6 0.8 1
Norway
0.2 0.4 0.6 0.8 1
Australia
0.2 0.4 0.6 0.8 1
UK
0.2 0.4 0.6 0.8 1
Netherlands
0.2 0.4 0.6 0.8 1
Belgium
0.2 0.4 0.6 0.8 1
France
0.2 0.4 0.6 0.8 1
Italy
0.2 0.4 0.6 0.8 1
Spain
0.2 0.4 0.6 0.8 1
Figure 2: (Continued)
Source: GGS, Harmonised histories and SEE 2001 Belgian Census, Calculations by authors.
0.2 0.4 0.6 0.8 1
Estonia
0.2 0.4 0.6 0.8 1
Georgia
0.2 0.4 0.6 0.8 1
Hungary
0.2 0.4 0.6 0.8 1
Romania
0.2 0.4 0.6 0.8 1
Figure 3: Shared frailty estimates of cohort parity progression ratios to 3rd birth (CPPR3) for female cohorts (1940-1944, 1945-1949, 1950-1955, 1956-1961) by educational level in 14 low-fertility countries
0 0.2 0.4 0.6 0.8 1
Norway
0 0.2 0.4 0.6 0.8 1
Australia
0 0.2 0.4 0.6 0.8 1
UK
0 0.2 0.4 0.6 0.8 1
Netherlands
0 0.2 0.4 0.6 0.8 1
Belgium
0 0.2 0.4 0.6 0.8 1
France
0 0.2 0.4 0.6 0.8 1
Italy
0 0.2 0.4 0.6 0.8 1
Spain
0 0.2 0.4 0.6 0.8 1
Figure 3: (Continued)
Source: GGS, Harmonised histories and SEE 2001 Belgian Census, Calculations by authors.
5. Conclusions
Despite the number of studies investigating the relation between education and fertility, knowledge of the relation between education and cohort parity progression ratios in low-fertility countries remains limited. This article assesses educational gradients in the progression to first, second, and third births, focusing on differences across countries as well as changes over time.
The results presented in this paper show that highly educated women in general are less likely to enter motherhood than low- and middle-educated women, which may suggest that the negative effects of opportunity costs outweigh positive income effects
0 0.2 0.4 0.6 0.8 1
Estonia
0 0.2 0.4 0.6 0.8 1
Georgia
0 0.2 0.4 0.6 0.8 1
Hungary
0 0.2 0.4 0.6 0.8 1
Romania
0 0.2 0.4 0.6 0.8 1