THE EFFECT OF SEED RATE ON THE YIELD
OF POTATOES
BY D. A. BOYD AND W. J. LESSELLS
Rothamsted Experimental Station, Harpenden, Hertfordshire
(With Eight Text-figures)
The work on which this paper is based forms part of a larger investigation on the potato crop, of which the main item has been a detailed survey in England and Wales, in the course of which both crop yields and information on the practices of growers have been obtained. Some results of the survey, which was a co-operative project between officers of the N.A.A.S. and the Department of Statistics at Rothamsted, have already been pub-lished (Boyd & Dyke, 1950), and a further paper in which the Ministry of Agriculture's estimates of yield are compared with the yield estimates from the survey for the years 1948-50, will be published shortly (Dyke & Avis, 1953). In addition, it is pro-posed to examine in detail certain aspects of potato growing, on which information has been thrown up as a result of the survey, using at the same time such experimental material as is available. In the present paper the effect on yield of variations in seed rate is discussed.
The survey data has shown that each year well over half the acreage of maincrop potatoes in England and Wales is planted with certified seed largely of Scotch or Irish origin. In some of the main potato-growing districts certified seed is planted on more than three-quarters of the acreage, indicating that a majority of the growers in those districts purchase afresh each year. The cost of seed is therefore one of the largest single items in their annual outgoings. Since the production and distribution of healthy seed is expensive of land, labour and transport, it is important from the national point of view, as well as for the individual grower, that the available seed should be used to the best advantage.
There are two main ways in which certified seed may be vised more efficiently. A grower in any given district needs to know how frequently he should buy fresh certified seed; he also needs to know what, for given prices of seed and of the resulting crop, is the most profitable amount of seed to plant per acre. On the first point, much research has already been done on virus spread in the potato crop, notably by Doncaster & Gregory (1948), who make some practical recommendations for prolonging the life of seed stocks in
ware-growing districts. Considerably more work will be required, however, before the grower can be advised with reasonable certainty; meanwhile, the many growers who incur the expense of fresh certified seed each year are discarding what may be perfectly vigorous stocks.
In the present paper an attempt has been made to summarize the available evidence on the second aspect of the problem, the extent to which by modifying growers' present practice it might be possible to increase yields or decrease seed require-ments. For this purpose it is necessary to know both how weight of seed planted affects yield and what amounts of seed are normally planted.
SEED RATES USED BY GROWERS From the maincrop-potato survey a substantial amount of information is available on the amounts of seed planted by growers, as well as other husbandry factors, for about half the counties of England and two Welsh counties in the years 1948-50.
About 60 % of the maincrop-potato acreage was planted with certified seed, almost all imported from Scotland or Ireland, 40-45% being class 'A' whilst classes ' H ' and 'S.S.' were each about 8-10 %. In the principal potato-growing areas there were very few instances of ' twice-grown' seed, and taking England and Wales as a whole the proportion of such seed is negligible.
Table 1 shows that the average rate of planting for certified seed is about 2 or 3 cwt. higher than once-grown.
Table 1. Certified and once-grown seed planted in England and Wales (1950)
Certified Scotch Certified Irish Once-grown Other
All tvnes
Estimated % of acreage
46 10 38 6 100
Estimated seed rate (cwt. per acre)
191
18-2 16-8
—
1 8 1
466
difference in mean seed-rate between certified and once-grown seed is found within each region (Table 2); only the north-west Midland counties fail to show a higher seed rate for certified seed.
Irrespective of differences in seed rate due to source of seed, there are considerable differences in weight planted between one district or county and another, and from farm to farm within a district. Table 2 shows that the highest seed rates occur in the Fens, where, on the average, more than a ton
on the same lines as Table 2; the three main potato-growing counties in the table—the Isle of Ely, Lindsey and the West Riding—all have mean seed rates of over 1 ton per acre. The relatively low figure for east Shropshire confirms the low value for the west and north-west Midlands in Table 2. In most of the other counties shown in Table 3 the mean seed rate is of the order of 17-18 cwt. per acre, but there appear to be considerably lower seed rates in parts of Devonshire.
Table 2. Regional differences in seed rate (1950)
% acreage Mean seed rate (cwt. per acre)
2. 3.
4. 5.
6. 7.
Region Northern uplands Northern lowlands
East and east-Midland counties (except Fens)
Fens
South-east, south and south-west England
Wales
West and north-west Midlands
Table 3. Mean seed rates
planted with certified seed
44 49 66
70
67
44 80
Certified 16-2 19-7 18-7
21-5 18-8
18-6 1 6 1
in various districts in 1951
(Survey of Fertilizer Practice data.)
Main ware-producing counties Isle of Ely (peat and silt
farms only)
West Riding (Vale of York) Lindsey
East Shropshire
North-west Essex Lancashire (Fylde) Other counties
Northampton
Year
1951 1952 1951 1952 1951 1952 1952 1952
1951 North-west Dorset 1951 and 1952 Mid Devon
South Devon Northumberland Cardigan Anglesey
1951 1952 1952 1951 1952
No. of fields
67 91 55 85 45 20 32 20
25 18 18 19 25 22 18
Once-grown 14-6 17-6 16-5
19-4 16-7
15-6 16-9
and 1952
Cwt. planted per acre
21-7 20-4 22-3 2 1 0 17-7 17-9 17-5 19-8
16-8 17-4 12-3 14-6 18-5 16-6 17-5
per acre is planted. Seed rates are also relatively high in the main potato-growing areas of Yorkshire and west Lincolnshire. The west and north-west Midlands, however, have relatively low seed rates, and the same is true for the upland areas of the north of England.
A supplementary question asked in the course of the survey of fertilizer practice also provides infor-mation on planting rates in a number of counties or districts in England and Wales in 1951 and 1952. The mean seed rates in the surveyed counties or districts are presented in Table 3, excluding only those counties for which the number of potato fields surveyed was less than 15. The results are broadly
Whilst there are general tendencies for some districts to plant more than others, there is within each district a wide variation in seed rates from farm to farm. Taking all districts together, both surveys show a range of from 5 to over 30 cwt. per acre. Only about 5 % of the fields, however, were planted at rates of less than 10 or more than 25 cwt. per acre, and half lie in the range 15-20 cwt.
whereas, in the west Midlands, Majestic accounts for only a quarter of the acreage and the two red varieties for a third. The table shows that, in the country as a whole, the mean seed rate is about 1J cwt. higher for Majestic than for the red varie-ties. The seed rate of most varieties tend to be somewhat lower in the north-west and west Mid-lands, and this is most marked for the red varieties, which are lower by 2-2J cwt. than in England and Wales as a whole.
was relatively large (2£-2| oz.) in most counties, but only about 2£ oz. in the west Midlands, Wales and the northern uplands. The size of once-grown seed was much more uniform from region to region at about 2J oz.
Generally speaking the regional differences in the rate of planting of certified seed were determined by variations in the set size, while the once-grown seed rate was determined by variations in spacing within and between the rows. The high rate of
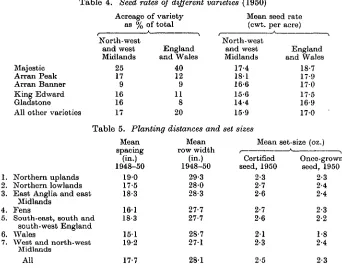
Table 4. Seed rates of different varieties (1950)
1. 2. 3. 4. 5.
6.
7.
Majestic Arran Peak Arran Banner King Edward Gladstone All other varieties
Acreage
a s %
North-west and west Midlands
25 17
9
16 16 17
of variety of total
England and Wales
40 12 9 11 8 20
Table 5. Planting distances and
Northern uplands Northern lowlands East Anglia and east
Midlands Fens
South-east, south and south-west England Wales
West and north-west Midlands
Mean spacing
(in.) 1948-50
1 9 0
17-5
18-3
161 18-3
1 5 1
19-2
Mean row width
(in.) 1948-50
29-3 28-0 28-3
27-7 27-7
28-7
2 7 1
Mean seed rate (cwt. per
North-west and west Midlands
17-4
1 8 1
16-6 15-6 14-4 15-9
set sizes
acre)
England and Wales
18-7 17-9
1 7 0
17-5 16-9 17-0
Mean set-size (oz.)
Certified seed, 1950
2-3 2-7 2-6 2-7 2-6 2 1 2-3
Once-grown seed, 1950
2-3 2-4 2-4 2-3 2-2 1-8 2-4
All 17-7 28-1 2-5 2-3
It might be wondered how far these regional differences in rate of planting are due to variations in the size of seed planted and how far to differences in spacing between tubers and between rows. No direct information on seed size is available from the survey, but when the sample liftings for determina-tion of yield were made the row width and spacing between plants at harvest were both measured. Since the mean weight planted per acre is also known, it is possible to estimate the average weight of set planted, allowing an arbitrary figure of 5 % for blanks at harvest. The data are summarized in Table 5.
The overall mean spacing between plants in the row was 17 J—18 in. in each year of the survey, the values for each region varying between 15 and 19 in. Row width averaged 28 in., the regional means varying from 27 to 30 in. The estimated mean weight per tuber in 1950 varied from If to 2J oz. with an overall mean of 2J—2£ oz. Certified seed
planting of certified seed in the Fens was partly due to relatively close spacing within and between the rows, but mainly to planting relatively large sets. In the west and north-west Midlands, and in the northern uplands, which have relatively low seed rates, the mean spacing in the row (19 in.) was relatively large, but again the main reason for the low certified seed rates was the planting of smaller sets. As might be expected in a region where much of the seed planted was home produced, the average set size in Wales was well below the average for both certified and once-grown seed; the average spacing between sets was, however, unusually close.
THE EFFECT OF SEED RATE ON YIELD (a) Description of experiments
rows. Row width is to a large extent fixed by the wheel spacing of tractors and implements, and practically no experiments have been undertaken on the effects of variations in row width on yield. The other two factors are to a greater or lesser extent capable of being controlled by the grower, although the frequency with which complaints are heard from growers indicates that their power to control set size is limited.
Over the past twenty years there have been some half a dozen papers describing investigations on seed rate of potatoes in this country, in addition to a number of results given in college and station reports. Apart from passing references to previous papers, however, there appears to have been no concerted attempt to appraise the results as a whole. Moreover, it appeared that, perhaps as a result of the form of the trials carried out, the full implica-tions of their results have not always been realized by the experimenters themselves.
The available experiments from which informa-tion may be obtained vary from simple trials with a single plot for each treatment to well replicated modern experiments. A list of references to the literature from which the data were taken is given at the end of the paper; any experiments mentioned in the text, tables or text-figures can be identified by these references. Some published results, which were not listed, had to be rejected, either because of high plot variability or because some essential item of information was missing. In general, how-ever, the fieldwork and recording obviously reached a high standard, as in the experiments in Norfolk by Bates (1935) and Findlay & Sykes (1938), and at Wye by Tinley & Bryant (1939). In this type of investigation, where site-to-site variation is likely to be of less importance than, for example, in the assessment of an average response to fertilizers, it is quite as important to have accurate results for each individual centre as a wide distribution of centres. At the same time the effect on yield of variations in seed rate may well be different on different soils, in different climatic conditions and for different varieties; the data available are, how-ever, insufficient to permit such a detailed inquiry.
(b) The effect of seed rate on total yield In general, previous investigators have tended to direct their attention to variations either in spacing between sets or in size of set rather than to a con-sideration of the effects of the resulting changes in seed rate as such. Preliminary examination showed, however, that there was in fact a close relationship between weight of seed planted and yield, and that it was of secondary importance whether the varia-tions in seed rate arose from changes in tuber size or spacing between tubers. The first step in the investigation was therefore to determine a mean
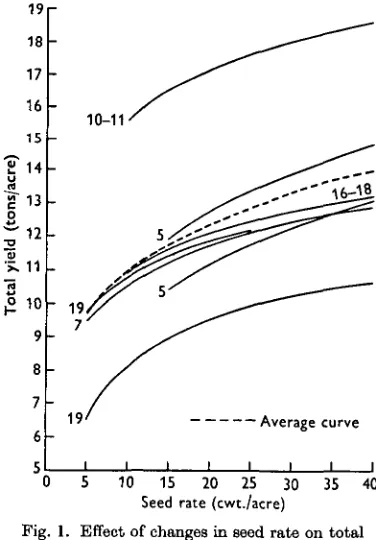
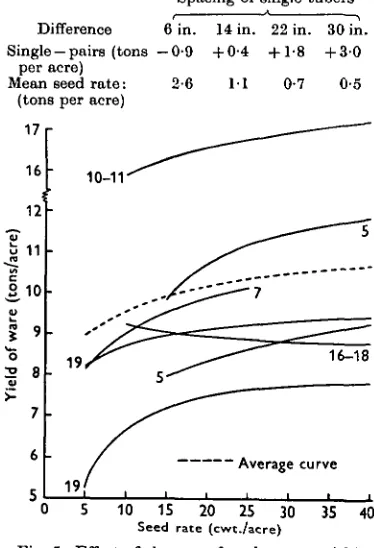
curve for the response of yield to increased weight of seed planted. This curve, together with the individual curves for the more important series of experiments, is shown in Fig. 1. (For estimating the curves of individual experiments linear or quadratic equations were fitted between total yield and the logarithm of the seed rate. The mean curve was calculated in such a way that, within each suc-cessive seed-rate interval of 5 cwt. per acre, its slope was the mean of the slopes of the fitted curves for individual experiments.)
19r
18
17
16
15
IT 14
12
10
9
8
7
6
-10-11
Average curve
10 15 20 25 30 Seed rate (cwt./acre)
35 40
Fig. 1. Effect of changes in seed rate on total yield. Results of experiments.
The whole of the normal range of seed rates, from say, 5-40 cwt. per acre, is covered by the available experiments; there is also some informa-tion for higher rates, but as this is only of practical interest to the producer of seed, it has not been included here. Fig. 1 shows that, in each series of experiments, an increase in seed rate increases yield, but that the increment falls off as the seed rate rises. Up to 15-20 cwt. per acre this falling off is fairly rapid, but above 20 cwt. the curves flatten out only slowly. At about 40 cwt. per acre the increase in yield in most cases only just equals the extra seed planted, but the curves do not entirely level out within the range of seed rates used in the experiments.
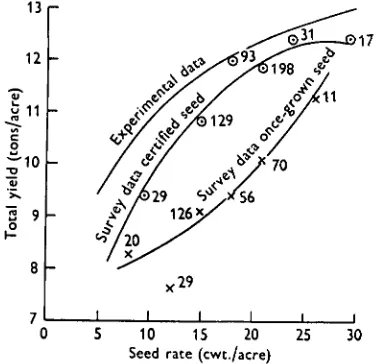
yields estimated by sample-harvesting are also available. The results are shown in Fig. 2, together with the mean curve for experiments given in Fig. 1. Bearing in mind the weaknesses of survey data when used to estimate the effects of one among a large number of factors known to affect yield, the agree-ment between the two sets of data is very reason-able. The survey data give a somewhat steeper curve than the experiments; this may be due to a tendency for growers with a lower standard of potato growing to economize on seed. It should be remembered, however, that the experiments, with only one or two exceptions, cover only the eastern and south-eastern counties, whilst the survey data include counties in the north and west. The slopes
13r
12
511
2 9 o
8
-_L _L _L _L
S 10 15 20 25 Seed rate (cwt./acre)
30
Fig. 2. Effect of changes in seed rate on total yield.
(Means of experimental and survey data).
of the curves for individual districts covered by the survey are very poorly determined, but it may not be fortuitous that for East Anglia and the south-eastern counties the increase of yield with increasing seed rate is much the same as for the experiments, and less than for other parts of the country.
Whilst from inspection of the data used in Fig. 1 it was clear that the alternative ways of altering seed rates—by varying either set-size or spacing between sets—were largely equivalent, it seemed worth while to determine whether there was in fact any consistent difference between them. To simplify the computations the individual curves were re-duced to approximately straight lines by plotting total yield against the logarithm of the seed rate and fitting a regression of the form
where S = seed rate in tons per acre, Ys = total yield in tons per acre at seed rate S, Yo = total yield in tons per acre at a standard seed rate So, bl = a constant. Most of the sources listed in the references
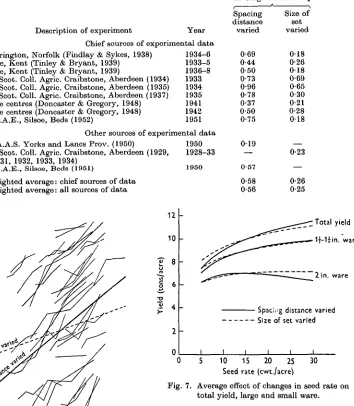
pro-vide one or more regression equations of the above type; for each size of set tested, a separate regres-sion equation was calculated to represent the change in total yield due to increasing seed rate by re-ducing spacing distance. Similarly, for each spacing distance a separate regression equation could be calculated for each size of set concerned. Where a paper covered a series of experiments a regression line was computed for each centre and year pro-vided that separate information was given. An examination of the experiments designed to include both methods of varying the seed rate showed that, for a unit increase in the seed rate, a larger increase of total yield may be expected if spacing distance is decreased than if size of set is increased. The average values of 61( which measures the slope of
the regression lines for each method of varying the seed rate are given in Table 6.
A comparison of the values of 6X for the individual
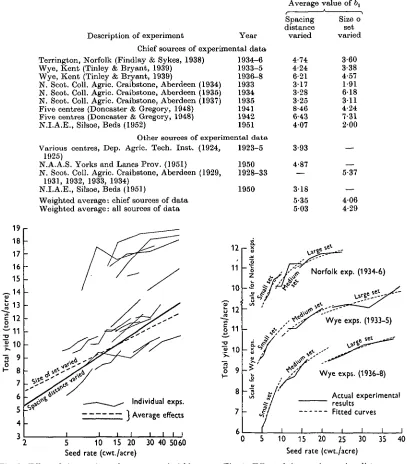
experiments indicates that the difference shown by the means is almost certainly not due to chance, the only cases in which b1 is greater for variation in size of set being a single experiment at Craibstone (1935) and one year of the Doncaster & Gregory (1948) series. Fig. 3 shows the mean regression of total yield on each method of varying the seed rate, assuming a yield of 10 tons at a seed rate of 15 cwt. per acre; the full line representing the effect of varying spacing distance, and the dotted line the effect of varying size of set. To show the relation of these mean regression lines to the individual results from which they are derived, the individual experimental results for the effect of changing seed rate by changes in spacing distance between sets are given by the thin lines. Although fairly consistent, the magnitude of the difference in slope of the two regression lines is too small to be of much practical significance within the normal range of seed rates. Thus if the total yield at a seed rate of 15 cwt. per acre is 10 tons, increasing the seed rate to 20 cwt. would increase the yield to 10-7 tons if the increase was effected by closer spacing with a given set size, and to 10-5 tons for increased set size at a constant spacing. Moreover, as will be shown later, there is a compensating difference in the behaviour of the percentage ware.
470
the medium sets; similarly, the medium sets pro-duced rather more than the larger sets. It is more difficult to make the comparison for the Wye
experi-do not lie on the same curve, but that at low seed rates the yield from small seed was one-quarter to one-half ton higher than for medium-sized seed, and
Table 6. Values of the regression coefficients bx for variations of spacing distance and size of set
Average value of 6,
19 18
17
16
15
Description of experiment
Chief sources of experimental data Terrington, Norfolk (Findlay & Sykes, 1938)
Wye, Kent (Tinley & Bryant, 1939) Wye, Kent (Tinley & Bryant, 1939)
N. Scot. Coll. Agric. Craibstone, Aberdeen (1934) N. Scot. Coll. Agric. Craibstone, Aberdeen (1935) N. Scot. Coll. Agric. Craibstone, Aberdeen (1937) Five centres (Doncaster & Gregory, 1948) Five centres (Doncaster & Gregory, 1948) N.I.A.E., Silsoe, Beds (1952)
Other sources of experimental data Various centres, Dep. Agric. Tech. Inst. (1924,
1925)
N.A.A.S. Yorks and Lanes Prov. (1951)
N. Scot. Coll. Agric. Craibstone, Aberdeen (1929, 1931, 1932, 1933, 1934)
N.I.A.B., Silsoe, Beds (1951)
Weighted average: chief sources of data Weighted average: all sources of data
Year tal data 1934-6 1933-5 1936-8 1933 1934 1935 1941 1942 1951 tal data 1923-5
1950 1928-33
1950
Spacing distance varied
4-74 4-24 6-21 3 1 7 3-28 3-25 8-46 6-43 4-07
3-93
4-87 —
3 1 8 5-35 5 0 3
Size o set varied
3-60 3-38 4-57 1-91 6 1 8 3 1 1 4-24 7-31 2-00
—
5-37
— 406 4-29
I
1 2
a 10
a 9
£ 8
7
6
5
4
3
Individual exps.
^ } Average effects
5 10 15 20 30 40 5060 Seed rate (cwt./acre)
Fig. 3. Effect, of changes in seed rate on total yield. (Spacing distance varied, size of set constant.)
ments since the seed rates of the three set sizes used in the experiment do not overlap. Extrapolation by exponential curves drawn for each seed rate makes it quite clear, however, that, as in the Norfolk series, the yields for the different seed sizes
Actual experimental results
Fitted curves
10 15 20 25 30
Seed rate (cwt./acre)
Fig. 4. Effect of changes in spacing distance on total yield for three different sizes of set.
that at moderate seed rates medium seed was similarly better than large seed.
difference in total yield for different set sizes where the seed rate is high. Some evidence that this is so is provided by the N.I.A.B. series in 1951 and 1952, discussed in more detail later in the paper, which permits the comparison of yield from single tubers spaced at 6, 14, 22 and 30 in. in the row with pairs of tubers at double these spacings. The increase in yield from planting single tubers instead of pairs was as follows:
Spacing of single tubers
Difference 6 in. 14 in. 22 in. 30 in. Single —pairs (tons —0-9 +0-4 +1-8 + 3 0
per acre)
Mean seed rate: 2-6 11 0-7 0-5 (tons per acre)
10 15 20 25 30 35 40
Seed rate (cwt./acre)
Fig. 5. Effect of changes of seed rate on yield of ware. Results of experiments.
Thus whilst at spacings of 44 and 60 in., implying low seed rates, the double tubers were, as might be expected, yielding substantially less in total than the single tubers, there was little difference at the higher rates; indeed at the closest spacing, with very high seed rates, the pairs actually yielded somewhat more than the singles.
(c) The effect of seed rate on yield of ware In determining the average effect of seed rate on the yield of ware there is a complication in so far as different riddle sizes had been used in the different experiments under review. For the main series of experiments included in Fig. 1, however, all gave the yield of ware dressed over a If or If in. mesh, except for the 1942 Doncaster & Gregory
(1948) series, and the Craibstone series (N. Scot.
Coll. Agric. Craibstone, Aberdeen, 1934,1935,1937), and it was possible to adjust these from 2 x 2 in. by
the results of other experiments in which a series of ware-sizes were recorded. The curves showing the relation of seed rate to the ware yields obtained in each series of experiments are shown in Fig. 5, together with a mean curve derived from them. These curves were derived in exactly the same way as were those of total yield. As with total produce the yield of If in. ware at first rises fairly quickly, as seed rate is increased, though it is interesting to see that more than 80 % of the full yield of ware is attained with a seed rate as low as 5 cwt. per acre. The mean curve for ware flattens out much more rapidly than that for total produce and shows no material increase for seed rates above 25 cwt.
The slope of the curve would be materially altered by variations in size of riddle; with smaller meshes the curve would be steeper, whilst for larger ware the curve would rise to a maximum and then begin to fall away again at high seed rates, when competition between plants restricts the size of the individual tuber.
Owing to the lack of a single uniform definition of ware for all experiments, a regression analysis similar to that used on total yield could not be applied directly to the yields of ware. Instead the relation of ware percentage to variation in seed rate has been examined. The percentage seed and chats, i.e. (100 —percentage ware) was plotted on a log-arithmic scale against the logarithm of the seed rate. By these transformations a series of approximately linear regressions was obtained, all having approxi-mately the same gradient (Fig. 6). In this way a linear relationship was obtained which describes with reasonable accuracy the response of percentage ware to a variation of seed rate, for all normal ware riddle sizes of 1J— If in. Where ware exceeds 95% of the total yield the errors of the estimates become large, resulting in the rather erratic lines for some of the individual experiments in the lower part of the figure.
The form of the equation relating the percentage ware to the seed rate is
log - W g + &a(log,S-log,S0),
where £ = seed rate in tons per acre, W, = per-centage ware at seed rate S, Wo = percentage ware at standard seed rate Sg, 62 = a constant.
As in the analysis of total yield, values of the regression coefficient b2 were computed for varia-tions of spacing distance and size of set separately, and the results are shown in Table 7. The two methods of increasing the seed rate consistently gave different results, the value of 62 when spacing
Table 7. Values of the regression coefficient b2, for variations of spacing
Average values of 62
Description of experiment
Chief sources of experimental data Terrington, Norfolk (Findlay & Sykes, 1938)
Wye, Kent (Tinley & Bryant, 1939) Wye, Kent (Tinley & Bryant, 1939)
N. Scot. Coll. Agric. Craibstone, Aberdeen (1934) N. Scot. Coll. Agric. Craibstone, Aberdeen (1935) N. Scot. Coll. Agric. Craibstone, Aberdeen (1937) Five centres (Doncaster & Gregory, 1948) Five centres (Doncaster & Gregory, 1948) N.I.A.E., Silsoe, Beds (1952)
Other sources of experimental data
N.A.A.S. Yorks and Lanes Prov. (1950) 1950 0-19 N. Scot. Coll. Agric. Craibstone, Aberdeen (1929, 1928-33 —
1931, 1932, 1933, 1934)
N.I.A.E., Silsoe, Beds (1951) 1950 0-57
Weighted average: chief sources of data 0#58
Weighted average: all sources of data 0-56 Year
tal data 1934-6 1933-5 1936-8 1933 1934 1935 1941 1942 1951
Spacing distance varied
0-69 0-44 0-50 0-73 0-96 0-78 0-37 0-50 0-75
Size of set varied
0 1 8 0-26 0 1 8 0-69 0-65 0-30 0-21 0-28 0-18
0-23
0-26 0-25
. Average effects I of % seed
) and chats
2 5 10 15 20 30 40 SO 60 Seed rate (cwt./acre)
Fig. 6. Effect of changes in seed rate on the percentage of seed and chats. Spacing distance varied, size of set constant.
increased. Although the difference is clearly estab-lished, its practical effect at normal seed rates is small. The results may, however, be of some im-portance for the seed grower. At the seed rate normally used in ware production such a difference
12
10
s
8
Total yield
1 H l i n . ware
2 in. ware
• Spacing distance varied Size of set varied
10 15 20 25 Seed rate (cwt./acre)
30
Fig. 7. Average effect of changes in seed rate on total yield, large and small ware.
largely compensates for the fact that total yield increases more rapidly when spacing distance is decreased.
shows that for a given set size the yield of large ware tends to fall if the sets are planted closer together, but changes little if set-size is varied and spacing held constant.
Tho conclusion that it is the weight of seed planted, practically regardless of the size of set or spacing between sets, which determines the yield of ware over the normal 1£ or 1 j in. riddles, is an important one for the ware producer. It implies that, provided he can modify the spacing distance between tubers, the average size of tuber in the seed he purchases is of little importance; in recent years there have been many complaints from growers about the large size of much of the seed coming from Scotland, but the results just described suggest that this may not be a great disadvantage provided the grower can increase his planting distance to correspond with the greater set size. I t also implies that, when sowing chats instead of ware, the same weight per acre should be sown by re-ducing spacing. If chats at say 7£ cwt. per acre are sown and spacing is not reduced the ware yield will be reduced by nearly a ton compared with a normal 15 cwt. seed rate.
ESTIMATED OPTIMUM SEED RATES IN RELATION TO WEIGHTS ACTUALLY PLANTED BY GROWERS
Some previous investigators have been content to present total and ware yields, together with a figure for 'net' yield (i.e. minus the seed planted) or with the yield expressed as per ton of seed planted. Neither of these simple devices is of much practical value except in very special circumstances. The alternative approach, of evaluating the most profit-able seed rates for given prices of seed and produce suffers from the drawback that in a time of con-tinually rising prices the actual prices used soon become out of date. The relative prices, however, change much more slowly. Moreover, it is less important to determine the precise 'optimum' for a given set of conditions than to know the range within which a reduction in returns below the most profitable rate will be negligible.
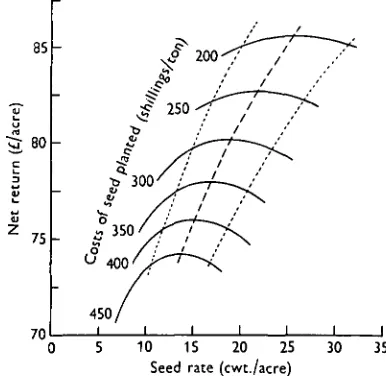
Fig. 8 shows the relation between the seed rate and monetary returns for a range of costs of seed planted, based on the foregoing experimental re-sults. In these calculations the selling price of ware is taken as 240s. per ton, the value of seed and chats at 120s. per ton, while 40s. per ton of total yield has been deducted from the returns to cover the costs of lifting, clamping, sorting. The individual curves, giving returns for different costs of seed planted, are drawn at intervals of 50s. per ton. Here ' costs of seed planted' include costs of seed, transport, bagging, and a small part of the planting costs assumed to be variable with seed rate. All
other costs such as rent and costs of ploughing, which are not variable with the seed rate have been ignored. Therefore the 'net returns' shown in Fig. 8 ignore large elements of fixed cost and do not indi-cate the true level of net return. The change in tho optima with decreasing costs of seed are indicated by the dashed line, while the range of seed rates within which returns are not more than 10s. per acre short of the optimum is shown by the dotted lines. In most parts of England and Wales the cost per ton of certified seed planted in 1952-3 would be from 360 to 410s. per ton of seed according to cost of trans-port and whether 'A' or ' H ' seed was planted.
85
80
75
70
450
30 35
5 10 15 20 25 Seed rate (cwt./acre)
Fig. 8. Net returns for different costs per ton of seed planted. The optimum seed rate for different costs of seed planted is shown by the dashed line. The dotted
lines show the range of seed rates within which tho
net returns are within 10*. per acre of the optima. Thus in much of East Anglia including the Fens, central and southern England, where to plant a ton of seed costs about 400s., the optimum seed rate for ware production was about 15 cwt. per acre; this optimum would not exceed 17 cwt. per acre any-where in England and Wales any-where certified seed had to be purchased. Seed production is outside the scope of this paper, but a small proportion of growers in ware-producing districts are able to sell off once-grown seed; this will increase the average price obtained per ton of produce, and if the same grade of seed is planted the optimum seed rate will be several cwt. higher than for ware production only. In Fig. 8 a riddle size of 1|-1 J in., giving 85 % ware has been assumed; the optimum will be in-creased where a higher percentage ware can be expected and' vice versa.
If a grower's own once-grown seed is sufficiently healthy he may buy in fresh seed only every other
year; in such circumstances the cost of the once-grown seed will be at, or, more probably, somewhat below the selling price of ware—say 175 to 240s. per ton—and the optimum seed rate will be cor-respondingly increased to between 20 and 25 cwt. per acre.
For all costs of seed the curves in Fig. 8 show a very wide range of seed rates within which the returns are only a little below the optimum. Where the price of seed is high in relation to returns from ware, the curvature is sharper and the optimum more pronounced. Even so, the range of seed rates giving returns within 10s. per acre of the optimum is as much as 6 cwt. (12-18 cwt.) for a 15 cwt. optimum and 12 cwt. (19—31 cwt.) at a 25 cwt. optimum.
Whilst Fig. 8 shows that there is a wide range of seed rates within which no important reduction in returns will occur relative to the return at the
optimum, the survey data, indicates that many
growers are in fact planting at rates well outside these limits. Thus in some of the main potato-growing areas of the country—the Fens, Lindsey and parts of Yorkshire, which together make up almost one half of the total acreage—the average rate of planting of imported certified seed is 20-23 cwt. per acre, compared with an optimum given by the experiments of 15-17 cwt. per acre. If these figures can be accepted, there is an average loss per acre of 20-25s., except on those farms producing once-grown seed for sale.
For home-produced once-grown seed, on the other hand, it is the calculated optimum which is over 1 ton per acre, whilst the average rate of planting actually used is under 17 cwt. per acre. This gives an estimated average loss of 10- 15s. per acre, the figure being small for the main potato-growing areas just mentioned, bvit considerable in most other districts.
In view of this apparent conflict between theory and practice, it is natural to question the reliabili-ties of either the survey or experimental data. The close agreement between the results of the indivi-dual experiments and between the two entirely independent surveys, makes the conclusions very hard to controvert. It should of course be borne in mind that in the experimental data the western and northern counties are unrepresented, apart from one centre in the Doncaster & Gregory (1948) series, and the three experiments at N. Scot. Coll. Agric. Craibstone, Aberdeen (1934, 1935, 1937); the con-clusions may therefore not be valid outside the eastern and south-eastern counties. Again most of the trials were carried out 10-20 years ago, and it could be argued that many practices, as, for example, manuring, have changed considerably since then. It is possible that at the higher levels of manuring now practised, higher seed rates may be profitable.
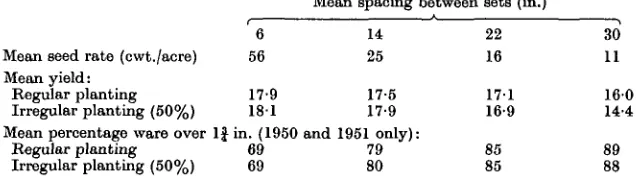
Against this, however, the recent high-yielding ex-periments at Silsoe (N.I.A.E., Silsoe, Beds. 1951, 1952), give results very similar to those obtained in the earlier trials. No satisfactory trials including both seed rates and levels of manuring appear to have been carried out, however, and the possibility of an inter-action between the two should not be lost sight of. One important feature in which the experimental procedure differs from normal farm practice is the greater regularity of spacing and uniformity of size of set, especially in those experiments where both factors were being tested. In actual farm practice the gaps between tubers may vary considerably, especially where planting is by machine, and some consignments of seed give a very uneven sample. To what extent do these local variations about the mean seed rate of a field affect the optimum, and are the losses resulting from this unevenness of the rate of seeding large enough to justify the extra costs involved in distributing the seed more evenly ? The previous discussion of optimum seed rates would suggest that the losses due to such irregulari-ties of seed rate are in fact very small, since even when the price of seed is high, a range of as much as 3-4 cwt. per acre on either side of the optimum results in a loss of no more than 10s. per acre. The loss per acre from chance variations of spacing or tuber size within a field should be smaller still and should not therefore amount to more than a few shillings per acre. Fortunately the question has already been the subject of experiment at the Nat. Inst. Agric. Engineering (1951,1952), in which large irregularities of spacing were deliberately intro-duced into experiments with seed rate and variety. For various spacing distances, varieties and seed sizes, an even spacing was compared with a greater and lesser degree of irregular spacing, called ' 50 %' and '100%' irregularity. For comparison with a regular spacing of 6 in. between each tuber, ' 50 %' irregularity implied alternate spacings of 3 and 9 in., and ' 100 %' irregularity implied two tubers placed side by side at 12 in. Three experiments carried out in the years 1950-2 differed in design from year to year, but each contained one or both of these irregularities. As the results of these very interest ing trials have not yet been published, we are greatly indebted to Mr W. H. Cashmore, Director of the Institute, and to Mr J. G. Davies, who carried out the trials, for permission to use the results.
irregularly spaced sets than for regular planting; at 22 in. tho difference was negligible. This indicates that in practice large seed (up to 3 oz. per set) can be planted at the optimum seed rate by increasing spacing without loss in yield. It is doubtful whether larger seed can be used without loss in yield since another factor, the difficulty of controlling weeds in very widely spaced crops, must also be taken into account; for this the safe upper limit for spacing between sets is probably not more than about 24 in. At this spacing the optima already quoted cannot be attained where the average set size is in excess of 3 oz. for certified seed and of 4 oz. for once-grown
growers have very definite views on what spacing distance they like to have between sets, and the actual amounts planted per acre can be largely explained by supposing that it is a given spacing distance, rather than a given seed rate at which the grower aims; that is, seed rate is determined mainly by set-size. It has been shown earlier (Table 5) that in the main potato-growing areas the average weight of sets in certified seed is approximately 2£ oz., and that at the normal spacing of 17 or 18 in. this means a seed rate of more than 1 ton per acre. With this set size it would be necessary to plant at 21 or 22 in. to sow the optimum quantity.
Table 8. Effect on total yield and percentage ware of irregular spacing in the drill (1950-2)
Mean spacing between sets (in.)
Mean seed rate (cwt./acre) Mean yield:
Regular planting Irregular planting (50%)
Mean percentage ware over 1} in. (1950 and 1951 only): Regular planting 69 79 Irregular planting (50%) 69 80
6 56
17-9 181
14 25
17-5 17-9
22 16
17-1 16-9
85 85
30 11
160 14-4
89
seed. Only a small part of the surveyed fields were in fact planted with certified seed having a mean weight per set of more than 3 oz. There has been practically no experimental work on the variability of set-size on the same lines as for irregularity of spacing, but there can be little doubt that local variations in seed rate within the field produced by an uneven sample exert similar effects to those arising from irregular spacing. We should, there-fore, expect unevenness in the sample to be im-portant only at very low seed-rates or in extreme cases, where a sample consists mainly of very large and very small tubers. In such cases, sorting the seed into large and small before planting would probably well repay the expense.
Very little information is available on the number of 'blanks' in the rows, either in the experimental plots or in commercial crops; whilst there is probably some tendency for the number of blanks to be lower on the experimental plots, the difference is almost certainly negligible.
To sum up, there seems to be no reason to believe that the optimal seed rates suggested by the experi-ments are very far from the true optima, or that the survey data on growers' actual practice is at fault. In trying to account for the apparent failure of many growers to adjust their seed rates to the most profitable rate, it must be remembered that without deliberate experiment it is far from easy for an individual grower to test whether or not his cus-tomary rate of planting is the right one. Most
The supply of once-grown seed is limited by the riddle used in dressing the previous season's crop, and with most crops it is necessary to keep back in the seed a substantial weight of tubers saleable as ware. There is no doubt a considerable temptation to extract as much saleable ware as possible out of the crop in hand, but the grower planting his own once-grown seed should realize that unless he keeps back at least a ton of seed per acre for the following crop he will reduce his profit.
SUMMARY
This paper, which forms part of a series of investiga-tions on the potato crop, presents evidence obtained from experiments reported in the literature on the relation between seed rate and yield of maincrop potatoes. The available experiments are sufficient to indicate what is the average relationship between seed rate and yield, but are insufficient to demon-strate any clear differences between different parts of the country, soil types or even different varieties. Using this average relationship, optimum seed rates are presented for a range of prices of seed and produce. These optimal rates are compared with estimates from surveys of the actual amounts planted by growers in different parts of the country. Provided the optimum seed rate is attained the precise combination of seed size and spacing distance appears to be of minor importance; that is, a grower should aim to plant at the optimum seed rate regardless of seed size. There is, however, an
upper limit of spacing between sets which should not be exceeded however large the seed may be.
The optimum rate of planting at 1952 prices of 'A' or ' H ' certificate seed is estimated to be 16-17 cwt. in most of the main potato-growing areas of the country, though it may be a little higher where a grower has a market for once-grown seed. Surveys indicate, however, that the normal planting rate of certified seed is over a ton to the acre in these districts.
For a grower's own once-grown seed, on the other hand, for which the cost is not more than the price received for ware, the optimum seed rate is at least one ton per acre, whilst the average weight of seed actually planted is only about 17 cwt. per acre. It is estimated that the average loss per acre due to this failure to plant at the optimum seed rate
amounts to 20-25s. per acre planted with certified seed and 10—15s. per acre for once-grown seed.
The survey data shows that in the main potato-growing areas the average planting distance between sets (17-18 in.) varies little from district to district, or farm to farm, and that spacing between the drills is also very constant at 27-29 in. Regional differences in the rate of planting of certified seed are mainly due to variations in the average size of set. The explanation of the conflict between experi-ment and practice appears to be that a grower usually maintains the same spacing between sets regardless of their size and that certified seed tends to be large; the average weight of a tuber of certified seed in 1950 was found to be almost 2£ oz. com-pared with just over 2 oz. for the average once-grown set.
REFERENCES BATES, G. H. (1935). J. Agric. Sci. 25, 297.
BOYD, D. A. & DYKE, G. V. (1950). N.A.A.S. Quart. Rev. no. 10, 47.
DEP. AGBIC. TECH. INST. (1924). J. Dep. Agric. Ire.
24, 365.
DEP. AGRIC. TECH. INST. (1925). J. Dep. Agric. Ire.
25, 60.
DONCASTER, J. P. & GREGORY, P. H. (1948). Rep. Agric. Res. Coun. no. 7, 155. (5).
DYKE, G. V. & Avis, P. R. D. (1953). J. Agric. Sci. 43, 450.
FINDLAY, D. H. & SYKES, E. T. (1938). Emp. J. Exp.
Agric. 6, 253. (7).
MIN. OF AGRIC, N. IRELAND (1925). Leaflet no. 7, 11. N.A.A.S. YOBKS AND LANCS PBOV. (1951).
Experi-ments carried out in 1950. Unpublished.
N.I.A.E., SrLSOB, BEDS (1951). Tech. Mem. no. 79/ FID/51. Unpublished. (10).
N.I.A.E., SILSOE, BEDS (1952). Tech. Mem. no. 73/ FID/52. Unpublished. (11).
N. SCOT. COLL. AGRIC. CRAIBSTONE, ABERDEEN (1929).
Scot. J. Agric. 12, 68.
N. SCOT. COLL. AGKIC. CRAIBSTONE, ABERDEEN (1931).
Scot. J. Agric. 14, 81.
N. SCOT. COLL. AGRIC. CRAIBSTONE, ABERDEEN (1932).
Scot. J. Agric. 15, 79.
N. SCOT. COLL. AGRIC. CRAIBSTONE, ABERDEEN (1933).
Scot. J. Agric. 16, 87.
N. SCOT. COLL. AGRIC. CRAIBSTONE, ABERDEEN (1934).
Scot. J. Agric. 17, 85. (16).
JST. SCOT. COLL. AGRIC. CRAIBSTONE, ABERDEEN (1935).
Scot. J. Agric. 18, 64. (17).
N. SCOT. COLL. AGRIC. CRAIBSTONE, ABERDEEN (1937).
Scot. J. Agric. 20, 57. (18).
TINLEY, N. L. & BRYANT, D. M. (1939). J. S.-E. Agric. Coll. Wye, no. 44, 120. (19).
Numbers in brackets at end of references give sources of data in Figs. 1 and 5.