Geosci. Model Dev., 4, 901–917, 2011 www.geosci-model-dev.net/4/901/2011/ doi:10.5194/gmd-4-901-2011
© Author(s) 2011. CC Attribution 3.0 License.
Geoscientific
Model Development
Modeling anthropogenically controlled secondary organic aerosols
in a megacity: a simplified framework for global and climate models
A. Hodzic1and J. L. Jimenez2
1National Center for Atmospheric Research, Boulder, CO, USA
2Dept. of Chemistry and Biochemistry, and CIRES, University of Colorado, Boulder, CO, USA Received: 18 March 2011 – Published in Geosci. Model Dev. Discuss.: 19 April 2011
Revised: 29 September 2011 – Accepted: 12 October 2011 – Published: 24 October 2011
Abstract. A simplified parameterization for secondary or-ganic aerosol (SOA) formation in polluted air and biomass burning smoke is tested and optimized in this work, to-wards the goal of a computationally inexpensive method to calculate pollution and biomass burning SOA mass and hygroscopicity in global and climate models. A regional chemistry-transport model is used as the testbed for the pa-rameterization, which is compared against observations from the Mexico City metropolitan area during the MILAGRO 2006 field experiment. The empirical parameterization is based on the observed proportionality of SOA concentra-tions to excess CO and photochemical age of the airmass. The approach consists in emitting an organic gas as lumped SOA precursor surrogate proportional to anthropogenic or biomass burning CO emissions according to the observed ratio between SOA and CO in aged air, and reacting this surrogate with OH into a single non-volatile species that condenses to form SOA. An emission factor of 0.08 g of the lumped SOA precursor per g of CO and a rate con-stant with OH of 1.25×10⁻¹¹cm3molecule−1s−1 repro-duce the observed average SOA mass within 30 % in the ur-ban area and downwind. When a 2.5 times slower rate is used (5×10⁻¹²cm3molecule−1s−1)the predicted SOA amount and temporal evolution is nearly identical to the results ob-tained with SOA formation from semi-volatile and inter-mediate volatility primary organic vapors according to the Robinson et al. (2007) formulation. Our simplified method has the advantage of being much less computationally expen-sive than Robinson-type methods, and can be used in regions where the emissions of SOA precursors are not yet available. As the aged SOA/1CO ratios are rather consistent globally for anthropogenic pollution, this parameterization could be
Correspondence to: A. Hodzic
reasonably tested in and applied to other regions. The evolu-tion of oxygen-to-carbon ratio was also empirically modeled and the predicted levels were found to be in reasonable agree-ment with observations. The potential enhanceagree-ment of bio-genic SOA by anthropobio-genic pollution, which has been sug-gested to play a major role in global SOA formation, is also tested using two simple parameterizations. Our results sug-gest that the pollution enhancement of biogenic SOA could provide additional SOA, but does not however explain the concentrations or the spatial and temporal variations of mea-sured SOA mass in the vicinity of Mexico City, which ap-pears to be controlled by anthropogenic sources. The contri-bution of the biomass burning to the predicted SOA is less than 10 % during the studied period.
1 Introduction
Comparisons with data from recently developed fast in-strumentation have confirmed the tendency of models to greatly underpredict the levels of SOA formed in urban plumes when only the SOA formation from volatile or-ganic compounds (VOCs) is considered (e.g. de Gouw et al., 2005; Dzepina et al., 2009; Hodzic et al., 2009; Shri-vastava et al., 2010; Lee-Taylor et al., 2011). Hodzic et al. (2009) estimated the missing SOA mass production as ∼20 tons day−1 in the Mexico City afternoon boundary layer when using a traditional SOA model. Implementing SOA formation from primary semi-volatile and intermediate volatility species through the volatility basis set formalism (VBS, Robinson et al., 2007; Grieshop et al., 2009) substan-tially increases the predicted SOA to levels similar to those observed (Dzepina et al., 2009; Hodzic et al., 2010a; Shrivas-tava et al., 2010). However, substantial uncertainties persist in terms of the identity and sources of the SOA precursors and the mechanism parameters, as well as on the influence of other proposed SOA formation mechanisms (e.g. Hodzic et al., 2010a). In particular, the VBS approach requires adding the emissions of primary organic vapors as they are not in-cluded in current inventories. For Mexico City, this missing mass was added to models as 7.5 times the emissions of POA (Dzepina et al., 2009; Tsimpidi et al., 2010; Hodzic et al., 2010a). This emission amount is considerable and highly un-certain although it is the main driver for the predicted SOA mass. In addition, the full VBS approach is computation-ally very costly, as it requires keeping track of organic vapor and particle-phase species over 9 volatility bins and multi-ple particle size bins commonly used to represent the aerosol size distribution. A reduced VBS approach has been recently proposed by Shrivastava et al. (2010) which reduces the com-putational burden of the method while maintaining a link to the originally-proposed parameterization.
In the aerosol field measurement community, the forma-tion of SOA in polluted airmasses has been recently studied and parameterized by considering ratios of OA to a chem-ically quasi-inert species such as carbon monoxide (CO), which allows removing the effect of dilution and emissions on timescales of several days (de Gouw et al., 2005; De-Carlo et al., 2010). Indeed, in urban and regional scales, CO is approximately conserved with regard to OH oxida-tion on timescales of hours to several days which are rele-vant to SOA formation, and its main sources are the combus-tion from traffic and from biomass burning, and long-range transport. Chemical production of CO from anthropogenic VOCs makes a very small contribution to polluted airmasses (Griffin et al., 2007). Although production from biogenic VOCs can make a major contribution to background CO lev-els in biogenically influenced areas (Hudman et al., 2008), this source does not result in narrow plumes with several hundred ppb of CO, where the SOA vs. CO parameteriza-tions for pollution and biomass burning sources have been derived (e.g. Kleinman et al., 2008; DeCarlo et al., 2010).
To remove the influence of background (long range trans-port) CO, it is common to consider1CO as the measured CO minus the CO background. As CO and POA have similar or generally collocated emission sources, their ra-tio (POA/1CO) is relatively constant when averaged over a source region, and can be estimated from ambient measure-ments. The continuing good correlation between OA and CO and the large measured increase in OA/1CO ratios down-wind of urban areas can then be attributed to the rapid growth of secondary organic aerosols due to anthropogenic pollu-tion. de Gouw and Jimenez (2009), DeCarlo et al. (2010), and Cubison et al. (2011) summarize the observed OA/1CO enhancement ratios from studies at multiple worldwide lo-cations for fresh and aged urban and biomass burning emis-sions. Urban POA/1CO ratios were found to range from 5– 12 µg m−3ppmv−1, with the lower values likely to be more correct as the higher values may have some SOA contami-nation (de Gouw and Jimenez, 2009). Total OA/1CO ratios in aged urban air are systematically higher than those mea-sured in the source region by about an order-of-magnitude. Very similar OA/1CO evolution and asymptotic levels rang-ing from 50–110 µg m−3ppmv−1in aged air were found for various polluted locations in the Northeast US, Central Mex-ico, Tokyo and the Po Valley. In plumes influenced by biomass burning, POA/1CO ratios are initially much higher (50–240 µg m−3ppmv−1) than for urban airmasses, and net OA/1CO enhancement during aging appears to vary from a small reduction to a gain comparable to the POA emissions (de Gouw and Jimenez, 2009; Yokelson et al., 2009; Cubison et al., 2011). For example in the forest fires that dominated biomass burning impacts in the Mexico City region during the MILAGRO experiment the net OA/1CO enhancement seems to be in the same range as for the urban emissions (40–60 µg m−3ppmv−1, DeCarlo et al., 2010).
A. Hodzic and J. L. Jimenez : Modeling anthropogenically controlled secondary organic aerosols in a megacity 903 using monthly mean SOA observations, which do not have
sufficient detail to resolve polluted urban conditions. Thus there is a need to explore whether the conclusions of that global study hold when evaluated with a regional model at much higher spatial and temporal resolution.
Therefore the goal of the present study is to test and op-timize a first order SOA parameterization for anthropogenic pollution based on the observed SOA/1CO ratios that best describes the observed OA. We also propose a simple pa-rameterization to estimate the oxygen-to-carbon ratio (O/C) of OA in polluted regions. For that purpose the regional chemistry-transport model predictions are evaluated against ground and aircraft data from Mexico City during the major MILAGRO 2006 field project. Although this type of em-pirical parameterization does not have mechanistic detail, or allow predicting some OA properties such as volatility, be-ing able to estimate SOA with a simple scheme is of great interest for global and climate modeling studies that need to evaluate the transport and radiative impact of aerosols. The optimized parameterization is compared with SOA predic-tions from the more complex volatility basis set approach. Finally, we also test two simplified parameterizations of bio-genic SOA enhancement due to anthropobio-genic pollution.
2 Modeling approach
2.1 General model description
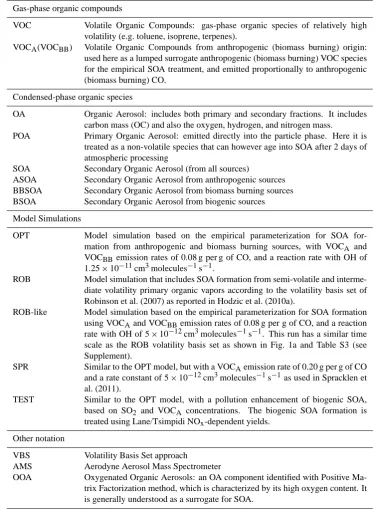
For this study, the mesoscale chemical transport model CHIMERE was run from 15 to 31 March 2006 over the Mex-ico City region at both regional (35 km×35 km) and urban (5 km×5 km) grid scales using the same configuration and the same forcing (i.e. meteorology, emissions, boundary and initial conditions) as described by Hodzic et al. (2009, 2010a, b). Here we provide a brief summary of sources and pro-cesses that influence the levels of organic aerosols, and intro-duce the simplified SOA modeling approach that was applied in the present study. The terminology used in the paper is summarized in Table 1.
The CHIMERE model simulates the emissions of primary OA, the chemistry and gas/aerosol partitioning of secondary organic species and their gaseous precursors, in addition to their transport, boundary layer mixing, and dry and wet de-position processes. Similar to Hodzic et al. (2009, 2010a, b), primary gaseous and aerosol species are emitted from (i) an-thropogenic sources as reported by the 2002 official Mex-ico City Metropolitan Area emission inventory (CAM, 2004) and the National Emissions Inventory (NEI) of 1999 emis-sions outside of the city (http://mexiconei.blogspot.com/), (ii) biomass burning emissions as estimated from satel-lite data by Wiedinmyer et al. (2006), and (iii) biogenic VOC emissions calculated online using the MEGAN model (Guenther et al., 2006).
Table 1. Terminology used for the various types of organic compounds, and for model simulations.
Gas-phase organic compounds
VOC Volatile Organic Compounds: gas-phase organic species of relatively high volatility (e.g. toluene, isoprene, terpenes).
VOCA(VOCBB) Volatile Organic Compounds from anthropogenic (biomass burning) origin: used here as a lumped surrogate anthropogenic (biomass burning) VOC species for the empirical SOA treatment, and emitted proportionally to anthropogenic (biomass burning) CO.
Condensed-phase organic species
OA Organic Aerosol: includes both primary and secondary fractions. It includes carbon mass (OC) and also the oxygen, hydrogen, and nitrogen mass.
POA Primary Organic Aerosol: emitted directly into the particle phase. Here it is treated as a non-volatile species that can however age into SOA after 2 days of atmospheric processing
SOA Secondary Organic Aerosol (from all sources)
ASOA Secondary Organic Aerosol from anthropogenic sources BBSOA Secondary Organic Aerosol from biomass burning sources BSOA Secondary Organic Aerosol from biogenic sources
Model Simulations
OPT Model simulation based on the empirical parameterization for SOA for-mation from anthropogenic and biomass burning sources, with VOCA and VOCBBemission rates of 0.08 g per g of CO, and a reaction rate with OH of 1.25×10⁻¹¹cm3molecules−1s−1.
ROB Model simulation that includes SOA formation from semi-volatile and interme-diate volatility primary organic vapors according to the volatility basis set of Robinson et al. (2007) as reported in Hodzic et al. (2010a).
ROB-like Model simulation based on the empirical parameterization for SOA formation using VOCAand VOCBBemission rates of 0.08 g per g of CO, and a reaction rate with OH of 5×10⁻¹²cm3molecules−1s−1. This run has a similar time scale as the ROB volatility basis set as shown in Fig. 1a and Table S3 (see Supplement).
SPR Similar to the OPT model, but with a VOCAemission rate of 0.20 g per g of CO and a rate constant of 5×10⁻¹²cm3molecules−1s−1as used in Spracklen et al. (2011).
TEST Similar to the OPT model, with a pollution enhancement of biogenic SOA, based on SO2 and VOCA concentrations. The biogenic SOA formation is treated using Lane/Tsimpidi NOx-dependent yields.
Other notation
VBS Volatility Basis Set approach AMS Aerodyne Aerosol Mass Spectrometer
OOA Oxygenated Organic Aerosols: an OA component identified with Positive Ma-trix Factorization method, which is characterized by its high oxygen content. It is generally understood as a surrogate for SOA.
accounts for wind-blown dust, secondary inorganic species (sulfate, nitrate and ammonium), particulate water, and other primary anthropogenic particles. The size distribution of all species is represented using a sectional approach with 8 size bins (40 nm to 10 microns in physical diameter) with internal mixing within each bin. Further information on the model formulation and related publications can be found on http://www.lmd.polytechnique.fr/chimere.
2.2 Alternative NOx-dependent SOA formation from biogenic precursors
A. Hodzic and J. L. Jimenez : Modeling anthropogenically controlled secondary organic aerosols in a megacity 905 considered including isoprene, terpenes and sesquiterpenes.
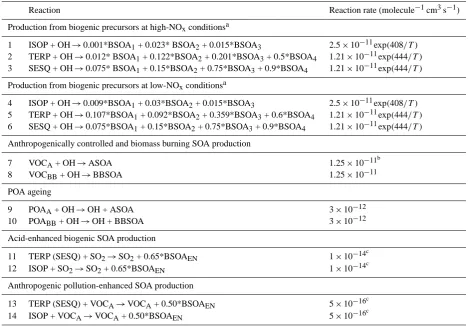
The stoichiometric mass yields that determine the amount of oxidation products in both low- and high-NOxregimes use the updated values from Tsimpidi et al. (2009) as summa-rized in Table 2, without additional gas-phase “aging” for the oxidized organic vapors as this is not well-supported by the literature (e.g. Dzepina et al., 2011). SOA is formed via both low- and high-NOx pathways based on the frac-tion of organo-peroxy radicals that react with NO (Lane et al., 2008). The four oxidation products are then partitioned to the aerosol phase according to their volatility, using the saturation concentrations of 1, 10, 100, and 1000 µg m−3at 300 K, respectively. The enthalpies of vaporization are set to 88 kJ mol−1 for all four species. Using a similar NOx -dependent approach Shrivastava et al. (2010) reported that the biogenic SOA predicted in Mexico City was 4–5 times lower than predicted in our previous studies (Hodzic et al., 2009, 2010a) which used higher yields for isoprene under low-NOxconditions based on Henze and Seinfeld (2006) and which showed good correspondence with tracer-derived esti-mates of biogenic SOA (Hodzic et al., 2009). The sensitivity of the model results to the choice of the biogenic SOA pa-rameterization is discussed in Sect. 3.5.1.
2.3 Simplified SOA parameterization for anthropogenic and biomass burning sources
SOA from anthropogenic sources has been parameterized based on the observed behavior of OA/1CO ratios vs. pho-tochemical age that were reported in the literature, and in particular for Mexico City (Kleinman et al., 2008; De-Carlo et al., 2010). As SOA is a secondary pollutant (un-like 1CO) that forms from the oxidation of VOC precur-sors, SOA cannot be emitted directly proportionally to CO emissions for the purposes of regional modeling (although some global models do treat SOA in this way for simplic-ity, which is more reasonable for their large spatial and tem-poral scales, e.g. Textor et al., 2006). The implementation used here is similar to that of Spracklen et al. (2011). The first step of the approach consists in emitting a VOC pre-cursor surrogate (VOCAfor anthropogenic sources) that will gradually oxidize to form SOA downwind of the source re-gion. The ratio of VOCA to anthropogenic CO emissions is assumed to be equal to the observed ratio in concentra-tions in very aged air under low biomass-burning condiconcentra-tions: Emis(VOCA)/Emis(CO)=SOA/1CO. The SOA/1CO re-ported in the literature for aged polluted air (and also for Mexico City) range from 40 to 110 µg m−3ppmv−1at stan-dard temperature and pressure (de Gouw and Jimenez, 2009; DeCarlo et al., 2010) which translates into approximately 0.032 to 0.088 g g−1 as summarized in Fig. 1a. We note that ratios for very aged air are very difficult to evaluate with field data, due to the effect of dilution and the diffi-culty of determining the CO background when1CO is small, therefore slightly higher asymptotic ratios are possible. This
32
Figures
850
851
852
Figure 1: A schematic representation of the evolution of (a) the SOA/∆CO and (b) oxygen-to-carbon
853
ratios as a function of photochemical age. For the SOA mass, the observed ratios (gray polygons)
854
are taken from de Gouw and Jimenez (2009) and DeCarlo et al. (2010) for urban airmasses, whereas
855
for the O/C ratios the observed ratios are those summarized in Dzepina et al. (2011). Curves
856
represent the estimated ratios for OPT, SPR and ROB-like simulations for typical daily average OH
857
concentrations found in Mexico City of 1.5x10⁶ molecules cm-3. 858
Fig. 1. A schematic representation of the evolution of (a) the SOA/1CO and (b) oxygen-to-carbon ratios as a function of pho-tochemical age. For the SOA mass, the observed ratios (gray poly-gons) are taken from de Gouw and Jimenez (2009) and DeCarlo et al. (2010) for urban airmasses, whereas for the O/C ratios the ob-served ratios are those summarized in Dzepina et al. (2011). Curves represent the estimated ratios for OPT, SPR and ROB-like simula-tions for typical daily average OH concentrasimula-tions found in Mexico City of 1.5×10⁶molecules cm−3.
Table 2. Reactions leading to the production of SOA and its precursors.
Reaction Reaction rate (molecule−1cm3s−1)
Production from biogenic precursors at high-NOxconditionsa
1 ISOP + OH→0.001*BSOA1+ 0.023* BSOA2+ 0.015*BSOA3 2.5×10⁻¹¹exp(408/T) 2 TERP + OH→0.012* BSOA1+ 0.122*BSOA2+ 0.201*BSOA3+ 0.5*BSOA4 1.21×10⁻¹¹exp(444/T) 3 SESQ + OH→0.075* BSOA1+ 0.15*BSOA2+ 0.75*BSOA3+ 0.9*BSOA4 1.21×10⁻¹¹exp(444/T) Production from biogenic precursors at low-NOxconditionsa
4 ISOP + OH→0.009*BSOA1+ 0.03*BSOA2+ 0.015*BSOA3 2.5×10⁻¹¹exp(408/T ) 5 TERP + OH→0.107*BSOA1+ 0.092*BSOA2+ 0.359*BSOA3+ 0.6*BSOA4 1.21×10⁻¹¹exp(444/T ) 6 SESQ + OH→0.075*BSOA1+ 0.15*BSOA2+ 0.75*BSOA3+ 0.9*BSOA4 1.21×10⁻¹¹exp(444/T ) Anthropogenically controlled and biomass burning SOA production
7 VOCA+ OH→ASOA 1.25×10⁻¹¹
b
8 VOCBB+ OH→BBSOA 1.25×10⁻¹¹
POA ageing
9 POAA+ OH→OH + ASOA 3×10⁻¹²
10 POABB+ OH→OH + BBSOA 3×10⁻¹² Acid-enhanced biogenic SOA production
11 TERP (SESQ) + SO2→SO2+ 0.65*BSOAEN 1×10⁻¹⁴
c
12 ISOP + SO2→SO2+ 0.65*BSOAEN 1×10⁻¹⁴
c
Anthropogenic pollution-enhanced SOA production
13 TERP (SESQ) + VOCA→VOCA+ 0.50*BSOAEN 5×10⁻¹⁶
c
14 ISOP + VOCA→VOCA+ 0.50*BSOAEN 5×10⁻¹⁶
c
a: following Lane et al. (2008) methodology, and using the updated mass yields from Tsimpidi et al. (2009). The four oxidation products i.e. BSOA1, BSOA2, BSOA3, BSAO4,
have saturation concentrations of 1, 10, 100, and 1000 µg m−3at 300 K, respectively, and the enthalpies of vaporization of 88 kJ mol−1for all four species.
b: this rate is consistent based on field observations reported by de Gouw et al. (2008) and De Carlo et al. (2010). The value indicated here correspond to the OPT simulation. See
text for details.
c: these rates are taken from Spracklen et al. (2011), and resulted in a large amount of enhanced biogenic SOA in their global model simulations.
Typically, the timescale is of the order of one day (de Gouw et al., 2005; Brock et al., 2008; Kleinman et al., 2008; DeCarlo et al., 2010). In the Mexico City region the average 24-h OH concentrations are ∼1.5×10⁶molecules cm−3 both for the observations (C. Cantrell, NCAR, personal communication, 2008), and for the model (Hodzic et al., 2009, Fig. 9). Given these values, the reaction rate derived by Spracklen et al. (2011) results in a time constant of
∼1.5 days which is somewhat larger than observations. In order to cover a wide range of possible values and assess the sensitivity to this parameter, three rate constants are considered: k1 =5 ×10⁻¹²cm3molecules−1s−1, k2 = 1 × 10⁻¹²cm3molecules−1s−1 and k3 = 25×10−12cm3molecules−1s−1.
In addition, the formation of ASOA from the ageing of primary organic aerosols through the evaporation of POA and the oxidation of its vapors in the gas-phase (Robinson et al., 2007) is represented as a direct oxidation of POA to ASOA assuming the POA half-life time of 2 days. As
this ageing is OH-dependent, we introduced this dependence through the following reaction POA+OH->ASOA withk=
3×10⁻¹²cm3molecules−1s−1. This results in a timescale of∼2.5 days which is roughly consistent with observations and other model results (Dzepina et al., 2009; Spracklen et al., 2011). The ASOA produced by this pathway conserves the size distribution of its parent POA species. Note that the amount of anthropogenic SOA formed via direct POA oxida-tion is small, as most of the SOA in the Robinson mechanism is formed by oxidation of gas-phase species co-emitted with the POA.
A. Hodzic and J. L. Jimenez : Modeling anthropogenically controlled secondary organic aerosols in a megacity 907 2.4 Empirical approach for predicting
oxygen-to-carbon (O/C) ratios
In addition to parameterizing the SOA mass, we have also derived an empirical approach to compute the oxygen-to-carbon ratio for organic aerosols. The measured O/C ra-tio is a good indicator of the level of processing of the or-ganic material. Being able to accurately predict O/C ratios in models is of great importance for determining the hy-groscopicity of organic particles (Jimenez et al., 2009) and their effects on CCN activation and clouds. As previously, we have parameterized the ageing patterns observed in O/C ratio as illustrated in Fig. 1b to fit the O/C observations re-ported for Mexico City and its outflow region (Dzepina et al., 2011). Typically, the O/C atomic ratios vary from very low (∼0.1) for primary emitted organics, to levels close to 0.35–0.4 in freshly formed SOA, and up to 0.8–1 for aged air masses that contain more processed organic material. For this purpose the oxygen amount and its increase due to or-ganic aerosol ageing were explicitly modeled in the OPT simulation, adding an additional transported variable into the model. The increase in O/C ratios in SOA particles due to ageing of the aerosol was parameterized according to the fol-lowing equation: O/C=1−0.6exp(−A/1.5)whereA rep-resents the photochemical age of the airmass in days and 1.5 is the aging time scale for Mexico City conditions. At each model time step, we estimate the photochemical age of the existing aerosol material from the O/C ratios, and then fur-ther age the OA for the chemical time step proportionally to the incremental exposure ([OH]×time step) divided by the reference exposure (1.5 days×1.5×10⁶molecules cm−3). The O/C ratio for fossil POA is assumed to be equal to 0.1, whereas for the biomass burning value of 0.3 is used (De-Carlo et al., 2008).
2.5 Anthropogenically-enhanced SOA formation from biogenic precursors
Similar to Spracklen et al. (2011) we also test several sim-ple mechanisms to test whether a large enhancement of bio-genic SOA in presence of anthropobio-genic pollutants could ex-plain the spatial and temporal patterns of the SOA observed in and around Mexico City. Besides the enhanced oxidant levels due to pollution which are already accounted for by the default model formulation (Hodzic et al., 2009), pos-sible reasons for this enhanced BSOA formation are high aerosol acidity or NOxlevels (Hoyle et al., 2011; Spracklen et al., 2011). Following Spracklen et al. (2011), an acid-enhanced formation of SOA from terpenes and isoprene was represented using SO2as a surrogate for aerosol acidity (Ta-ble 2, Reactions 11–12). In addition a reaction with VOCA is used as a surrogate for reactions with anthropogenic pol-lution species with a lifetime of 1–2 days (including NOx) (Table 2, Reactions 13–14). We note that in Mexico the main sources of SO2(volcanoes and refineries, DeCarlo et
al., 2008) and VOCA (urban areas) are not collocated, so these two approaches should produce slightly different spa-tial patterns.
2.6 Model application
First, a set of 15 model simulations was carried out in or-der to estimate the optimum parameters for the VOCA/CO emission ratios and the rate constant for VOCA conversion into ASOA. The 24–30 March time period with low biomass burning influence (Aiken et al., 2010) was chosen to perform this comparison with AMS data. The same set of ground and airborne AMS data was used in this study as described in Hodzic et al. (2010a). Those include the urban T0 site, the suburban T1 site and the regional C130 flight of 29 March. For these comparisons, biogenic SOA formation was repre-sented as in Hodzic et al. (2009, 2010a), because this pa-rameterization was found to produce a reasonable amount of biogenic SOA when compared to biogenic SOA tracers and contemporary carbon data.
Second, the “optimum” simulation (hereafter referred to as OPT) using the optimized emission ratio and rate con-stant is performed for the 18–30 March time period, for which the first week includes high biomass burning influence (Aiken et al., 2010). The predicted SOA from the empiri-cal model is compared to the SOA results from our previous study (Hodzic et al., 2010a, referred as ROB) which used a more complex SOA module that accounts for SOA forma-tion from tradiforma-tional VOC using the 2-product tradiforma-tional ap-proach and from semi-volatile and intermediate-volatilities species using the approach of Robinson et al. (2007). The predicted SOA from the OPT simulation is also compared to the one modeled using the best-fit parameters from Spracklen et al. (2011), referred as the SPR simulation. For consistency with our previous simulations (ROB), the biogenic SOA is based on Hodzic et al. (2009). The evolution of O/C ratio was added to the OPT model and the simulation dedicated to evaluating the predicted O/C ratios against observations was performed from 16 to 25 March.
Finally, an additional simulation (TEST) was performed to investigate the NOx-dependent biogenic SOA formation and its potential enhancement under polluted conditions. Similar to Spracklen et al. (2011), this enhancement was parameter-ized in two alternative ways as discussed above. The bio-genic SOA predicted from this approach was compared to results from our previous work (Hodzic et al., 2009).
basis set require 18 product species in each aerosol size bin, and an additional 18 gas-phase species (total 162 species). For simulations that also track the oxygen to carbon ratio like in Hodzic et al. (2010a), the difference is even larger i.e. 27 vs. 324 species. Simulations using the simplified ba-sis set formulation of Shrivastava et al. (2010) would require 36 species, or 72 when oxygen to carbon ratio is also tracked.
3 Results and discussion
3.1 Selecting the optimum empirical parameterization for anthropogenic SOA
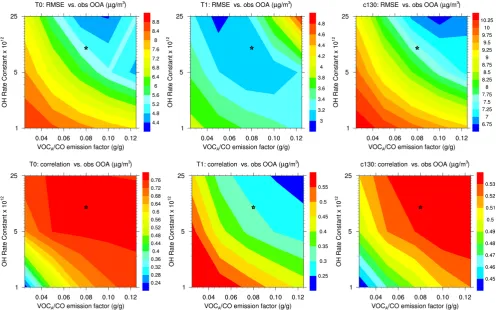
Figure 2 summarizes the statistical parameters of the model/measurement comparison for fifteen model runs in simulating SOA at the surface (T0, T1 sites) and in air aloft over the city and its outflow (C130 flight, 29 March), as a response to varying VOCA emissions (5 values) and oxidation rate constants (3 values). Each simulation was assessed against observed OOA concentrations using root mean square error and correlation coefficients as indica-tors of model skill, during the low biomass-burning pe-riod (24 to 30 March 2006). Emissions of VOCA/CO in the 0.05–0.10 g g−1 range and a rate constant at or above 5×10⁻¹²cm3molecules−1s−1 results generally in lower RMSEs and high correlation coefficients for 2 of the 3 datasets. At the T1 suburban site, however, the amount is matched well by the parameter range just discussed, but the correlation coefficient improves for very low emission and reaction rates. Given the overall results and the rela-tively wide response surfaces of the statistical parameters, we chose as the optimum combination of parameters for sim-ulating SOA from anthropogenically-dominated sources a VOCA/CO emission ratio of 0.08 g g−1and a rate constant of 1.25×10⁻¹¹cm3molecules−1s−1 (e-folding time constant
∼0.6 days in the typical Mexico City boundary layer). These values are within the range of the measurement-derived amounts and timescales (de Gouw and Jimenez, 2009; De-Carlo et al., 2010) and will be used to represent SOA forma-tion from anthropogenic and biomass burning sources in the rest of the paper (OPT simulation). As the merit functions are relatively broad and there is an anti-correlation between amount and timescale and most response surfaces, slightly different sets of parameters are likely to result in similar fits to the observations. This amount of anthropogenic SOA is not inconsistent with the Mexico City emission inventory. E.g. the ratio of VOCAto the traditional anthropogenic SOA precursors (aromatics, large alkanes) is 30 %. Note that with this implementation the amount of biomass burning SOA is about twice that observed by DeCarlo et al. (2010), which will compensate the underprediction of some biomass burn-ing events in the model (e.g. Hodzic et al., 2010b).
3.2 Spatiotemporal patterns and comparison to volatility basis set
In this section the skill of this empirical SOA module in re-producing the observed SOA levels is assessed against the AMS observations within the city and in the city plume, and against the results of the more complex VBS approach of Robinson et al. (2007) reported in Hodzic et al. (2010a). 3.2.1 SOA spatial distribution
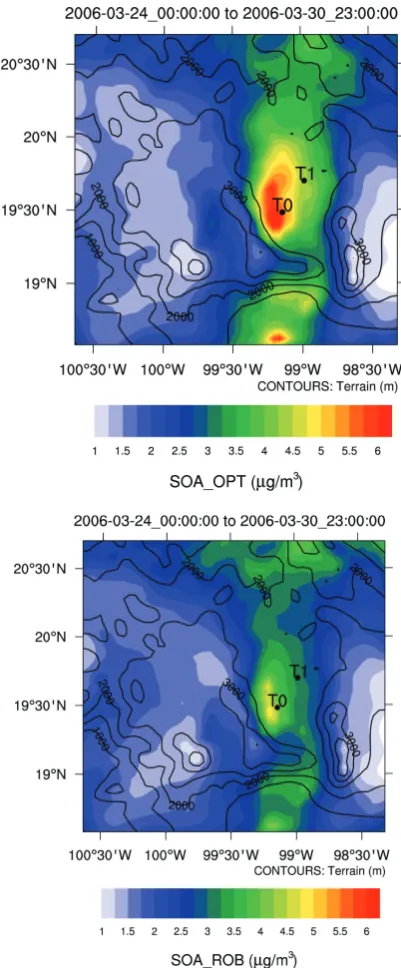
Figure 3 compares the predicted spatial distribution of an-thropogenic and biomass burning SOA surface concentra-tions averaged over the 24–30 March period. Similar spatial patterns of SOA concentrations are predicted for the OPT and ROB simulations for the urban and near outflow re-gions, with highest values associated with the Mexico City basin and downwind locations. The OPT model generates on average about∼6 µg m−3of SOA in downtown Mexico City, and∼3 µg m−3 downwind. The OPT simulation pre-dicts∼2 µg m−3higher peak SOA concentration over Mex-ico City in comparison to the ROB simulation. This differ-ence in averaged concentrations is mainly due to higher early afternoon concentrations predicted by OPT as illustrated in Fig. 4. In the outflow region to the north and south of Mex-ico City basin, the OPT and ROB simulations show simi-lar SOA concentrations. These simisimi-larities are expected as both mechanisms have result in amounts and timescales of the same order, whether SOA is directly generated from the first oxidation of precursor species and then transported as an inert species (OPT), or the SOA is produced from the multi-generational oxidation of organic vapors (ROB). The ageing of POA that is included in the OPT simulation does not in-crease significantly the SOA concentrations downwind at the considered spatial scale in this study (not shown here), as expected from the low POA/CO emission ratios of anthro-pogenic sources.
3.2.2 SOA temporal patterns
A. Hodzic and J. L. Jimenez : Modeling anthropogenically controlled secondary organic aerosols in a megacity 909
33
859
860
Figure 2: (Upper panel) Root mean square errors (RMSE) and (Lower panel) correlation coefficients for SOA predictions for 15 model 861
runs as a function of the VOCA surrogate emission factor and its oxidation rate constant. The statistical parameters are calculated for
862
the 24-30 March period, which is characterized by low biomass burning activity. Parameters used for the OPT simulation are also 863
indicated on each plot (star symbol). 864
Fig. 2. (Upper panel) Root mean square errors (RMSE) and (Lower panel) correlation coefficients for SOA predictions for 15 model runs as a
function of the VOCA surrogate emission factor and its oxidation rate constant. The statistical parameters are calculated for the 24–30 March period, which is characterized by low biomass burning activity. Parameters used for the OPT simulation are also indicated on each plot (star symbol).
(∼09:00–11:00 LT, ∼8–9 µg m−3) and the dilution in the growing afternoon boundary layer are remarkably well cap-tured by OPT. The predicted diurnal profile matches both in shape and amounts the OOA observations. The improve-ments with regard to ROB are mainly seen during the ini-tiation of the photochemistry (∼09:00 LT) and in the late afternoon (∼13:00–16:00 LT). Indeed, the SOA production starts more intensely (additional 3 µg m−3), and is main-tained throughout the afternoon in the OPT model while higher temperatures cause some SOA to evaporate in the ROB model. The temporal pattern of the urban observations in the afternoon is more similar to OPT than ROB, which is consistent with the lower volatility of the observed SOA compared to that produced by ROB (Cappa and Jimenez, 2010; Dzepina et al., 2011; Riipinen et al., 2011; Pierce et al., 2011). Finally, during the nighttime, the OPT predicted background concentrations are lower by 0.5–1 µg m−3than ROB. This is likely caused by enhanced partitioning of semi-volatile species to the particle phase in ROB at the lower temperature of this time period, while this effect is not cap-tured by the OPT model formulation. At the T1 suburban site (Fig. 4b), the OPT simulation has∼1 µg m−3lower bias and
a slightly higher correlation coefficient than ROB. The con-tribution of biomass-burning emissions to the predicted SOA stays relatively small during this period at both surface sites (not shown here). The average contribution to the total SOA approaches 0.5 µg m−3(<10 %), with the strongest influence from 20 to 22 March, consistent with previous observation-based estimates (Aiken et al., 2010).
Fig. 3. Spatial distribution of surface SOA concentrations (µg m−3) from anthropogenic and biomass burning precursors as predicted for OPT (a) and ROB (b) simulations in the vicinity of Mexico City between 24 and 30 March.
and are again slightly higher (∼30 %) than the predictions of the ROB simulation both within the urban plume and in the downwind region north of the city. Along the first air-craft leg (∼18:30–19:30 UTC) north of the city, the mea-sured SOA levels are reasonably well captured although in this region the SOA displays a strong spatial gradient. Sim-ilarly, the high OOA levels found within the urban plume (∼15–24 µg m−3)are also captured within 30 %, which is consistent to the results reported at the T0 downtown site.
3.2.3 Surrogate parameterization for the volatility basis set
The similarity with the ROB model results is even more strik-ing when a VOCA/CO emission ratio of 0.08 g g−1and a rate constant of 5×10⁻¹²cm3molecules−1s−1 are used. This set of parameters results in very similar overall timescales and amount of the ROB model (∼100 µg m−3ppmv−1 at standard temperature and pressure, 1.5 days, Dzepina et al., 2011). The results of this sensitivity run (“ROB-like”) are shown in Fig. 4. The intensity of the initial photochemi-cal SOA production is comparable in both runs within the city, whereas some differences can be seen later during the day, or at the downwind ground site T1 due to the higher SOA evaporation in ROB as discussed above. The compar-ison of the oxidant levels at T1 (not shown here), indicates that ROB-like simulation has 15 % higher OH concentrations than ROB. A very good match with the ROB simulation is also found along the C130 flight track, as the ROB predic-tions are less affected by the evaporation in the colder upper boundary air. Therefore, out ROB-like model can be used as a surrogate of the ROB model in e.g. global modeling appli-cations where minimizing computational burden is critical. 3.3 Comparison to results with global model-optimized
parameters
A. Hodzic and J. L. Jimenez : Modeling anthropogenically controlled secondary organic aerosols in a megacity 911
35 a
868
b 869
35 a
868
b 869
Fig. 4. Observed and predicted concentrations of secondary organic aerosols (OOA or SOA, µg m−3) at T0 (a), T1 (b), and along the C130 flight path of 29 March 2006 (c). Plots compare the OPT (red line), ROB (blue line), SPR (green line) and ROB-like (cyan line) model simulations, with the AMS measurements. For surface stations, the diurnal average profiles are also provided in addition to the time series. The variability associated with average observations and OPT model predictions is given in shaded area and red vertical bars, respectively. The C130 flight track for 29 March and the modeled SOA plume extent are also shown.
at longer aging times available for MILAGRO (e.g. DeCarlo et al., 2010) are more uncertain as described above and are also more affected by deposition processes which may lead to an apparent lower ambient ratio. However the timescales of the ambient observations and the lack of very high ambi-ent SOA/1CO ratios in ambient air during MILAGRO (other
This study shows however an important qualitative dis-crepancy with the conclusions of Spracklen et al. (2011) which suggested that 90 % of the predicted SOA mass was of biogenic origin. This would imply that only 1/10 of the simulated SOA mass with the SPR model as discussed above is actually from anthropogenic sources. This ratio appears to be clearly too small to reproduce the measured SOA down-town and in the vicinity of Mexico City (especially during the low biomass burning period) which bears the temporal and spatial signature of the urban area, and thus is almost certainly due mainly to urban sources. The effect of the en-hancement of biogenic SOA by anthropogenic pollution is explored further in Sect. 3.5.
3.4 Evaluation of predicted O/C ratios
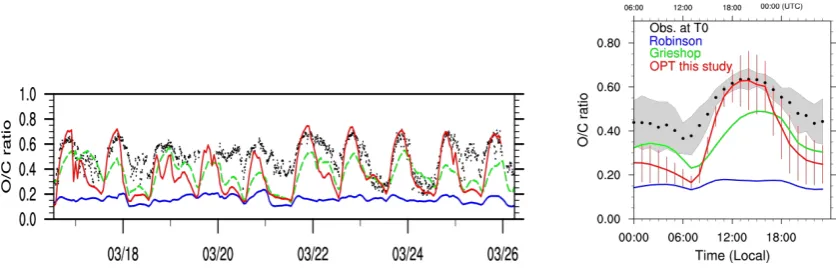
Figure 5 compares the simulated O/C ratios with estimated values derived from aerosol mass spectrometer measure-ments at T0. The observed O/C ratios range from 0.2 to 0.7 and display a strong diurnal variability with lower val-ues in the morning when the primary emissions from traffic and other sources exert a major influence, and higher val-ues during the daytime (∼12:00–16:00 LT) when more sec-ondary oxidized matter is being formed by photochemistry. The simulated O/C ratios arising from the OPT simulation show a reasonable agreement with the observed levels both in terms of magnitude and temporal variability. In particular, the ageing of the organic material during the afternoon hours seems to be well captured by this simplified approach as il-lustrated by the average diurnal profile. The nighttime O/C values are often underpredicted in the model, which is con-sistent with the fact that CHIMERE tends both to overpredict POA (with low O/C=0.1) during nighttime due to inefficient nighttime boundary layer mixing and underpredict the contri-bution of biomass burning during the late afternoon or early morning smoldering fires. Both of these issues are discussed in detail in Hodzic et al. (2009).
The result of our simulation is also noticeably closer to the observations than the predictions for the original volatility basis set treatment (Robinson et al., 2007) that had substan-tially lower O/C levels as discussed in Hodzic et al. (2010) and as illustrated in Fig. 5. Our results are however compa-rable to predictions of the Grieshop et al. (2009) volatility basis set approach shown in Hodzic et al. (2010) in which 40 % oxygen gain was assumed for each oxidation genera-tion of organic material. The processes leading to this rapid enrichment in oxygen within the first few hours of ageing are currently not understood from a mechanistic point of view.
3.5 Predicting the enhancement in regional biogenic SOA by pollution in Mexico City
3.5.1 Evaluation of the biogenic SOA treatment All the simulations described above used the biogenic SOA formulation of Hodzic et al. (2009), which showed good comparison with independent tracer-based estimates, and which does account implicitly for the enhancement in bio-genic SOA formation due to the higher oxidants (OH, O3, NO3)in polluted air. To evaluate the effect of an alternative biogenic SOA parameterization, within the context of current uncertainties in this area, the NOx-dependent 4-product bio-genic SOA formation has been included in this study follow-ing the methodology of Lane et al. (2008) and the updated yields from Tsimpidi et al. (2010). Figure 6 shows the pre-dicted diurnal profiles for biogenic SOA at T0 and T1 during the 24–30 March period. The predicted mass resulting from this new treatment varies between 0.2 and 0.3 µg m−3at both ground sites, as well as downwind of the city along the C130 flight track. These results are consistent with values reported by Shrivastava et al. (2010), which were based on the same approach.
Figure 6 also shows a large gap (i.e. factor of 4) between biogenic SOA predictions obtained by the Lane/Tsimpidi method, and those obtained using the approach in Hodzic et al. (2009). The differences arise mainly from the differences in the effective aerosol yields. For instance for isoprene, the Lane/Tsimpidi results in yields at 298 K and low NOx which are 0.7 % and 2.5 % at OA concentrations of 1 and 10 µg m−3, respectively, while the Hodzic et al. (2009) ap-proach produces yields of 2 % and 4.6 % at those concentra-tions (∼2–3 times higher). The difference is even larger for high NOxconditions and low organic mass (∼7 times). The observed differences are in the range of values reported by Carlton et al. (2010) for different published SOA estimates over the continental US. Their study summarizes that using a 4-product approach for isoprene SOA based on the high-NOx experiments of Pandis et al. (1991), Lane and Pandis (2007) found that summertime isoprene SOA contributes 7 % of predicted OA. However, when using the 2-product param-eterization of Henze and Seinfeld (2006) based on the low-NOxexperiments of Kroll et al. (2006), Zhang et al. (2007) showed that taking into account the isoprene SOA forma-tion increases simulated surface organic aerosol concentra-tions by 65 %. Clearly these very large uncertainties need to be the focus of future research.
3.5.2 Assessing the impact of anthropogenic pollutants on biogenic SOA formation
A. Hodzic and J. L. Jimenez : Modeling anthropogenically controlled secondary organic aerosols in a megacity 913
37
878
Figure 5: Time series and associated diurnal profiles of O/C ratios as derived from the aerosol mass
879
spectrometer measurement in downtown Mexico City (T0) and as predicted by the first order
880
parameterization derived in this study for the OPT simulation from 16 to 25 March 2006. The results
881
corresponding to the volatility basis set and already reported by Hodzic et al. (2010) are also plotted
882
for reference (i.e. using the VBS parameterizations of Robinson et al., 2007 in blue and Grieshop et
883
al., 2009 in green). The gray shaded areas and the red vertical bars indicate the variability associated
884
with the observations and the OPT model respectively.
885
886
a
887
Fig. 5. Time series and associated diurnal profiles of O/C ratios as derived from the aerosol mass spectrometer measurement in downtown
Mexico City (T0) and as predicted by the first order parameterization derived in this study for the OPT simulation from 16 to 25 March 2006. The results corresponding to the volatility basis set and already reported by Hodzic et al. (2010) are also plotted for reference (i.e. using parameterizations of Robinson et al., 2007 in blue and Grieshop et al., 2009 in green). The gray shaded areas and the red vertical bars indicate the variability associated with the observations and the OPT model respectively.
NOx-dependent Lane/Tsimpidi approach discussed above. The enhancement of BSOA due to the isoprene and terpene surrogate reaction with VOCAis close to 0.1 µg m−3at both ground sites, and to 0.1–0.5 aloft the city. A much larger enhancement is found for reactions involving SO2, with the total increase of about 2 µg m−3at the surface and up to 4-5 µg m−3aloft and downwind of the city. This potential en-hancement in biogenic SOA formation represents more than a factor of 10 increase as compared to the original BSOA formulation, or a factor of 2 increase with respect to results from Hodzic et al. (2009). However, the absolute amounts formed in our simulations are less robust quantities as they are conditioned by the reaction rates chosen to parameterize the enhancements, which were taken from the global study of Spracklen et al. (2011) and were selected to result in sub-stantial global SOA production.
More importantly, the difference in the spatiotemporal pat-terns between the enhanced BSOA concentrations and the observed OOA is a more robust indication that the anthro-pogenically enhanced BSOA does not dominate the SOA production in the vicinity of Mexico City. For instance in Fig. 6c, the C130 observations show a clear contrast be-tween lower regional OOA levels (∼8–10 µg m−3) and 3 times larger OOA peaks over the city. This contrast is not captured by the pollution-enhanced BSOA formation as the predicted BSOA levels are similar or larger downwind than within the city. The partitioning of biogenic SOA to the aerosol is somewhat increased due to the presence of ASOA within the city, but this effect is small according to the model. Figure 7 shows the average spatial distribution for the NOx-dependent biogenic SOA produced from OH oxidation of precursors, and the biogenic SOA produced by VOCA -and SO2- surrogate enhancements. BSOA displays higher concentrations south and southwest of Mexico City, and is likely originated from emissions on the coastal mountains
where isoprene and other biogenic precursors are most abun-dant (Hodzic et al., 2009). The strongest enhancement in BSOA in our modified model occurs due to presence of SO2, mainly south of the city where the biogenics are at their high-est levels, with values exceeding 4 µg m−3. Somewhat lower values are found in the city boundary layer (∼1–2 µg m−3), and to the north and northeast of the city (∼2–2.5 µg m−3). The BSOA enhancement resulting from the surrogate VOCA -enhanced reaction is more limited in terms of average val-ues, and it peaks south of Mexico City. The potential impact of anthropogenic pollution on the BSOA formation with our TEST mechanisms appears to be of a regional scale and to spread well beyond the city limits, producing a very different spatial pattern than the anthropogenic SOA (Fig. 3).
914 A. Hodzic and J. L. Jimenez : Modeling anthropogenically controlled secondary organic aerosols in a megacity
37 878
Figure 5: Time series and associated diurnal profiles of O/C ratios as derived from the aerosol mass 879
spectrometer measurement in downtown Mexico City (T0) and as predicted by the first order 880
parameterization derived in this study for the OPT simulation from 16 to 25 March 2006. The results 881
corresponding to the volatility basis set and already reported by Hodzic et al. (2010) are also plotted 882
for reference (i.e. using the VBS parameterizations of Robinson et al., 2007 in blue and Grieshop et 883
al., 2009 in green). The gray shaded areas and the red vertical bars indicate the variability associated 884
with the observations and the OPT model respectively. 885
886
a 887
38 b
888
889
c 890
Figure 6: Average diurnal profiles of submicron secondary organic aerosols (OOA or SOA,
891
μg m-3
) from biogenic origin as predicted during the 24-30 March comparison period at (a)
892
T0, (b) T1, and (c) time series along the C130 flight track of March 29, 2006. Black dots
893
represent the AMS measured OOA levels (given on the right-side Y-axis). Filled areas
894
Fig. 6. Average diurnal profiles of submicron secondary organic
aerosols (OOA or SOA, µg m−3) from biogenic origin as predicted during the 24–30 March comparison period at (a) T0, (b) T1, and
(c) time series along the C130 flight track of 29 March 2006. Black
dots represent the AMS measured OOA levels (given on the right-side Y-axis). Filled areas represent the BSOA formed from biogenic VOCs according to NOx-dependent Lane/Tsimpidi yields (blue), from terpenes and isoprene in presence of VOCA-enhanced reac-tions (red), and SO2-enhanced reactions (orange). The purple line represents BSOA levels as calculated by the OPT run and using low-NOxyields for isoprene based on Henze and Seinfeld (2006).
40 a
901
b 902
c 903
Figure 7: (a) Spatial distribution of biogenic SOA concentrations (μg m-3) as predicted from 904
isoprene and terpenes oxidation following Lane/Tsimpidi NOX-dependent yields (within the 905
OPT simulation) in the vicinity of Mexico City between 24 and 30 March. The BSOA
906
enhancement due to anthropogenically-enhanced reactions involving biogenic precursors
907
is quantified for (b) VOCA and (c) SO2 oxidations. The biogenic SOA concentrations are 908
vertically averaged from the surface up to 4 km altitude, and the results are taken from the
909
coarse scale model (at 36km horizontal resolution). Note the different color-scales in the
910
three graphs.
911
912
Fig. 7. (a) Spatial distribution of biogenic SOA concentrations
(µg m−3) as predicted from isoprene and terpenes oxidation follow-ing Lane/Tsimpidi NOx-dependent yields (within the OPT simu-lation) in the vicinity of Mexico City between 24 and 30 March. The BSOA enhancement due to anthropogenically-enhanced reac-tions involving biogenic precursors is quantified for (b) VOCAand
(c) SO2surrogate reactions. The biogenic SOA concentrations are vertically averaged from the surface up to 4 km altitude, and the results are taken from the coarse scale model (at 36 km horizontal resolution). Note the different color-scales in the three graphs.
A. Hodzic and J. L. Jimenez : Modeling anthropogenically controlled secondary organic aerosols in a megacity 915 4 Conclusions
In this study, we have used a regional chemistry-transport model and highly time-resolved AMS measurements in the Mexico City metropolitan area to derive and test an empirical SOA parameterization for anthropogenic and biomass burn-ing sources based on the measured ratio of organic aerosols to CO in aged airmasses and suitable for use in global and climate models. The main findings of the study are:
i. We have determined a set of parameters i.e. the emission factor of 0.08 g per g of CO for the emission surrogate, and a rate constant of 1.25×10⁻¹¹cm3molecule−1s−1 for its oxidation with OH, that captures the observed SOA mass within 30 % in the urban area, and down-wind. The predicted SOA is mainly anthropogenic as the contribution from biomass burning is less than 10 %. Our results also suggest in the source region, somewhat higher (lower) emissions coupled with slower (faster) timescales could also fit the data.
ii. We have shown that using a much larger emission fac-tor of 0.20 g per g of CO and a slower rate constant of 5×10⁻¹²cm3molecule−1s−1as advised by the recent global model study by Spracklen et al. (2011) leads to somewhat larger SOA production (∼10–30 %) in the near field. This difference is expected to reach a fac-tor of two after two days of atmospheric processing (aged airmasses). These very high SOA amounts ap-pear inconsistent with the far field data for MILAGRO, although the constraints are weaker and more research is needed in the far field from pollution sources to con-strain the total net SOA production amount.
iii. We have shown that our empirical approach can be used as a surrogate for a more complex volatility ba-sis set SOA approach of Robinson et al. (2007) in e.g. global modeling applications where minimizing com-putational burden is critical. The SOA amount and temporal evolution predicted using the emission fac-tor of 0.08 g per g of CO and the rate constant of 5×10⁻¹²cm3molecule−1s−1 are nearly identical to the results obtained by Hodzic et al. (2010a) for the full volatility basis set of Robinson et al. (2007) or the re-duced version of Shrivastava et al. (2010).
iv. Besides the reduced computational cost, the advantage of the present approach is that it is based on the observed SOA levels and processing time scales. Unlike Robin-son et al., or Shrivastava et al., approaches, our study does not introduce additional assumptions on the emis-sions of primary organic vapors, which are currently highly uncertain and not measured. In addition, this method can also be applied in regions where the emis-sions of SOA precursors are not available e.g. regions in India and China undergoing rapid economic develop-ment.
v. We have also demonstrated that the evolution of oxygen-to-carbon ratios can be parameterized in a sim-ple way, and used to predict the oxidation state of the organic material in this region. The O/C ratios and tem-poral evolution predicted using the simplified approach are in a slightly better agreement with observations than the results obtained by Hodzic et al. (2010a) for the full volatility basis set of Grieshop et al. (2009) that was assuming a 40 % oxygen gain upon every oxidation of organic vapors.
vi. We have also examined whether the potential enhance-ment of biogenic SOA production under polluted con-ditions may explain the observed spatio-temporal pat-terns and levels of SOA in and around Mexico City. As parameterized here the SO2-enhanced BSOA pro-duction is substantial. However this enhancement alone could not explain the spatio-temporal patterns of ob-served SOA in and around Mexico City, although it could contribute to the regional background concentra-tions. Our result does not imply that these interactions are not important in other regions or at the global scale, but that their relative impact is limited in this particular megacity where OA is dominated by anthropogenic and biomass burning sources.
Supplementary material related to this article is available online at:
http://www.geosci-model-dev.net/4/901/2011/ gmd-4-901-2011-supplement.pdf.
Acknowledgements. This research has been supported by the National Center for Atmospheric Research which is operated by the University Corporation for Atmospheric Re-search on behalf of the National Science Foundation, and by grants NOAA NA08OAR4310565, DOE (BER, ASR program) DEFG0208ER64627, and NSF ATM-0919189.
Edited by: O. Boucher
References
Aiken, A. C., de Foy, B., Wiedinmyer, C., DeCarlo, P. F., Ul-brich, I. M., Wehrli, M. N., Szidat, S., Prevot, A. S. H., Noda, J., Wacker, L., Volkamer, R., Fortner, E., Wang, J., Laskin, A., Shutthanandan, V., Zheng, J., Zhang, R., Paredes-Miranda, G., Arnott, W. P., Molina, L. T., Sosa, G., Querol, X., and Jimenez, J. L.: Mexico city aerosol analysis during MILAGRO using high resolution aerosol mass spectrometry at the urban supersite (T0) – Part 2: Analysis of the biomass burning contribution and the non-fossil carbon fraction, Atmos. Chem. Phys., 10, 5315–5341, doi:10.5194/acp-10-5315-2010, 2010.
J. S., Hubler, G., Neuman, J. A., Ryerson, T. B., Warneke, C., and Wilson, J. C, Sources of particulate matter in the northeast-ern United States in summer: 2. Evolution of chemical and mi-crophysical properties, J. Geophys. Res.-Atmos., 113, D08302, doi:10.1029/2007JD009241, 2008.
CAM (Comision Ambiental Metropolitana): Inventario de emi-siones 2002 de la zona metropolitana del valle de Mexico, Mex-ico, 2004.
Cappa, C. D. and Jimenez, J. L.: Quantitative estimates of the volatility of ambient organic aerosol, Atmos. Chem. Phys., 10, 5409–5424, doi:10.5194/acp-10-5409-2010, 2010.
Carlton, A. G., Pinder, R. W., and Bhave, P. V.: To what extent can biogenic SOA be controlled?, Environ. Sci. Technol., 44, 3376– 3380, 2010.
Cubison, M. J., Ortega, A. M., Hayes, P. L., Farmer, D. K., Day, D., Lechner, M. J., Brune, W. H., Apel, E., Diskin, G. S., Fisher, J. A., Fuelberg, H. E., Hecobian, A., Knapp, D. J., Mikoviny, T., Riemer, D., Sachse, G. W., Sessions, W., Weber, R. J., Wein-heimer, A. J., Wisthaler, A., and Jimenez, J. L.: Effects of aging on organic aerosol from open biomass burning smoke in aircraft and lab studies, Atmos. Chem. Phys. Discuss., 11, 12103–12140, doi:10.5194/acpd-11-12103-2011, 2011.
DeCarlo, P. F., Dunlea, E. J., Kimmel, J. R., Aiken, A. C., Sueper, D., Crounse, J., Wennberg, P. O., Emmons, L., Shinozuka, Y., Clarke, A., Zhou, J., Tomlinson, J., Collins, D. R., Knapp, D., Weinheimer, A. J., Montzka, D. D., Campos, T., and Jimenez, J. L.: Fast airborne aerosol size and chemistry measurements above Mexico City and Central Mexico during the MILAGRO campaign, Atmos. Chem. Phys., 8, 4027–4048, doi:10.5194/acp-8-4027-2008, 2008.
DeCarlo, P. F., Ulbrich, I. M., Crounse, J., de Foy, B., Dunlea, E. J., Aiken, A. C., Knapp, D., Weinheimer, A. J., Campos, T., Wennberg, P. O., and Jimenez, J. L.: Investigation of the sources and processing of organic aerosol over the Central Mex-ican Plateau from aircraft measurements during MILAGRO, At-mos. Chem. Phys., 10, 5257–5280, doi:10.5194/acp-10-5257-2010, 2010.
de Gouw, J. and Jimenez, J. L.: Organic aerosols in the earth’s at-mosphere, Environ. Sci. Technol., 43, 7614–7618, 2009. de Gouw, J. A., Middlebrook, A. M., Warneke, C., Goldan, P.
D., Kuster, W. C., Roberts, J. M., Fehsenfeld, F. C., Worsnop, D. R., Canagaratna, M. R., Pszenny, A. A. P., Keene, W. C., Marchewka, M., Bertman, S. B., and Bates, T. S.: Budget of organic carbon in a polluted atmosphere: Results from the New England air quality study in 2002, J. Geophys. Res., 110, D16305, doi:10.1029/2004JD005623, 2005.
Dzepina, K., Volkamer, R. M., Madronich, S., Tulet, P., Ulbrich, I. M., Zhang, Q., Cappa, C. D., Ziemann, P. J., and Jimenez, J. L.: Evaluation of recently-proposed secondary organic aerosol models for a case study in Mexico City, Atmos. Chem. Phys., 9, 5681–5709, doi:10.5194/acp-9-5681-2009, 2009.
Dzepina, K., Cappa, C. D., Volkamer, R. M., Madronich, S., De-Carlo, P. F., Zaveri, R. A., and Jimenez, J. L.: Modeling the multiday evolution and aging of secondary organic aerosol dur-ing MILAGRO 2006, Environ. Sci. Technol., 45, 3496-3503, doi:10.1021/es103186, 2011.
Grieshop, A. P., Logue, J. M., Donahue, N. M., and Robinson, A. L.: Laboratory investigation of photochemical oxidation of or-ganic aerosol from wood fires 1: measurement and simulation of
organic aerosol evolution, Atmos. Chem. Phys., 9, 1263–1277, doi:10.5194/acp-9-1263-2009, 2009.
Griffin, R. J., Chen, J. J., Carmody, K., Vutukuru, S., and Dab-dub, D.: Contribution of gas phase oxidation of volatile organic compounds to atmospheric carbon monoxide levels in two ar-eas of the United States, J. Geophys. Res.-Atmos., 112, D10S17, doi:10.1029/2006JD007602, 2007.
Guenther, A., Karl, T., Harley, P., Wiedinmyer, C., Palmer, P. I., and Geron, C.: Estimates of global terrestrial isoprene emissions using MEGAN (Model of Emissions of Gases and Aerosols from Nature), Atmos. Chem. Phys., 6, 3181–3210, doi:10.5194/acp-6-3181-2006, 2006.
Hallquist, M., Wenger, J. C., Baltensperger, U., Rudich, Y., Simp-son, D., Claeys, M., Dommen, J., Donahue, N. M., George, C., Goldstein, A. H., Hamilton, J. F., Herrmann, H., Hoff-mann, T., Iinuma, Y., Jang, M., Jenkin, M. E., Jimenez, J. L., Kiendler-Scharr, A., Maenhaut, W., McFiggans, G., Mentel, Th. F., Monod, A., Pr´evˆot, A. S. H., Seinfeld, J. H., Surratt, J. D., Szmigielski, R., and Wildt, J.: The formation, properties and impact of secondary organic aerosol: current and emerging is-sues, Atmos. Chem. Phys., 9, 5155–5236, doi:10.5194/acp-9-5155-2009, 2009.
Henze, D. K. and Seinfeld, J. H.: Global secondary organic aerosol from isoprene oxidation, Geophys. Res. Lett., 33, L09812, doi:10.1029/2006GL025976, 2006.
Hodzic, A., Jimenez, J. L., Madronich, S., Canagaratna, M. R., DeCarlo, P. F., Kleinman, L., and Fast, J.: Modeling organic aerosols in a megacity: potential contribution of semi-volatile and intermediate volatility primary organic compounds to sec-ondary organic aerosol formation, Atmos. Chem. Phys., 10, 5491–5514, doi:10.5194/acp-10-5491-2010, 2010a.
Hodzic, A., Jimenez, J. L., Pr´evˆot, A. S. H., Szidat, S., Fast, J. D., and Madronich, S.: Can 3-D models explain the observed fractions of fossil and non-fossil carbon in and near Mexico City?, Atmos. Chem. Phys., 10, 10997–11016, doi:10.5194/acp-10-10997-2010, 2010b.
Hodzic, A., Jimenez, J. L., Madronich, S., Aiken, A. C., Bessag-net, B., Curci, G., Fast, J., Lamarque, J.-F., Onasch, T. B., Roux, G., Schauer, J. J., Stone, E. A., and Ulbrich, I. M.: Modeling organic aerosols during MILAGRO: importance of biogenic sec-ondary organic aerosols, Atmos. Chem. Phys., 9, 6949–6981, doi:10.5194/acp-9-6949-2009, 2009.
Hoyle, C. R., Boy, M., Donahue, N. M., Fry, J. L., Glasius, M., Guenther, A., Hallar, A. G., Huff Hartz, K., Petters, M. D., Pet¨aj¨a, T., Rosenoern, T., and Sullivan, A. P.: A review of the an-thropogenic influence on biogenic secondary organic aerosol, At-mos. Chem. Phys., 11, 321–343, doi:10.5194/acp-11-321-2011, 2011.
Hudman, R. C., Murray, L. T., Jacob, D. J., Millet, D. B., Tur-quety, S., Wu, S., Blake, D. R., Goldstein, A. H., Holloway, J., and Sachse, G. W.: Biogenic versus anthropogenic sources of CO in the United States, Geophys. Res. Lett., 35, L04801, doi:10.1029/2007GL032393, 2008.
Kiehl, J. T.: Twentieth century climate model response and climate sensitivity, Geophys. Res. Lett., 34, L22710, doi:10.1029/2007GL031383, 2007.
A. Hodzic and J. L. Jimenez : Modeling anthropogenically controlled secondary organic aerosols in a megacity 917
and Jayne, J.: The time evolution of aerosol composition over the Mexico City plateau, Atmos. Chem. Phys., 8, 1559–1575, doi:10.5194/acp-8-1559-2008, 2008.
Kroll, J. H., Ng, N. L., Murphy, S. M., Flagan, R. C., and Sein-feld, J. H.: Secondary organic aerosol formation from isoprene photooxidation, Environ. Sci. Technol., 40, 1869–1877, 2006. Lane, T. E. and Pandis, S. N.: Predicted secondary organic aerosol
concentrations from the oxidation of isoprene in the Eastern United States, Environ. Sci. Technol., 41, 3984–3990, 2007. Lane, T. E., Donahue, N. M., and Pandis, S. N.: Effect of NOx
on secondary organic aerosol concentrations, Environ. Sci. Tech-nol., 42, 6022–6027, 2008.
Lee-Taylor, J., Madronich, S., Aumont, B., Camredon, M., Hodzic, A., Tyndall, G. S., Apel, E., and Zaveri, R. A.: Explicit mod-eling of organic chemistry and secondary organic aerosol parti-tioning for Mexico City and its outflow plume, Atmos. Chem. Phys. Discuss., 11, 17013–17070, doi:10.5194/acpd-11-17013-2011, 2011.
Molina, L. T., Kolb, C. E., de Foy, B., Lamb, B. K., Brune, W. H., Jimenez, J. L., Ramos-Villegas, R., Sarmiento, J., Paramo-Figueroa, V. H., Cardenas, B., Gutierrez-Avedoy, V., and Molina, M. J.: Air quality in North America’s most populous city – overview of the MCMA-2003 campaign, Atmos. Chem. Phys., 7, 2447–2473, doi:10.5194/acp-7-2447-2007, 2007.
Molina, L. T., Madronich, S., Gaffney, J. S., Apel, E., de Foy, B., Fast, J., Ferrare, R., Herndon, S., Jimenez, J. L., Lamb, B., Osornio-Vargas, A. R., Russell, P., Schauer, J. J., Stevens, P. S., Volkamer, R., and Zavala, M.: An overview of the MILA-GRO 2006 Campaign: Mexico City emissions and their trans-port and transformation, Atmos. Chem. Phys., 10, 8697–8760, doi:10.5194/acp-10-8697-2010, 2010.
Pandis, S. N., Paulson, S. E., Seinfeld, J. H., and Flagan, R. C.: Aerosol formation in the photooxidation of isoprene and beta-pinene, Atmos. Environ., 25, 997–1008, 1991.
Pierce, J. R., Riipinen, I., Kulmala, M., Ehn, M., Pet¨aj¨a, T., Junni-nen, H., Worsnop, D. R., and Donahue, N. M.: Quantification of the volatility of secondary organic compounds in ultrafine par-ticles during nucleation events, Atmos. Chem. Phys., 11, 9019– 9036, doi:10.5194/acp-11-9019-2011, 2011.
Pun, B.: Modeling secondary organic aerosol formation via multi-phase partitioning with molecular data. Environ. Sci. Technol., 40, 4722–4731, 2006.
Riipinen, I., Pierce, J. R., Yli-Juuti, T., Nieminen, T., H¨akkinen, S., Ehn, M., Junninen, H., Lehtipalo, K., Pet¨aj¨a, T., Slowik, J., Chang, R., Shantz, N. C., Abbatt, J., Leaitch, W. R., Kerminen, V.-M., Worsnop, D. R., Pandis, S. N., Donahue, N. M., and Kul-mala, M.: Organic condensation: a vital link connecting aerosol formation to cloud condensation nuclei (CCN) concentrations, Atmos. Chem. Phys., 11, 3865–3878, doi:10.5194/acp-11-3865-2011, 2011.
Robinson, A. L., Donahue, N. M., Shrivastava, M. K., Weitkamp, E. A., Sage, A. M., Grieshop, A. P., Lane, T. E., Pandis, S. N., and Pierce, J. R.: Rethinking organic aerosols: Semivolatile emis-sions and photochemical aging, Science, 315, 1259–1262, 2007.
Shrivastava, M., Fast, J., Easter, R., Gustafson Jr., W. I., Zaveri, R. A., Jimenez, J. L., Saide, P., and Hodzic, A.: Modeling organic aerosols in a megacity: comparison of simple and complex rep-resentations of the volatility basis set approach, Atmos. Chem. Phys., 11, 6639–6662, doi:10.5194/acp-11-6639-2011, 2011. Spracklen, D. V., Jimenez, J. L., Carslaw, K. S., Worsnop, D. R.,
Evans, M. J., Mann, G. W., Zhang, Q., Canagaratna, M. R., Al-lan, J., Coe, H., McFiggans, G., Rap, A., and Forster, P.: Aerosol mass spectrometer constraint on the global secondary organic aerosol budget, Atmos. Chem. Phys. Discuss., 11, 5699–5755, doi:10.5194/acpd-11-5699-2011, 2011.
Textor, C., Schulz, M., Guibert, S., Kinne, S., Balkanski, Y., Bauer, S., Berntsen, T., Berglen, T., Boucher, O., Chin, M., Dentener, F., Diehl, T., Easter, R., Feichter, H., Fillmore, D., Ghan, S., Gi-noux, P., Gong, S., Grini, A., Hendricks, J., Horowitz, L., Huang, P., Isaksen, I., Iversen, I., Kloster, S., Koch, D., Kirkev˚ag, A., Kristjansson, J. E., Krol, M., Lauer, A., Lamarque, J. F., Liu, X., Montanaro, V., Myhre, G., Penner, J., Pitari, G., Reddy, S., Seland, Ø., Stier, P., Takemura, T., and Tie, X.: Analysis and quantification of the diversities of aerosol life cycles within Ae-roCom, Atmos. Chem. Phys., 6, 1777–1813, doi:10.5194/acp-6-1777-2006, 2006.
Tsimpidi, A. P., Karydis, V. A., Zavala, M., Lei, W., Molina, L., Ulbrich, I. M., Jimenez, J. L., and Pandis, S. N.: Evaluation of the volatility basis-set approach for the simulation of organic aerosol formation in the Mexico City metropolitan area, Atmos. Chem. Phys., 10, 525–546, doi:10.5194/acp-10-525-2010, 2010. Wiedinmyer, C., Quayle, B., Geron, C., Belote, A., McKenzie, D.,
Zhang, X. Y., O’Neill, S., and Wynne, K. K.: Estimating emis-sions from fires in North America for air quality modeling, At-mos. Environ., 40, 3419–3432, 2006.
Yokelson, R. J., Crounse, J. D., DeCarlo, P. F., Karl, T., Urbanski, S., Atlas, E., Campos, T., Shinozuka, Y., Kapustin, V., Clarke, A. D., Weinheimer, A., Knapp, D. J., Montzka, D. D., Holloway, J., Weibring, P., Flocke, F., Zheng, W., Toohey, D., Wennberg, P. O., Wiedinmyer, C., Mauldin, L., Fried, A., Richter, D., Walega, J., Jimenez, J. L., Adachi, K., Buseck, P. R., Hall, S. R., and Shetter, R.: Emissions from biomass burning in the Yucatan, At-mos. Chem. Phys., 9, 5785–5812, doi:10.5194/acp-9-5785-2009, 2009.
Zavala, M., Herndon, S. C., Slott, R. S., Dunlea, E. J., Marr, L. C., Shorter, J. H., Zahniser, M., Knighton, W. B., Rogers, T. M., Kolb, C. E., Molina, L. T., and Molina, M. J.: Characterization of on-road vehicle emissions in the Mexico City Metropolitan Area using a mobile laboratory in chase and fleet average mea-surement modes during the MCMA-2003 field campaign, At-mos. Chem. Phys., 6, 5129–5142, doi:10.5194/acp-6-5129-2006, 2006.