Open Access
Research
Dimensional analysis of MINMOD leads to definition of the
disposition index of glucose regulation and improved simulation
algorithm
Aparna Nittala
1, Soumitra Ghosh
1, Darko Stefanovski
2, Richard Bergman
2and Xujing Wang*
1Address: 1Max McGee National Research Center for Juvenile Diabetes & Human and Molecular Genetics Center, Medical College of Wisconsin and Children's Research Institute of the Children's Hospital of Wisconsin, 8701 Watertown Plank Road, Milwaukee, Wl 53226, USA and 2Department of Physiology & Biophysics, Medicine, Biomedical Engineering Keck School of Medicine, Viterbi School of Engineering, University of Southern California, 1975 Zonal Avenue, Los Angeles, California 90089-9023, USA
Email: Aparna Nittala - [email protected]; Soumitra Ghosh - [email protected]; Darko Stefanovski - [email protected]; Richard Bergman - [email protected]; Xujing Wang* - [email protected]
* Corresponding author
Abstract
Background: Frequently Sampled Intravenous Glucose Tolerance Test (FSIVGTT) together with its mathematical model, the minimal model (MINMOD), have become important clinical tools to evaluate the metabolic control of glucose in humans. Dimensional analysis of the model is up to now not available.
Methods: A formal dimensional analysis of MINMOD was carried out and the degree of freedom of MINMOD was examined. Through re-expressing all state variable and parameters in terms of their reference scales, MINMOD was transformed into a dimensionless format. Previously defined physiological indices including insulin sensitivity, glucose effectiveness, and first and second phase insulin responses were re-examined in this new formulation. Further, the parameter estimation from FSIVGTT was implemented using both the dimensional and the dimensionless formulations of MINMOD, and the performances were compared utilizing Monte Carlo simulation as well as real human FSIVGTT data.
Results: The degree of freedom (DOF) of MINMOD was found to be 7. The model was maximally simplified in the dimensionless formulation that normalizes the variation in glucose and insulin during FSIVGTT. In the new formulation, the disposition index (Dl), a composite parameter known to be important in diabetes pathology, was naturally defined as one of the dimensionless parameters in the system. The numerical simulation using the dimensionless formulation led to a 1.5–5 fold gain in speed, and significantly improved accuracy and robustness in parameter estimation compared to the dimensional implementation.
Conclusion: Dimensional analysis of MINMOD led to simplification of the model, direct identification of the important composite factors in the dynamics of glucose metabolic control, and better simulations algorithms.
Published: 14 July 2006
BioMedical Engineering OnLine 2006, 5:44 doi:10.1186/1475-925X-5-44
Received: 07 May 2006 Accepted: 14 July 2006
This article is available from: http://www.biomedical-engineering-online.com/content/5/1/44 © 2006 Nittala et al; licensee BioMed Central Ltd.
Background
To mathematically model a physiological mechanism, the factors that govern its modus operandi can be taken as inde-pendent or deinde-pendent variables in the mathematical model and the behavior of the whole system be described by a set of simple or complex, differential or integral equa-tions. The minimal model of glucose regulation, MIN-MOD, is one such model. First formulated and introduced by Richard Bergman and colleagues, it describes the kinet-ics of plasma glucose and insulin during a Frequently Sampled Intravenous Glucose Tolerance Test (FSIVGTT), and allows dissection of the composite effects of insulin secretion and insulin sensitivity on glucose tolerance and risk for diabetes [1-3]. The model was termed as "mini-mal" for it was the least complex mathematical represen-tation that is capable of accounting for the observed dynamic relationship between insulin and glucose disap-pearance [1,2]. In FSIVGTT, after overnight fasting, indi-vidual subjects are given an initial infusion of glucose bolus of 300 mg/kg body weight at the beginning of the experiments. At periodic time intervals afterwards, blood samples for glucose and insulin measurement will be taken for up to 180 minutes -normally, every 2–5 minutes within the first 30 minutes, every 5–10 minutes for 30–60 minutes, and every 30 minutes from 60 to 180 minutes. Mathematically, the regulation of plasma glucose concen-tration G(t) was formulated to be [1-3]:
where Gb is the baseline glucose concentration, p1 is the insulin-independent glucose disappearance rate, and X(t) is an auxiliary function representing insulin-excitable tis-sue glucose uptake activity. It is proportional to the insu-lin concentration in a "remote" interstitial compartment (which was later shown to be the interstitial fluid [4]), and is described by
where lb is the baseline insulin concentration, p2 is the rate constant of the spontaneous decrease in X(t), and p3 is the rate of insulin-dependent increase in tissue X(t). The change in insulin is given by
where n is the disappearance rate of endogenous insulin, γ(G - h) t is the Insulin Delivery Rate (IDR) of second phase insulin secreted into the venous circulation (cor-rected for hepatic extraction), and h is the threshold value of glucose above which the endogenous insulin secretion
will be stimulated. Under stimulatory glucose exposure, insulin release from pancreas normally is biphasic. More details of the parameters used in MINMOD can be found in table 1B. The initial conditions are assumed to be: G(0) = G0, X(0) = 0, and I(0) = I0, and the equilibrium state is given by G(∞) = Gb, X(∞) = 0, and I(∞) = Ib. Using this model, parameter values can be estimated from FSIVGTT measurements, and four independent parameters can be derived that were believed to represent a comprehensive metabolic portrait of an individual [1,2,5]:
• Insulin sensitivity: , where cap dot
represents time derivative, and SS stands for steady state. This is a measure of the capability of insulin-stimulated glucose uptake.
• Glucose effectiveness: . It
measures the glucose facilitated, insulin-independent glu-cose uptake.
• First phase pancreatic responsiveness
, where AIR = (I0 - Ib)/n
(Acute Insulin Response) is the total insulin release dur-ing first phase [6], and φ1 measures first phase insulin release per unit rise of glucose above basal.
• Second phase pancreatic responsiveness φ2 = ∂2 (IDR 2)/
∂G∂t = γ, is the dependence of rate of rise of the 2nd phase
insulin secretion on glucose.
SI later led to the definition of the disposition index DI = SI * AIR [7,8] (notice that it is dimensionless). Bogardus and colleagues have demonstrated that Dl was an excel-lent predictor (prognostic index) for which individual will develop type 2 diabetes mellitus (T2DM) in the Pima native American population [9]. In addition, SI was found to possess greater heritability than indices defined by other models including the homeostasis or the fasting insulin model assessments [4,10]. The model is now the basis for a large number of laboratory and clinical investi-gations (~50 reports/year) [4,11]. According to the Amer-ican Diabetes Association Consensus Development Conference on insulin resistance [12], it is one of the only two methods (the other one is the euglycemic insulin clamp) that are recommended for assessing peripheral insulin resistance due to their satisfactory, consistent per-formance.
dG t
dt p G t Gb X t G t ( )
( ) ( ) ( ),
= − 1
(
−)
− (1A)dX t
dt p X t p I t Ib
( )
( ) ( ) ,
= − 2 + 3
(
−)
( )1BdI
dt = − ⋅ +n I γ(G h t− ) , ( )1C
S G
G I p p
I = ∂
∂ ∂ =
2
3
2 SS
S G
G p
p I p p
G = ∂
∂ SS= SS+ ∼ 3
2
1 1
φ1 0
0 0
= −
− = −
I I
n G G
AIR
G G
b
b b
Since the publication of MINMOD, its mathematical structure, system properties, as well as simulation tech-niques of its computer program have also been studied [11,13,14]. However, up to now, a dimensional analysis is still lacking. How many degrees of freedom (DOF) does a system described by MINMOD have? How many inde-pendent indices can be defined from the model to charac-terize the system? How many indices are needed to differentiate different pathological states of glucose meta-bolic control? These questions have not been examined in depth. In addition, in a mathematical model, each varia-ble or parameter has an associated dimension or unit that reflects its influence on the system behavior. One could carry out model analysis and computer simulation by tak-ing the parameters as they are, with their respective units, as has been done with MINMOD up till now. There are certain disadvantages with such approaches. The parame-ters do not necessarily have the same range of values. While some vary within a narrow scale, others may span a wide range such that the absolute values of these parame-ters can be extremely different from each other. This makes it difficult to compare the relative importance of the parameters in controlling the system properties, as there is no uniform scale – a reference scale – based on which all the parameters can be studied [15].
Dimensional analysis is a process to simplify mathemati-cal models expressed in differential equations [16,17]. The technique rescales every variable and parameters in terms of their intrinsic reference quantities so that the equations can be expressed in terms of dimensionless var-iables and parameters whose typical scales are all ~O(1) [16]. An intrinsic reference quantity is one that reflects the intrinsic value scale of the variable; it can be its basal or maximal value, or its dynamic range of variation, for example. This process reduces the number of variables by removing redundant degrees of freedom. Using it, one can analyze the behavior of the system regardless of the units used to measure the variables. The dimensionless formu-lation helps to identify the dominant terms in the equa-tions, as well as their interactions in the model behavior and their influence on the solution structure. It reveals which variables, or rates of change, can be thought of as small, or even 'negligible' relative to others. In addition, the process often reveals that some of the parameters do not affect the system's dynamic behavior independently, and they can be combined into dimensionless indices that reflect their collective effect. Such indices are usually the most effective predictors of system behavior. Examples include the Reynolds number (the ratio of the inertial force to the viscous force) in fluidics, the R number in epi-demiology of infections, and the ratio of tumor growth to normal growth in oncology. Furthermore, with dimen-sional analysis, one can rescale models to duplicate the behavior of the original system provided that the
govern-ing dimensionless parameters have the same values in the two systems [18]. This will allow the identification of scale-invariant parameters, and the translation between animal models and human studies.
In this paper we carry out dimensional analysis of MIN-MOD. We show that it leads to the direct identification of important pathological indices. Further, we implement the computer simulation of MINMOD using the dimen-sionless formulation of glucose regulation. Utilizing Monte Carlo simulation as well as real human FSIVGTT data, we compare the new implementation to the original dimensional implementation in terms of model fit, speed of convergence, accuracy of parameter estimation and robustness against noise.
Methods
Dimensional analysis of MINMOD
The dimensions of the state variables and parameters
The mathematical structure of MINMOD consists of two first-order ordinary differential equations (ODE) for glu-cose disappearance (equations 1A-B) and one first-order ODE for insulin kinetics (equation 1C). The state varia-bles and parameters along with their normal value ranges and units, as well as their dimensions in terms of the fun-damental units of mass (M), length (L) and time (T) are presented in table 1A and 1B.
There are totally 10 parameters (p1, p2, p3, n, γ, h, Gb, G0, lb, l0) in MINMOD, expressed in a total of 3 fundamental units. According to Buckingham's Pi theorem [17,19], the DOF of this system is 7, implying that the model can be described in a simplified form with 7 free dimensionless parameters. Usually there is more than one way to non-dimensionalize a multi-parameter model, and it is worth-while to make a choice that is meaningful and also maxi-mally simplifies the equations. For example, it would be worthwhile to carefully define the intrinsic reference scale for each quantity, such that all rescaled dimensionless quantities vary within the same order of magnitude in value.
Among the three state variables, only G(t) and l(t) can be measured. X(t), which reflects the amount of insulin in the interstitial compartment, cannot be measured directly. In addition, equation 1B can be solved with
. In FSIVGTT
X(0) = 0, it follows that .
Therefore we will focus on the reference choices for G and l, and explore and compare several means of non-dimen-sionalization of MINMOD.
X t( )=e−p t2 X( )0 +p e−p t t2
∫
ds ep s2 ( ( )I s −Ib)3 0
X t( )=p e3 −p t t
∫
ds ep s( ( )I s −Ib) 0Non-dimensionalization choice a, rescale time by the glucose disappearance rate
One natural choice to rescale G and l is with their baseline
values and define . In the model fitting of
FSIVGTT with MINMOD, we usually start with the second time point when the plasma glucose and insulin concen-trations have peaked after the initial glucose bolus. There-fore the initial values of G0 and I0 are also the maxima for the glucose and insulin secretion (during the second phase of endogenous insulin release, the insulin concen-tration can peak again, but normally with a much lower peak value than in the first phase release). Under this choice, the rescaled glucose and insulin concentration
vary between and , respectively. It might be
argued that in the effort to uptake the exogenous glucose, the system can overcorrect and reach a concentration lower than Gb before it reaches the equilibrium value of Gb. De Gaetano et al have carried out a steady state analy-sis of MINMOD, and showed that likely the system
approaches the steady state Gb from below [13]. Even if this is the case, the minimal value is still very close to Gb,
with .
There are two natural time scales in this system, 1/p1 the
time scale of the glucose disappearance on its own, and 1/ n the time scale of the insulin disappearance. If we chose to use 1/p1 to rescale time, equations 1A–1C become:
with τ = p1t,
G G
G I
I I
b b
= , =
[ ,1 G0]
Gb [ ,1 ]
0
I Ib
G Gb
min ∼1
dG
d X G
dX
d p X p I
dI
d n I G h
τ
τ
τ γ τ
= − + +
= − +
(
−)
= − ⋅ + −
( )
( )
( )
1 1
1 2
2 3
G G G h
h G I
I I X
X p p
p p p
p p I n
n p
b b b
b
= , = , = , = , = , = , =
1
2 2 1
3 3
12 1
Table 1A: State variables, their meanings, values ranges in humans, units, and dimensions in terms of the fundamental units of mass (M), length (L) and time (T).
Quantity Description Value and Unit Dimension
M L T
G(t) Plasma glucose concentration at time t ~100–300 mg/dl 1 -3 0
l(t) Plasma insulin concentration at time t ~10–30 μU/ml 1 -3 0
X(t) An auxiliary function proportional to insulin concentration in the interstitial compartment. ~0–10-3min-1 0 0 -1
Table 1B: Parameters in MINMOD.
Quantity Description Value and Unit Dimensions
M L T
p1 Insulin-independent glucose disappearance rate. Also known as glucose effectiveness (SG). ~10-2 min-1 0 0 -1 p2 Rate constant expressing the spontaneous decrease of tissue glucose uptake ability. ~10-2 min-1 0 0 -1 p3 Insulin-dependent increase in tissue glucose uptake ability, per unit of insulin concentration
excess over baseline insulin.
~10-5 min-2 (μU/ml)-1 -1 3 -2
n Disappearance rate of endogenous insulin. ~10-1 min-1 0 0 -1 γ Rate of second phase endogenous insulin secretion ~10-2–10-3 (μU/ml) min-2 0 0 -2
Gb Baseline plasma glucose ~100 mg/dl 1 -3 0
G0 Initial glucose concentration during FSIVGTT ~300 mg/dl 1 -3 0
h A threshold value (higher than basal) for plasma glucose above which the second phase insulin secretion is stimulated
~100 mg/dl 1 -3 0
lb Baseline plasma insulin ~10 μU/ml 1 -3 0
, and . The initial conditions become:
, and . All the barred
vari-ables and parameters are unitless. The number of free parameters in the system indeed reduces to 7:
, and [ 0].
Choice b, rescale time by the insulin disappearance rate
Similarly, we can rescale time by 1/n, the disappearance rate of endogenous insulin. In this choice the
dimension-less parameters are τ = nt,
, and , and the differential equations become
With initial conditions: (0) = 0, and (0) = 0. The
number of free parameters again reduces to 7 as expected:
, and 0.
Choice c, rescale to normalize the variation in glucose and insulin A more sophisticated choice is to rescale glucose and insu-lin in a way to ensure that they vary within the same scale,
by defining . Now ∈ [0,1],
and ∈ [0,1]. Normally insulin facilitated glucose disap-pearance is the major mode of glucose uptake, and insu-lin's own kinetics will directly impact on that. Therefore we chose to rescale time by the disappearance rate of endogenous insulin during first phase secretion: τ= nt. It follows that other parameters can be defined by:
,
and . The equations become:
where , and . The initial
condi-tions become: (0) = 1, and (0) = 1 and equilibrium
state has (∞) = 0, and (∞) = 0. Therefore both glucose and insulin vary within a unit range of [0, 1]. The 7 free
parameters are: , and 1. Among the three choices, choice c maximally simplifies the equations and the initial conditions.
Computer simulation of glucose disappearance in the dimensionless formulation
A computer program to simulate the glucose disappear-ance component of MINMOD is developed by us in Mat-lab using both the dimensional and the dimensionless formulations. For dimensionless implementation, the for-mulation in choice c was adopted. The minimization function Isqnonlin.m available in the optimization tool-box of Matlab was utilized for parameter estimation. The program flow is similar as described in figure 1 of [3], and the same weighting scheme of the measured data points is adopted. In the initial computer implementation of MIN-MOD reported in [3], both glucose and insulin profiles were fitted by the mathematical model (equations 1A– 1C). FSIVGTT and MINMOD were first developed utiliz-ing a dog model. Later, it was found that as humans are more insulin resistant [8], and more endogenous insulin secretion is needed to generate sufficient insulin action in order for the computer program to accurately estimate the model parameters. It was found that this demand was more imperative for assessment of insulin sensitivity in diabetic (both type 1 and type 2 diabetes) subjects, as these individuals exhibit diminished or absent insulin-secretory response and/or higher insulin resistance. To overcome this problem, modified FSIVGTT protocol was introduced where a second injection of 100–300 mg tolb-utamide [20] or 30 mU/kg body weight insulin [21] was infused 20 min after the initial glucose bolus. In these pro-tocols, while the glucose regulation can still be adequately described by equations 1A–1B, the insulin regulation will require modifications of the original model given in equa-γ = γ
p G I b b 12
G G G
Gb
( )0 = 0= 0 I I I
Ib
( )0 = 0= 0
p p n2, 3, , , ,γ h G0 I
G G G I I I X X n h h G p p n p p n p p n I
b b b b
= , = , = , = , 1 = 1, 2 = 2, 3= 32
γ = γ
n G I b b 2 dG
d p X G p
dX
d p X p I
dI
d I G h
τ
τ
τ γ τ
= − + + = − + − = − + − ( ) ( ) ( ) ( ) 1 1
2 3 1 3
G G I I
p p p1, 2, 3, , ,γ h G0 I
G G G
G G I
I I I I b b b b = − − = − − 0 0 , G I X X n h h G
G G p
p
n p
p
n p
p
n I I
b b b = = − − = = = − , , , , ( ) 0
1 1 2 2 3 32 0
γ = γ −
− n G G I I b b 2 0 0 dG
d p G X G G
dX
d p X p I
dI
d I I G h
τ
τ
τ γ τ
= − − + = − + = − + + − ( ) 1 1 2 3 1 4 ( ) ( ) ( ) G G G G b b 1 0 = − I I I I b b 1 0 = − G I G I
tion 1C. In view of the variations in FSIVGTT protocols presently used in clinical practice, later computer simula-tions of MINMOD mainly focused on the glucose regula-tion, and the estimation of parameters p1, p2 and p3 [5]. For the same reason and for simplicity, we implement our simulation algorithms only for the glucose regulation component. The relevant equations are
and .
Since we are only investigating the glucose regulation here, and will not estimate for the parameters involved in insulin secretion, we can for simplicity use a constant time scale t0 instead of n. A natural choice would be t0 = 60 min,
so that has the meaning of time in terms of hours,
and τ ∈ [0 3] during typical FSIVTT. The dimensionless parameters are then 1 = p1t0, 2 = p2t0, 3 = p3 (I0 - Ib),
and . The state variables are
and = Xt0, with initial conditions
(0) = 1 and (0) = 0. The program takes experimental insulin and glucose profiles G(t) and I(t) as inputs, esti-mates for [p1 p2 p3 G0] in the dimensional implementation; or calculates (τ) and (τ), and fits for [ 1 2 3 1] in the dimensionless implementation.
Monte Carlo simulation
The program flow chart for the Monte Carlo simulation is given in figure 1. Briefly, we first generated 100 simulated glucose and insulin temporal profiles using equation 1A– 1C of MINMOD, with parameters randomly distributed within the following ranges: p1 ∈ [1 4]·10-2 min-1, p
2 ∈
[1.5 2]·10-2 min-1, p
s ∈ [0.32 1.6]·10-5 min-2 (mU/l)-1, n ∈ [1 4]·10-1 min-1, γ ∈ [1 4]·10-3 (μU/ml) min-2, h ∈ [92
125] mg/dl, G0 ∈ [210 310] mg/dl, and I0 ∈ [100 125] μU/ ml. The basal levels of glucose and insulin were fixed at Gb
= 90 mg/dl, and Ib = 14 μU/ml. We then used the gener-ated profiles to fit for the parameters [p1 p2 p3 G0] in the dimensional formulation, and for [ 1 2 3 1] in the
dimensionless formulation. The fitting stringencies were set at ['TolFun', 1e-4, 'ToIX', 1e-4; 'MaxFunEvals', 1e6]. More details of these options of the Isqnonlin function can be found from Matlab's web site [22]. By default we adopted the Levenberg-Marquardt least-square minimiza-tion algorithm, though we have also tried the Gauss-New-ton method for error minimization and obtained similar results.
To assess the robustness of our algorithm against noise we have also added Gaussian noise at the levels of 1–10% to the glucose profile of these 100 data sets, and examined the ability of our program to recover the true values of the parameters.
Human FSIVGTT data
FSIVGTT data of 20 human subjects were kindly provided to us by the FUSION (Finland-United States Investigation Of Non-insulin-dependent diabetes mellitus) study group [23,24]. In this study healthy non-diabetic offspring of T2DM patients were recruited, and the tolbutamide mod-ified FSIVGTT protocol [20] was administered to the indi-viduals. Glucose and insulin were measured at 14 time points: 0, 2, 4, 8, 19, 22, 25, 30, 40, 50, 70, 100, 120, and 180 min. The initial values of the parameters were deter-mined using the same method as described in the Monte Carlo simulation flowchart in figure 1.
dG
dτ = −p G1 −X
(
G G+ 1)
dX
dτ = −p X2 +p I3
τ = t
t0
p p p t02
G G
G G
b
b
1 0 =
−
G G G
Gb
= ⎛ −
⎝
⎜ ⎞
⎠ ⎟
1 1 X
G X
I G p p p G
p p p G
Flowchart of the Monte Carlo simulation
Figure 1
Results
The dimensionless physiological indices in MINMOD Choice a
In this formulation, the insulin sensitivity index becomes
. The new definition
gives a value that is the original SI times the total basal insulin secretion during the time scale of the glucose facil-itated glucose uptake. The new index naturally includes both insulin sensitivity, and a measure of insulin secre-tion.
The Glucose effectiveness becomes .
p1 represents the dissipation rate of glucose without insu-lin regulation. It is natural that in its own scale it becomes of unit value.
The first phase pancreatic responsiveness is
. Notice that it can be also
writ-ten as , where
is the total endogenous insulin secretion during the first
phase response, and represents the total glucose
uptake due to glucose facilitated, insulin-independent
mechanism. Therefore represents their ratio normal-ized by their baseline levels. The second phase pancreatic responsiveness is
.
In the new formulation, all rate constants are normalized with the time scale of glucose facilitated glucose uptake, and measures of insulin secretion are normalized with respect to glucose uptake.
Choice b
The insulin sensitivity index is now
. In this formulation
the new index depends on both insulin sensitivity SI, and total basal insulin secretion during the first phase, which reflects pancreatic function. It is reminiscent of Dl. Two critical components are involved in the regulation of
plasma glucose: the pancreatic responsiveness (insulin release responding to changes in plasma glucose), and the efficiency of insulin facilitated glucose uptake (insulin
sensitivity). naturally includes both in its definition. Like Dl it has the potential to better characterize an indi-vidual's ability to regulate glucose than a measure of either component alone.
The glucose effectiveness becomes
. The new
index has the meaning of relative effectiveness of glucose facilitated glucose disappearance and insulin facilitated insulin disappearance.
The first phase pancreatic responsiveness
is now the ratio
between the variation in insulin and the variation in glu-cose during FSIVGTT. The second phase response is
. It reflects
the rate of second phase insulin secretion rise per unit glu-cose stimulus, normalized by insulin's own disappearance rate and the baseline levels of insulin and glucose.
Choice c
The dimensionless counterpart of the insulin sensitivity index is now
. Thus the
disposition index Dl, which has been found to be predic-tive of disease pathology [6,9], is naturally defined by the system.
The glucose effectiveness becomes
, which reflects the relative
effec-tiveness of glucose facilitated glucose disappearance and insulin facilitated insulin disappearance.
The first phase pancreatic responsiveness becomes
. This result implies that Dl can be
inter-preted as the insulin sensitivity at unit first phase insulin response. The second phase responsiveness is
S G G I p p p p I p S I p
I = ∂ b I b
∂ ∂ = = =
2
3
2 3
2 1 1
SS
S G
G p
G = ∂
∂ SS = 1=1
φ1 0 φ
0 1 1 1 1 = − − = I
n G p
G I
b
b
( )
φ1= 0 1
− ⎛ ⎝ ⎜ ⎞ ⎠ ⎟ AIR I
G G p
G b
b
b
( )/
AIR I I
n b
= 0−
G G p b 0 1 − φ1
φ2 2 2 τ γ γ φ
12
2 12 1 = ∂ (IDR )/∂ ∂ = =G =
p G I p G I b b b b S G G I p p p p I n S I n
I = ∂ b I b
∂ ∂ = = = 2 3 2 3 2 SS SI S G G p
p I p p n S n
G = ∂ G
∂ SS = SS− + = =
3
2
1 1 1
( ) / /
φ1 0 0 φ
0 1 1 1 = = − − =
I n G I
G n G I b b / ( ) Δ
φ2 2 2 τ γ γ2 φ2 2
1 = ∂ (IDR )/∂ ∂ = =G =
n G I n G I b b b b S G G I p p p p I I
n S AIR DI
I = ∂ b I
∂ ∂ = = − = = 2 3 2 3 2 0 i SS S G G p S n
G = ∂ G
∂ SS = 1=
φ1= Δ =1 Δ
. The
new index reflects the rate of second phase insulin secre-tion rise per unit glucose stimulus, normalized by insu-lin's own disappearance rate and the variation ranges of insulin and glucose.
This is by far the most natural choice to non-dimension-alize MINMOD. It normnon-dimension-alizes the variation in glucose and insulin. Out of the three choices, it leads to the most sim-plified expressions of model equations, initial conditions and steady state solution. Importantly, the new formula-tion directly leads to the definiformula-tion of Dl, and points out that it is an important index for the dynamic regulation of glucose.
Comparison of the Monte Carlo simulations Simulation performance
We have found that the simulation in dimensionless for-mulation is able to converge 20% faster, with mean number of iterations 6.4 ± 2.7 (Dim'less) versus 8.0 ± 1.4 (Dim'nl), p < 0.001 before converging. On average, each iteration in the dimensionless program also takes ~20% less time than one iteration in the dimensional program. On an Dell OptiPlex GX620 PC with Pentium® dual 3
GHz CPU and 2 GB of RAM, the average CPU times are 0.122 s/per iteration in the dimensionless implementa-tion versus a 0.159 s/per iteraimplementa-tion in the dimensional implementation. Therefore the dimensionless implemen-tation takes ~50% less simulation time.
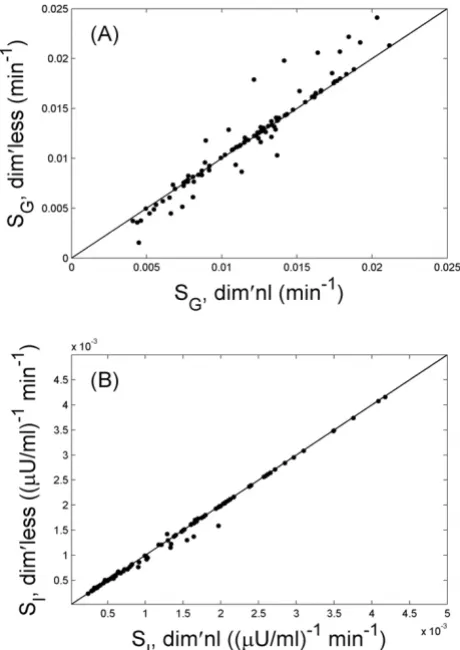
The parameter estimation from the two programs agree well, with correlation coefficients 0.96, 0.98, 0.97, and >0.99 for the estimated p1, p2 p3 and G0 values,
respec-tively. Figure 2 presents the estimated values of SG and SI, from the two implementations for all 100 data sets.
The precision in parameter estimation, reflected by their fractional standard deviation (FSD, defined as the ratio of standard deviation of the parameter-estimate to the mean value of the parameter-estimate), and goodness of fit R2
are not significantly different between the two implemen-tations. The results are summarized in table 2. Though the estimations of p2 and p3 seemed to be significantly off from their true values, the estimations of SI is much better in both dimensional and dimensionless implementa-tions.
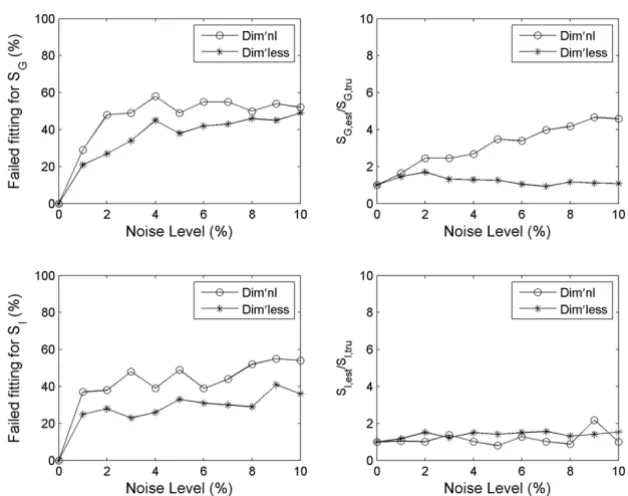
Robustness against noise
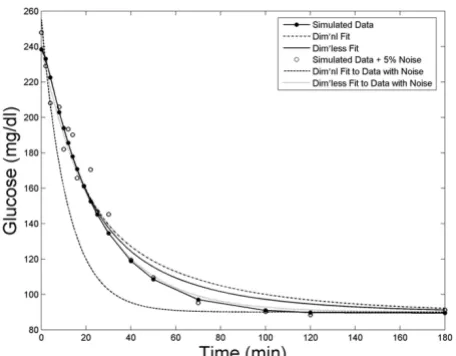
We have found that the dimensionless implementation of MINMOD is significantly more robust against noise. Fig-ure 3 presents the fitting by the two methods to one of the Monte Carlo glucose profiles, and to the same profile after 5% noise was added. It shows that the simulation using
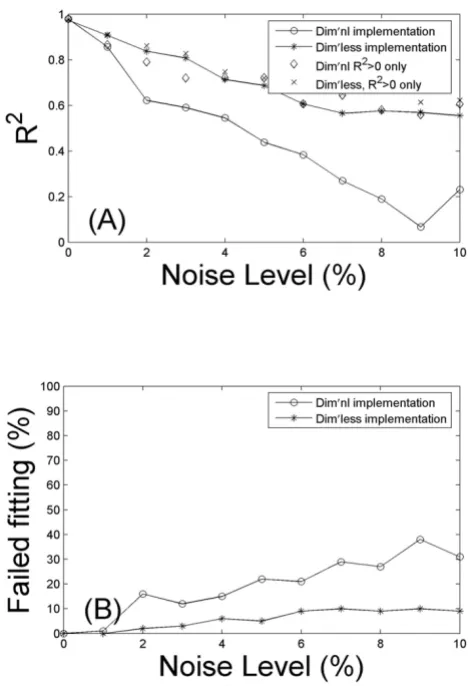
the dimensionless formulation of MINMOD was less sen-sitive to noise. When we examined the statistics from all 100 data sets, we found that this is a general feature. Fig-ure 4A presents the mean R2 of fitting, as a function of the
noise level. A better performance of the dimensionless implementation is evident.
When there is noise in the data, we observed that the pro-gram failed to converge in parameter estimation for some datasets within the default tolerance. The number of failed fitting goes up with increasing amount of noise. In real clinical/laboratory set up, noise in measurements are unavoidable, and it may have been a major factor that contributed to failure of parameter fitting some investiga-tors have experienced with MINMOD [25,26]. Using a threshold of R2 > 0, the failure rate is plotted against the
noise level in figure 4B. Clearly, the simulation using the dimensionless formulation of MINMOD is significantly φ
τ γ
γ φ
2 2
2
2 0
0
2 2 0 0 1 =∂
∂ ∂ = =
−
− =
− − (IDR )
G
G G
I I
G G
I I
b
b
b
b
n n
The comparison of parameter estimations for SG (A) and SI (B) between the simulations using the dimensional (dim'nl) and the dimensionless (dim'less) formulation of MINMOD
Figure 2
The comparison of parameter estimations for SG (A) and SI
more robust. We have also calculated the mean R2 after
removing the failed fittings. The performance of dimen-sionless method is still better (figure 4A).
When there is noise, the dimensionless implementation is also able to better recover the true values of the parame-ters. In figure 5 we plot the ratio between estimated values of SG (top panels), SI (bottom panels) and their true values (the values used to generate the simulated data), at 1% noise level. Both methods were able to obtain reasonable good parameter estimation for majority of the data sets. However, there are some data sets where the estimated parameters were orders of magnitudes away from the true values. Using a 5 fold difference from true value as a cut off value, the number of failed parameter estimations is plotted against the noise level in figure 6. Overall the
dimensionless implementation is able to better recover the true value (p < 0.001 for both SG and SI). It is worth pointing out that the data sets that failed in parameter estimations do not overlap completely with those that failed to reach a positive R2. There are some data sets
which upon the addition of noise led to erroneous param-eter estimations, but the fitting was reasonable with R2 >
0.8.
After removing data sets with erroneous parameter mations, we have calculated the mean ratio of the esti-mated SG and SI to their true values, and plotted their values against noise levels in the right panels of figure 6 (normalized by the first data points). The estimation in SG is more robust with the dimensionless method, whilst no significant difference was observed for the SI estimation.
Human FSIVGTT data
Overall it takes many more iterations to fit the human FSIVGTT data than the simulated data. The improvement in speed with the dimensionless implementation is more significant in human data: 14.8 ± 8.8 iterations versus 36.3 ± 74.8 iterations, a 2.5 fold reduction with p = 0.02. Interestingly, the gain in CPU time per iteration is also more significant. Using the same PC, it is 0.115 s versus 0.210 s per iteration, leading to an almost 5 fold gain in CPU time.
Figure 7 compares the contour plot of convergence between the two methods for subject 9. Contour plot of a non-linear least square minimization problem can help understand the nature of convergence, the magnitude of error and the number of iterations for both dimensional and dimensionless models implemented. In it the con-tours represent the values of the cost function (in this case, the norm of the error between the experimental and pre-dicted glucose profiles) after each minimization iteration. As we can see from the figure, starting from the iteration 1, the cost function slowly decreases its magnitude and
An example of model fitting to the Monte Carlo simulation data
Figure 3
An example of model fitting to the Monte Carlo simulation data. The fitting algorithm using the dimensionless formula-tion of MINMOD is able to achieve better fit to data, and is less sensitive to noise.
Table 2: Comparison between the dimensional and the dimensionless implementation of MINMOD. Results are from 100 Monte Carlo simulations.
Comparisons Dimensional Dimensionless Significance
Number of iterations 8.0 ± 1.4 6.4 ± 2.7 P < 0.001
R2 0.97 ± 0.02 0.97 ± 0.03 N.S
p1 % difference from true value (53.2 ± 7.6)% (53.2 ± 9.6)% N.S. p1, FSD of estimation (14.1 ± 2.7)% (14.9 ± 6.0)% N.S
p2, % difference from true value (188 ± 160)% (187 ± 155)% N.S.
p2, FSD of estimation (11.6 ± 1.6)% (12.1 ± 3.5)% N.S
p3, % difference from true value (513 ± 324)% (505 ± 317)% N.S.
p3, FSD of estimation (11.6 ± 1.7)% (12.1 ± 3.5)% N.S G0, % difference from true value (1.3 ± 0.4)% (1.3 ± 0.4)% N.S.
G0, FSD of estimation (0.1 ± 0.04)% (0.1 ± 0.06)% N.S
changes its color from "red" to "blue". The simulation using the dimensionless formulation of MINMOD exhib-its much faster convergence to the cost-function minimi-zation than the dimensional formulation.
Out of the 20 subjects, dimensional implementation failed to reach a fit (R2 < 0) for one individual (subject 2),
whilst the dimensionless implementation was able to reach a good fit with R2 = 0.93. We have played with
dif-ferent initial conditions to see that if the fitting by the dimensional program can be salvaged. With 4 different sets of initial parameter values, only one led to positive fit-ting with R2 = 0.84, a value that is still significantly lower
than what can be achieved with the dimensionless
pro-gram. Figure 8 shows the fitting results for this subject when both methods reached a positive fitting. A close examination of its glucose profile indicated that the meas-urements were most likely compromised with noise. From 8 to 25 min the glucose rose unexpectedly while it should drop monotonically. This result is consistent with our findings in the Monte Carlo simulation where the dimensional implementation is found to be more sensi-tive to noise.
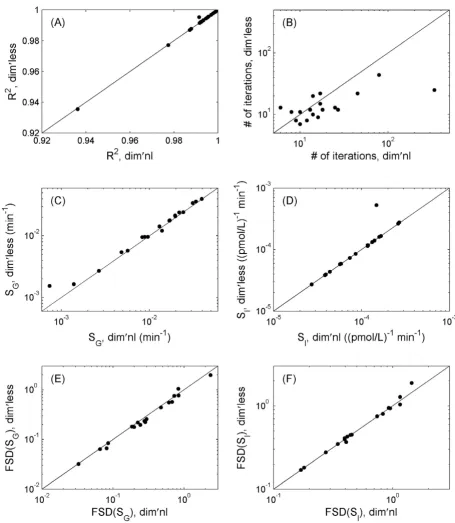
Excluding subject 2, Figure 9 presents the results for the remaining 19 individuals using both dimensional and dimensionless implementation, including the goodness of fit R2, the number of iterations before reaching the fit,
the estimated SG and SI, and the FSD of the parameter esti-mations. All data sets can achieve high R2, 0.991 ± 0.014
(Dim'less) versus 0.991 ± 0.015 (Dim'nl).
The estimations in SG and SI by the two approaches corre-late highly (figures 9C–9D), with correlation coefficient 0.991 and 0.999 respectively. There is a consistent small difference in SG estimation, with the values derived using the dimensionless implementation ~11.9% higher on average than the dimensional implementation (p = 0.002). There is no difference in SI estimation (p = 0.33). The FSD in the parameter estimation also correlate well (figures 9E–9F). The FSD in SG estimation in the dimen-sionless implementation exhibits a significant (p = 0.007) albeit small improvement over the dimensional counter-part, suggesting that the higher SG value derived by the dimensionless implementation could be more accurate. The FSD in SI is not different (p = 0.26). All p values were obtained using the paired t-test on the logarithm trans-formed data, as the distribution of the transtrans-formed data is much less skewed (which can be seen from figure 9).
Discussion
In diabetes research and clinical practice, it is very impor-tant to assess β cell function and insulin sensitivity, so as to evaluate the pathological status and risk of an individ-ual. Many tests have been designed, and numerous indi-ces have been defined. Using insulin sensitivity as an example, over a dozen have been experimented [27,28], none has been deemed best at predicting disease risk. These indices were all associated with certain units by def-inition. Some (Cederholm index [29] for example) would include several constants in the definition to accommo-date the conversion between different units in measuring glucose or insulin concentration. Some indices are very similar by nature, like the Gutt index [30] and the Ceder-holm index [29], but can appear to be quite different as the same quantities were defined in different units. There-fore, when using these indices one must follow exactly their proposed forms and the glucose/insulin concentra-tion units in order to obtain meaningful results. These
Comparison of the robustness against noise
Figure 4
Comparison of the robustness against noise. Data shown are the results from 100 Monte Carlo simulations, with 0–10% noise added. (A) The average goodness-of-fit R2 is plotted
against the noise level. Overall the dimensionless implemen-tation is able to achieve better model fitting at all noise levels. (B) The number of failed fitting (defined to be those with R2 <
make the utilization of and the comparison between dif-ferent indices extremely clumsy. A dimensional analysis and definition of dimensionless parameters will eliminate most of the problems. In addition, it has been found that a combination of several measures could predict disease risk better than individual ones [31]. However, it is not clear how many measures are needed for best prediction.
As we have stated in the background section, a dimen-sional analysis can help us to further understand the model structure, identify the degree of freedom in the model and a non-redundant set of dimensionless param-eters that together determines the dynamics of system and its sensitivity to pathological changes. Specifically, our analysis of MINMOD revealed that it has seven DOF, hence a full description of the metabolic control of
glu-cose tolerance requires seven independent dimensionless parameters. It further offers a candidate set for the seven
free parameters, which includes , and
1. In the original analysis of FSIVGTT by dimensional
MINMOD [1,2,5], four metabolic indices (SI, SG, φ1 and φ2) were defined that utilized only three of the seven DOF
( 1, , and ). Four additional DOF remain to be
explored: , 1, 1, and a combination of 2 and 3
that is independent of ( for example). These
additional indices together with the ones that have already been utilized can potentially offer a better, more complete description of the metabolic control of glucose
p p p1, 2, 3, , ,γ h G1
I
p p
p
3
2
γ
h G I p p
p p
3
2
p p2i 3
The ratio between estimated and true values of SG (top panels) and SI (bottom panels) is compared between the dimensional (left panels) and dimensionless implementation (right panels), for the 100 data sets with 1% noise
Figure 5
Comparison of the robustness in parameter estimation
Figure 6
Comparison of the robustness in parameter estimation. The right panels show the number of failed estimations (defined by > 5 fold difference with the true values) for SG and SI as functions of noise level. The dimensionless implementation is better at recovering the true values of the parameters. The right panels plot the ratio of the estimated to true parameter values for those after removing failed fittings. The data points at 0% noise was normalized to one.
Contour plot of convergence in error minimization versus the number of iterations, for subject 9 in the FUSION data set
Figure 7
Contour plot of convergence in error minimization versus the number of iterations, for subject 9 in the FUSION data set. The levels of the cost-function in the contour plot are represented through their color, and is labeled on each con-tour. Top: Simulation using the dimensional formulation. Bot-tom: Simulation using the dimensionless formulation.
An example (subject 2) of the glucose measurements of the FUSION FSIVGTT data, and the model fittings using both dimensional and dimensionless formulation of MINMOD
Figure 8
Comparison of the model fitting between the two methods for the FUSION data sets
Figure 9
Comparison of the model fitting between the two methods for the FUSION data sets. (A) R2. (B) Number of iterations it takes
in humans, as well as its dysfunctions under pathological conditions. We hypothesize that together the complete set of seven DOF could lead to more accurate disease risk pre-diction.
Existing evidence from clinical reports have indicated the relevance of the additional four indices. 1 or 1 each by itself could be a meaningful index, as they each reflect the basal glucose or insulin level with respect their dynamic range of change. An alternative index of glucose
effective-ness that has been in use is [32], where
D is the glucose bolus dose (mg/kg), AUC is the area-under-curve of the glucose concentration excursion above
basal. 1 is related to it by , where
is the ratio between total basal glucose uptake and
the glucose bolus dose. The product of 1 and 1 is also
of interest, as , where HOMA =
Gb·Ib is the HOmeostasis Model Assessment of the steady
state β cell function and insulin sensitivity [33]. Recently, a new composite index for insulin sensitivity defined
using both and p2 was investigated [34].
There-fore it would be of interest to explore the physiological meaning of the remaining 4 DOF further, and their poten-tial as disease markers.
The fitting failure rate in the Monte Carlo simulation is high. This is expected to improve if we implement more sophisticated initial parameter value estimation and base-line correction algorithms, as found in [5]. In addition, the model fitting to the 20 FUSION subjects seems to be much better than the fitting of the Monte Carlo data sets at any noise levels, with higher R2 values, less failure rate
and better agreements between the two methods. This is likely due to the fact that the FUSION used the modified FSIVGTT protocol, which is known to lead to better parameter estimation. As insulin secretion mechanism in modified protocol is not known, it is not possible to run a Monte Carlo simulation for the modified protocol.
Conclusion
In this work we performed dimensional analysis of MIN-MOD. We found that with a non-dimensionalization choice that normalizes the variation in glucose and insu-lin during FSIVGTT, the pathologically important Dl
index is naturally defined in the model and it has the meaning of the insulin sensitivity at unit first phase pan-creas response. Several additional dimensionless indices were also defined, which potentially offer means to better characterize the metabolic control of glucose and its dys-regulation under pathological conditions. In addition, we have explored the advantages of computer simulation of MINMOD using its dimensionless formulation. Using simulated data as well as real human FSIVGTT data, we found that whilst the new approach gives highly correla-tive (correlation coefficients all above 0.96) parameter estimations to the original dimensional formulation, it led to significantly improved simulation speed and is much more robust against noise.
Authors' contributions
XW drafted the initial study design. AP and XW performed the mathematical analysis, coding and the numerical sim-ulation, and drafted the manuscript. SG and RB contrib-uted to the discussion and the interpretation of results. All authors shared discussions and participated in finalizing study designs and in manuscript writing. All authors read and approved the final manuscript.
Acknowledgements
This work is supported in part by a special fund from Children's Hospital Foundation, Children's Research Institute of Wisconsin and Children's Hospital of Wisconsin. We thank FUSION group, specially, Dr. Heather Stringham, for providing the FSIVGTT data.
References
1. Bergman RN, Ider YZ, Bowden CR, Cobelli C: Quantitative esti-mation of insulin sensitivity. Am J Physiol 1979, 236(6):E667-677. 2. Toffolo G, Bergman RN, Finegood DT, Bowden CR, Cobelli C: Quantitative estimation of beta cell sensitivity to glucose in the intact organism: a minimal model of insulin kinetics in the dog. Diabetes 1980, 29(12):979-990.
3. Pacini G, Bergman RN: MINMOD: a computer program to cal-culate insulin sensitivity and pancreatic responsivity from the frequently sampled intravenous glucose tolerance test.
Comput Methods Programs Biomed 1986, 23(2):113-122.
4. Bergman RN: Minimal model: perspective from 2005. Horm Res
2005, 64(Suppl 3):8-15.
5. Boston RC, Stefanovski D, Moate PJ, Sumner AE, Watanabe RM, Bergman RN: MINMOD Millennium: a computer program to calculate glucose effectiveness and insulin sensitivity from the frequently sampled intravenous glucose tolerance test.
Diabetes Technol Ther 2003, 5(6):1003-1015. 6. Bergman RN: Lilly lecture 1989. Toward physiological under-standing of glucose tolerance. Minimal-model approach. Dia-betes 1989, 38(12):1512-1527.
7. Kahn SE, Prigeon RL, McCulloch DK, Boyko EJ, Bergman RN, Schwartz MW, Neifing JL, Ward WK, Beard JC, Palmer JP, et al.: Quantification of the relationship between insulin sensitivity and beta-cell function in human subjects. Evidence for a hyperbolic function. Diabetes 1993, 42(11):1663-1672.
8. Bergman RN: The minimal model of glucose regulation: a biography. Adv Exp Med Biol 2003, 537:1-19.
9. Weyer C, Bogardus C, Mott DM, Pratley RE: The natural history of insulin secretory dysfunction and insulin resistance in the pathogenesis of type 2 diabetes mellitus. J Clin Invest 1999, 104(6):787-794.
10. Bergman RN, Zaccaro DJ, Watanabe RM, Haffner SM, Saad MF, Nor-ris JM, Wagenknecht LE, Hokanson JE, Rotter Jl, Rich SS: Minimal model-based insulin sensitivity has greater heritability and a
G I
GE D
AUC G t
=
[Δ ( )]
G G GEG p
D b
1= 1
/
G p
D
b/ 1
G I
I G HOMA
G Gb I Ib
1 1
0 0
=
− −
( )( )
S p
p
I = 3
Publish with BioMed Central and every scientist can read your work free of charge "BioMed Central will be the most significant development for disseminating the results of biomedical researc h in our lifetime."
Sir Paul Nurse, Cancer Research UK
Your research papers will be:
available free of charge to the entire biomedical community
peer reviewed and published immediately upon acceptance
cited in PubMed and archived on PubMed Central
yours — you keep the copyright
Submit your manuscript here:
http://www.biomedcentral.com/info/publishing_adv.asp
BioMedcentral
different genetic basis than homeostasis model assessment or fasting insulin. Diabetes 2003, 52(8):2168-2174.
11. Bergman RB, Mucking K, Watanabe RM: measureing insulin action in vivo. In International textbook of diabetes mellitus Edited by: DeFronzo RA, Ferrannini E, Keen K, Zimmet P. John Wiley & Sons, Ltd; 2004:303-318.
12. Consensus Development Conference on Insulin Resistance. 5–6 November 1997. American Diabetes Association. Diabe-tes Care 1998, 21(2):310-314.
13. De Gaetano A, Arino O: Mathematical modelling of the intra-venous glucose tolerance test. J Math Biol 2000, 40(2):136-168. 14. Pillonetto G, Sparacino G, Cobelli C: Numerical non-identiflabil-ity regions of the minimal model of glucose kinetics: superi-ority of Bayesian estimation. Math Biosci 2003, 184(1):53-67. 15. Segel LA: simplification and scaling. Society for Industrial and
Applied Mathematics Review 1972, 14(4):547-571.
16. Lin CC, Segel LA: Simplification, dimensional analysis, and scal-ing. In Mathematics applied to deterministic problems in the natural sci-ences Philadelphia: SIAM; 1988:185-223.
17. Edelstein-Keshet L: Mathematical Models in Biology. SIAM Clas-sics in Applied Mathematics 2004.
18. Rosen R: Role of similarity principles in data extrapolation.
Am J Physiol 1983, 244(5):R591-599.
19. Buckingham E: Illustrations of the Use of Dimensional Equa-tions. Physical Review 1914, 4:345-376.
20. Welch NS, Gebhart SSP, Bergman RB: Modification of IVGTT-derived insulin sensitivity for applicability in diabetic sub-jects. Diabetes 1987, 36(Suppl 1):15A.
21. Pacini G, Tonolo G, Sambataro M, Maioli M, Ciccarese M, Brocco E, Avogaro A, Nosadini R: Insulin sensitivity and glucose effective-ness: minimal model analysis of regular and insulin-modified FSIGT. Am J Physiol 1998, 274(4 Pt 1):E592-599.
22. [http://www.mathworks.com/access/helpdesk/help/toolbox/optim/ ug/isqnonlin.html].
23. Ghosh S, Watanabe RM, Valle TT, Hauser ER, Magnuson VL, Langefeld CD, Ally DS, Mohlke KL, Silander K, Kohtamaki K, et al.: The Finland-United States investigation of non-insulin-dependent diabetes mellitus genetics (FUSION) study. I. An autosomal genome scan for genes that predispose to type 2 diabetes. Am J Hum Genet 2000, 67(5):1174-1185.
24. Watanabe RM, Ghosh S, Langefeld CD, Valle TT, Hauser ER, Magnu-son VL, Mohlke KL, Silander K, Ally DS, Chines P, et al.: The Finland-United States investigation of non-insulin-dependent diabe-tes mellitus genetics (FUSION) study. II. An autosomal genome scan for diabetes-related quantitative-trait loci. Am J Hum Genet 2000, 67(5):1186-1200.
25. Mehring GH, Coates PA, Brunei PC, Luzio SD, Owens DR: Insulin sensitivity in type 2 diabetes: univariate and multivariate techniques to derive estimates of insulin sensitivity from the insulin modified intravenous glucose tolerance test (FSIGT).
Comput Methods Programs Biomed 2002, 68(2):161-176.
26. Godsland IF, Walton C: Maximizing the success rate of minimal model insulin sensitivity measurement in humans: the importance of basal glucose levels. Clin Sci (Lond) 2001, 101(1):1-9.
27. Radikova Z: Assessment of insulin sensitivity/resistance in epi-demiological studies. Endocr Regul 2003, 37(3):189-194. 28. Monzillo LU, Hamdy O: Evaluation of insulin sensitivity in
clini-cal practice and in research settings. Nutr Rev 2003, 61(12):397-412.
29. Cederholm J, Wibell L: Insulin release and peripheral sensitivity at the oral glucose tolerance test. Diabetes Res Clin Pract 1990, 10(2):167-175.
30. Gutt M, Davis CL, Spitzer SB, Llabre MM, Kumar M, Czarnecki EM, Schneiderman N, Skyler JS, Marks JB: Validation of the insulin sen-sitivity index (181(0,120)): comparison with other measures.
Diabetes Res Clin Pract 2000, 47(3):177-184.
31. Bonora E, Kiechl S, Willeit J, Oberhollenzer F, Egger G, Meigs JB, Bonadonna RC, Muggeo M: Population-based incidence rates and risk factors for type 2 diabetes in white individuals: the Bruneck study. Diabetes 2004, 53(7):1782-1789.
32. Basu A, Caumo A, Bettini F, Gelisio A, Alzaid A, Cobelli C, Rizza RA: Impaired basal glucose effectiveness in NIDDM: contribution of defects in glucose disappearance and production, meas-ured using an optimized minimal model independent proto-col. Diabetes 1997, 46(3):421-432.
33. Matthews DR, Hosker JP, Rudenski AS, Naylor BA, Treacher DF, Turner RC: Homeostasis model assessment: insulin resistance and beta-cell function from fasting plasma glucose and insu-lin concentrations in man. Diabetologia 1985, 28(7):412-419. 34. Pillonetto G, Caumo A, Sparacino G, Cobelli C: A new dynamic