https://doi.org/10.5194/essd-9-955-2017 © Author(s) 2017. This work is distributed under the Creative Commons Attribution 3.0 License.
A multi-decadal wind-wave hindcast for the
North Sea 1949–2014: coastDat2
Nikolaus Groll and Ralf Weisse
Institute for Coastal Research, Helmholtz-Zentrum Geesthacht, 21502 Geesthacht, Germany
Correspondence to:Nikolaus Groll ([email protected])
Received: 9 May 2017 – Discussion started: 22 June 2017
Revised: 4 October 2017 – Accepted: 3 November 2017 – Published: 4 December 2017
Abstract. Long and consistent wave data are important for analysing wave climate variability and change.
Moreover, such wave data are also needed in coastal and offshore design and for addressing safety-related issues at sea. Using the third-generation spectral wave model WAM a multi-decadal wind-wave hindcast for the North Sea covering the period 1949–2014 was produced. The hindcast is part of the coastDat database representing a consistent and homogeneous met-ocean data set. It is shown that despite not being perfect, data from the wave hindcast are generally suitable for wave climate analysis. In particular, comparisons of hindcast data with in situ and satellite observations show on average a reasonable agreement, while a tendency towards overestima-tion of the highest waves could be inferred. Despite these limitaoverestima-tions, the wave hindcast still provides useful data for assessing wave climate variability and change as well as for risk analysis, in particular when conserva-tive estimates are needed. Hindcast data are stored at the World Data Center for Climate (WDCC) and can be freely accessed using the doi:10.1594/WDCC/coastDat-2_WAM–North_Sea (Groll and Weisse, 2016) or via the coastDat web-page http://www.coastdat.de.
1 Introduction
Multi-decadal wind-wave hindcasts have become a common tool in supporting the assessment of wave climate variability and change, such as its extremes, trends or seasonal and inter-annual to decadal variability (e.g. WASA-Group, 1998; Sterl et al., 1998; Cox and Swail, 2001; Weisse and Günther, 2007; Dodet et al., 2010). Data from wind-wave hindcasts are also frequently used in practically oriented applications such as in navigation, shipbuilding, offshore design or strategic plan-ning of logistics for the operation of future offshore wind farms (Weisse et al., 2009, 2015). Further applications com-prise studies such as evaluating the impact of waves on sea salt emissions (Neumann et al., 2016) or the evaluation of the potential success or failure of different response strategies to oil pollution (Schwichtenberg et al., 2016). For all these dif-ferent types of applications long, homogeneous and consis-tent wind-wave data are needed to derive robust estimates of wind-wave related parameters specific to the problem. Often such information is unavailable from in situ or satellite data
alone and multi-decadal wind-wave hindcasts have become a common approach in complementing such analyses.
While formerly wind-wave hindcasts were developed in-dependently using atmospheric forcing available at that time, they nowadays form an integral part of global atmospheric reanalysis systems (e.g. Dee et al., 2011; Chawla et al., 2013). Owing to the limited spatial and temporal resolution of such global reanalyses, there is, however, still a substan-tial number of regional efforts aiming at higher spasubstan-tial and temporal resolution. These efforts usually use the traditional approach in which downscaled global reanalysis wind fields are subsequently used to run a wave hindcast system over the reanalysis period or sub-periods within that period (e.g. Charles et al., 2012; Reguero et al., 2012, 2013; Bertin et al., 2013; Ponce de León and Guedes Soares, 2015).
atmospheric reanalysis (Uppala et al., 2005) is described in Reistad et al. (2011). Aiming at a consistent description of met-ocean conditions in the North Sea, Weisse and Günther (2007) developed and described a multi-decadal wind-wave hindcast for the southern North Sea that is part of a compre-hensive met-ocean downscaling known as coastDat1 (Weisse et al., 2009). The latter used the global NCEP/NCAR reanal-ysis (Kalnay et al., 1996) as boundary conditions and pro-vides a consistent met-ocean data set comprising of region-ally downscaled atmospheric (Feser et al., 2001), tide-surge (Weisse and Plüss, 2006) and wind-wave (Weisse and Gün-ther, 2007) conditions from which full met-ocean data are available for every hour over the hindcast period.
Data from coastDat1 have been extensively used for a wide variety of studies. For an overview, see Weisse et al. (2009). While there was and there still is substantial interest in these data, the effort terminated in 2007 when the atmospheric component of the met-ocean hindcast was discontinued and consistent atmospheric data to drive the wind-wave and tide-surge models became unavailable. Up to that time, data from coastDat1 were used by more than 50 different users with a large variety of applications. About 50 % of the users origi-nated from commercial enterprises, while about 25 % had a more direct scientific interest and another 25 % came from public authorities (Weisse et al., 2015). Because of ongoing interest in both the scientific and the commercial exploitation of the data, eventually a follow-up effort called coastDat2 was initiated. In this effort, upgraded models with higher spatial resolution were used and the wind-wave part, in addi-tion, now also covered the entire North Sea. The atmospheric component of coastDat2 is described in Geyer (2014). In the following, we describe and evaluate the upgraded wind-wave part (Groll and Weisse, 2016) that is driven by the coastDat2 wind fields (Geyer, 2014).
2 Model setup
For the wind-wave hindcast in coastDat2 the third-generation spectral wind-wave model WAM (WAMDI-Group, 1988; Komen et al., 1996) version 4.5.4 was used. This version represents an update and extension of the WAM cycle 4 used in coastDat1 (Weisse and Günther, 2007), the details of which are described in the WAM documentation available at http://mywave.github.io/WAM/. Apart from some techni-cal changes such as in the I/O routines, a major change was introduced by the replacement of the wave dissipation source term with a new version described in Bidlot et al. (2005) and Bidlot et al. (2007).
For the coastDat2 hindcast, the wave model was used in a nested version with a coarse-grid simulation cov-ering most of the northeast North Atlantic and a
fine-grid simulation covering the North Sea from 4.75◦W to
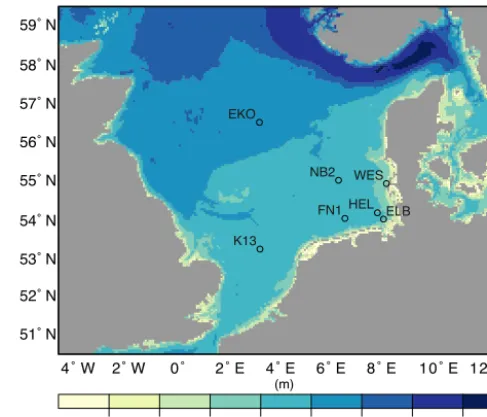
13.25◦E and from 50.5 to 59.5◦N (Fig. 1). The grid size
of the coarse grid is 0.5◦latitude×0.75◦longitude while
K13 EKO
HEL NB2
ELB FN1
WES
4˚W 2˚W 0˚ 2˚E 4˚E 6˚E 8˚E 10˚E 12˚E
2 5 10 20 50 100 200 500 59˚N
58˚N
57˚N
56˚N
55˚N
54˚N
53˚N
52˚N
51˚N
(m)
Figure 1.Model domain and bathymetry used for the fine-grid sim-ulation. Colours indicate water depth in metres. Circles mark obser-vational sites used for the model evaluation. For the abbreviations, see Table 1.
that of the fine grid nested within the coarse grid is
0.05◦latitude×0.075◦longitude. The latter corresponds to a
grid spacing of approximately 3×3 nautical miles.
Wave spectra were computed and discretized using 35 fre-quencies ranging from approx. 0.042 to 1.067 Hz and 24 di-rectional bins. The integration time step was set to 3 min, and integrated parameters derived from the wave spectra such as significant wave height, mean period or direction were calcu-lated and stored at every full model hour while wave spectra were kept every 3 h. Boundary conditions were transferred from the coarse to the fine grid every hour using the full mod-elled wave spectra. For both grids, the model was set up and integrated in shallow-water mode including depth refraction and depth-induced wave breaking. In the coarse-grid simu-lation, monthly sea ice conditions from the northeast North Atlantic were included to account for the varying fetch aris-ing from variations in sea ice coverage.
3 External data
3.1 Forcing data
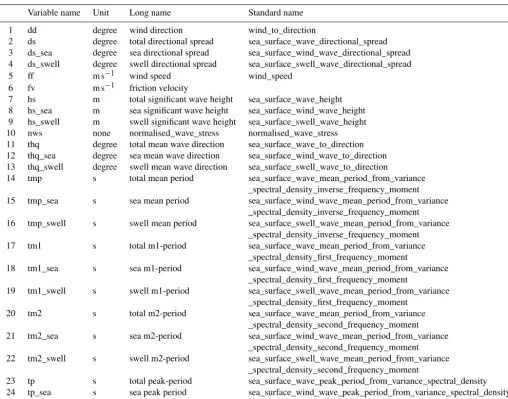
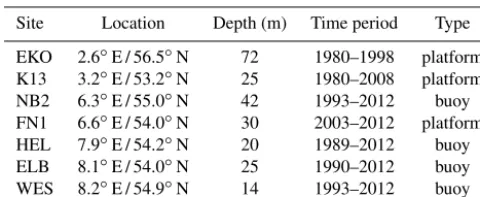
Table 1.Location and description of in situ measurements used for comparison.
Site Location Depth (m) Time period Type
EKO 2.6◦E / 56.5◦N 72 1980–1998 platform
K13 3.2◦E / 53.2◦N 25 1980–2008 platform
NB2 6.3◦E / 55.0◦N 42 1993–2012 buoy
FN1 6.6◦E / 54.0◦N 30 2003–2012 platform
HEL 7.9◦E / 54.2◦N 20 1989–2012 buoy
ELB 8.1◦E / 54.0◦N 25 1990–2012 buoy
WES 8.2◦E / 54.9◦N 14 1993–2012 buoy
given by the driving NCEP/NCAR reanalysis (Kalnay et al., 1996; Kistler et al., 2001). The downscaling was performed for the North Atlantic/ European region and the model was
integrated on a rotated grid with a grid size of 0.22◦×0.22◦
corresponding to a spatial resolution of about 25×25 km.
Atmospheric wind fields to drive the wave model were avail-able and used every model hour. Validation of the atmo-spheric hindcast is described in Geyer (2014). Compared to the driving global reanalysis an improved representation of marine wind speeds in coastal areas, especially for higher wind speeds, is noted (Geyer et al., 2015). Note that the at-mospheric hindcast described in Geyer (2014) ends in 2012, but it is extended to 2014 to guarantee a consistent forcing data for the presented wave hindcast simulation.
For the coarse-grid simulation monthly sea ice concentra-tions provided by the Hadley Centre Sea Ice and Sea Sur-face Temperature data set (HadISST1.1, Rayner et al., 2003) were used. The sea ice concentrations had a spatial
resolu-tion of 1◦×1◦and were spatially interpolated to the coarse
wave model grid. Subsequently in the simulation sea ice was accounted for by treating all model grid points with sea ice concentrations exceeding 50 % as land for the corresponding time steps.
3.2 Reference data
A number of in situ wind-wave observations from platforms and buoys in the North Sea originating from different sources were available for validation (Table 1). Basic quality control was applied but no attempt to check homogeneity was done. The data cover different time periods including gaps and dif-fer in their temporal resolution. Because the model output is available only at full model hours, the comparison with observations was limited to data that were measured within
±10 min around full hours.
In addition, wind-wave data derived from satellite pro-vided by the merged altimeter wave height database ver-sion 11.0 (Queffeulou, 2013) were used. These data origi-nate from the GlobWave project (http://www.globwave.org) and cover the period 1991 to present. The satellite data were co-located with the model data using a co-location criterion
of±10 min at which the position of the satellite was matched
with the nearest grid point of the wave model.
To compare the wave model results in space and time, data from the ERA-Interim global reanalysis (Dee et al., 2011) spatially interpolated to the coastDat2 wave model grid were used. More specifically, data from the ocean wave product of ERA-Interim were used, which originates from a comparable version of the wave model WAM. Wave data are available every 6 h at 00:00, 06:00, 12:00 and 18:00 UTC and at a
spa-tial resolution of 0.75◦latitude×0.75◦longitude. The
atmo-spheric part of the ERA-Interim reanalysis has a 30 min time step and a spatial resolution of about 79 km. For the com-parison we use the ERA-Interim data from 1980 to 2014. ERA-Interim used an assimilation scheme, which includes, among others parameters, wind data from satellites and in situ observations. Further, from 1990 onwards, wave spectra in ERA-Interim were adjusted using altimeter data, but no wave buoy data were used in the assimilation scheme (Dee et al., 2011).
In order to avoid biases, only those instances in time are used for comparison for which both observations and hind-cast data were simultaneously available. In particular, this results in a comparison of 1 h and 6 h data when coastDat2 hindcast/ERA-Interim reanalysis is involved.
4 Evaluation
For the evaluation of the wave hindcast the following error metrics were applied: the mean, the standard deviation (SD), the bias, the root mean square error (RMSE), the scatter
in-dex (SI) and the correlation coefficient (r). To evaluate the
unbiased RMSE the standard deviation of the error (SDE) was used. All measures were calculated for the entire data sets if not stated otherwise. In the following, measures are called errors when simulations are compared with observa-tions and are called differences when the two simulaobserva-tions are compared. Further details of the error metrics can be found in Appendix A.
4.1 Significant wave height
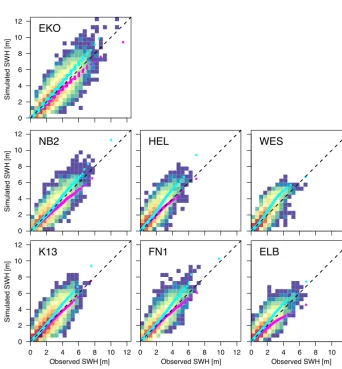
Significant wave height (SWH) derived from hindcast data and in situ measurements was compared at seven sites in the North Sea (Fig. 2). Comparison of instantaneous values revealed noticeable scatter between modelled and observed data with biases ranging between about 0 and 0.25 m. Root mean square errors varied between approximately 0.4 and 0.7 m (Table 2). When distributions were compared, gener-ally a reasonable agreement was inferred for the lower to in-termediate percentiles corresponding to wave heights of up to 2–4 m depending on location (Fig. 2). Higher percentiles were generally found to be overestimated in the hindcast data.
Table 2.Error metrics for the SWH at seven locations derived from in situ observations (OBS), coastDat2 hindcast (CD2) and ERA-Interim reanalysis (ERAi), for 1 h (coastDat2) and 6 h (ERA-Interim) data respectively.
Name Count Mean (m) Standard deviation (m) Bias (m) RMSE (m) Scatter index Correlation
CD2 / ERAi OBS / CD2 / ERAi OBS / CD2 / ERAi CD2 / ERAi CD2 / ERAi CD2 / ERAi CD2 / ERAi
EKO 51620 / 22589 2.08 / 2.24 / 1.94 1.29 / 1.48 / 1.15 0.16 /−0.14 0.71 / 0.44 0.34 / 0.21 0.88 / 0.95
K13 84744 / 42372 1.5 / 1.59 / 1.43 0.92 / 1.08 / 0.86 0.09 /−0.07 0.51 / 0.26 0.34 / 0.17 0.88 / 0.96
NB2 28485 / 5245 1.75 / 1.77 / 1.51 1.11 / 1.23 / 0.91 0.03 /−0.17 0.56 / 0.35 0.32 / 0.21 0.89 / 0.97
FN1 30893 / 4655 1.52 / 1.68 / 1.5 0.97 / 1.16 / 0.9 0.16 /−0.03 0.56 / 0.26 0.37 / 0.17 0.89 / 0.96
HEL 46074 / 14208 1.09 / 1.34 / 1.15 0.76 / 0.98 / 0.71 0.25/0.06 0.55 / 0.32 0.5 / 0.29 0.87 / 0.91
ELB 55190 / 14292 1.04 / 1.18 / 0.92 0.73 / 0.85 / 0.56 0.13 /−0.12 0.44 / 0.32 0.42 / 0.31 0.87 / 0.92
WES 43979 / NA 1.08 / 1.2 / NA 0.72 / 0.94 / NA 0.12 / NA 0.48 / NA 0.45 / NA 0.88 / NA
SAT 901451 / 82067 1.76 / 1.94 / 1.69 1.11 / 1.34 / 0.97 0.18 /−0.06 0.64 / 0.36 0.37 / 0.20 0.89 / 0.94
NA: not available.
0 2 4 6 8 10 12
●●
● ●●●● ●●●●●●●●●●●●●●●●●●●●●●●●●●●●●●●●●●●●●●●●●●●●●●●●●●●●●●●●●●●●●●●●●●●●●●●●●●●●●●●●●●●●●●● ●●●●●● ●●●●● ●●●●●● ●●●●●● ●●●●●●●●●●●●●●●●●●●●●●●●●●●●●●●●●●●●●●●●●●●●●●●●●●●●●●●●●●●●●●●●●●●●●●●●●●●●●●●●●●●●●●●●●●●●●●●●●●●●●●●●●●●●●●●●●●●●●●●●●●●●●●●●●●●●●●●●●●●●●●●●●●●●●●●●●●●●●●●●●●●● ●●●●●●●●●●●●●●● ●●●●●●● ●●●●●● ●●●●●●●●●●●●●●●●●●●●●●●●●●●●●●●●●●●●●●●●●●●●●●●●●●●●●●●●●●●●●●●●●●●●●●●●●●●●●●●●●●●●●●●●●●●●●●●●●●●●●●●●●●●●●●●●●●●●●●●●●●●●●●●●●●●●●●●●●●●●●●●●●●●●●●●●●●●●●●●●●●● ●●●●●●●● ●●●●●●●●●●●●●● ●●●●●● ●●●●●●●●●●●●●●●●●●●●●●●●●●●●●●●●●●●●●●●●●●●●●●●●●●●●●●●●●●●●●●●●●●●●●●●●●●●●●●●●●●●●●●●●●●●●●●●●●●●●●●●●●●●●●●●●●●●●●●●●●●●●●●●●●●●●●● ●●●●● ●●●●● ●●●● ●●●● ●●●●●●●●●●●●●●●●●●●●●●●●●●●●●●●●●●●●●●●●●●●●●●●●●●●●●●●●●●●●●●●●●●●●●●●●●●●●●●●●●●●●●●●●●●●●●● ●●●● ●●●● ●●●● ●●● ●●●●●●●●●●●●●●●●●●●●●●●●●●●●●●●●●●●●●●●●●●●●●●●●●●●●●●●●●●●●●●●●●●●●●●●●● ●● ●●● ●●● ●● ●●●●●●●●●●●●●●●●●●●●●●●●●●●●●●●●●●●●●●●●●●●●●●●● ●● ● ●● ● ●●●●●●●●●●●●●●●●●●●●●●●●●●●●●●●● ● ●● ● ●●●●●●●●●●●●●●●●●●●●● ● ●●●●●●●●●●●●●●●●●● ● ●●●●●●●●●●
●●●●●● ●●
● ● ● ● ●
● ●
● ●
● ● ●●●●●●●●●●●●●●●●●●●●●●●●●●●●●●●●●●●●●●●●●●●●●●●●●●●●●●●●●●●●●●●●●●●●●●●●●●●●●●●●●●●●●●●●●●●●●●●● ●● ●● ●●● ● ●●●●●●●●●●●●●●●●●●●●●●●●●●●●●●●●●●●●●●●●●●●●●●●●●●●●●●●●●●●●●●●●●●●●●●●●●●●●●●●●●●●●●●●●●●●●●●●●●●●●●●●●●●●●●●●●●●●●●●●●●●●●●●●●●●●●●●●●●●●●●●●●●●●●●●●●●●●●●●●●●●●●●●●●●●●●●●●●●●●●●●● ●●●●● ●●● ●●● ●●●●●●●●●●●●●●●●●●●●●●●●●●●●●●●●●●●●●●●●●●●●●●●●●●●●●●●●●●●●●●●●●●●●●●●●●●●●●●●●●●●●●●●●●●●●●●●●●●●●●●●●●●●●●●●●●●●●●●●●●●●●●●●●●●●●●●●●●●●●●●●●●●●●●●●●●●●●●●●●●●●●●●●●●●●●●●●●●●●● ●●● ●●● ●● ●●● ●●●●●●●●●●●●●●●●●●●●●●●●●●●●●●●●●●●●●●●●●●●●●●●●●●●●●●●●●●●●●●●●●●●●●●●●●●●●●●●●●●●●●●●●●●●●●●●●●●●●●●●●●●●●●●●●●●●●●●●●●●●●●●●●●●●●●●●●●●●●●●●●●● ●● ●● ●● ● ●●●●●●●●●●●●●●●●●●●●●●●●●●●●●●●●●●●●●●●●●●●●●●●●●●●●●●●●●●●●●●●●●●●●●●●●●●●●●●●●●●●●●●●●●●●●●●●●●●●●●●●●●●● ●● ● ● ● ● ●●●●●●●●●●●●●●●●●●●●●●●●●●●●●●●●●●●●●●●●●●●●●●●●●●●●●●●●●●●●●●●●●●●●●●●●●●●●●● ● ● ● ●●●●●●●●●●●●●●●●●●●●●●●●●●●●●●●●●●●●●●●●●●●●●●●●●●●●●●
●● ●●●●●●●●●●●●●●●●●●●●●●●●●●●●●●●●●●●● ● ●●●●●●●●●●●●●●●●●●●●●●●●
●●●●●●●●●●●●●●●●●● ●●●●●●●●●
●●●●●● ● ●●●●
● ● ●
● ●
● EKO
0 2 4 6 8 10 12
0 2 4 6 8 10 12
●●●●●●●●●●●●●●●●●●●●●●●●●●●●●●●●●●●●●●●●●●●●●●●●●●●●●●●●●●●●●●●●●●●●●●●●●●●●●●●●●●●●●●●●●●●●●●●●●●●●●●●●●●●●●●●●●●●●●●●●●●●●●●●●●●●●●●●●●●●●●●●●●●●●●●●●●●●●●●●●●●●●●●●●●●●●●●●●●●●●●●●●●●●●●●●●●●●●●●●●●●●●●●●●●●●●●●●●●●●●●●●●●●●●●●●●●●●●●●●●●●●●●●●●●●●●●●●●●●●●●●●●●●●●●●●●●●●●●●●●●●●●●●●●●●●●●●●●●●●●●●●●●●●●●●●●●●●●●●●●●●●●●●●●●●●●●●●●●●●●●●●●●●●●●●●●●●●●●●●●●●●●●●●●●●●●●●●●●●●●●●●●●●●●●●●●●●●●●●●●●●●●●●●●●●●●●●●●●●●●●●●●●●●●●●●●●●●●●●●●●●●●●●●●●●●●●●●●●●●●●●●●●●●●●●●●●●●●●●●●●●●●●●●●●●●●●●●●●●●●●●●●●●●●●●●●●●●●●●●●●●●●●●●●●●●●●●●●●●●●●●●●●●●●●●●●●●●●●●●●●●●●●●●●●●●●●●●●●●●●●●●●●●●●●●●●●●●●●●●●●●●●●●●●●●●●●●●●●●●●●●●●●●●●●●●●●●●●●●●●●●●●●●●●●●●●●●●●●●●●●●●●●●●●●●●●●●●●●●●●●●●●●●●●●●●●●●●●●●●●●●●●●●●●●●●●●●●●●●●●●●●●●●●●●●●●●●●●●●●●●●●●●●●●●●●●●●●●●●●●●●●●●●●●●●●●●●●●●●●●●●●●●●●●●●●●●●●●●●●●●●●●●●●●●●●●●●●●●●●●●●●●●●●●●●●●●●●●●●●●●●●●●●●●●●●●●●●●●●●●●●●●●●●●●●●●●●●●●●●●●●●●●●●●●●●●●●●●●●●●●●●●●●●●●●●●●●●●●●●●●●●●●●●●●●●●●●●●●●●●●●●●●●●●●●●●●●●●●●●●●●●●●●●●●●●●●●●●●●●●●●●● ●●● ●●●●●●●●
● ● ● ●
● ●
●●●●●●●●●●●●●●●●●●●●●●●●●●●●●●●●●●●●●●●●●●●●●●●●●●●●●●●●●●●●●●●●●●●●●●●●●●●●●●●●●●●●●●●●●●●●●●●●●●●●●●●●●●●●●●●●●●●●●●●●●●●●●●●●●●●●●●●●●●●●●●●●●●●●●●●●●●●●●●●●●●●●●●●●●●●●●●●●●●●●●●●●●●●●●●●●●●●●●●●●●●●●●●●●●●●●●●●●●●●●●●●●●●●●●●●●●●●●●●●●●●●●●●●●●●●●●●●●●●●●●●●●●●●●●●●●●●●●●●●●●●●●●●●●●●●●●●●●●●●●●●●●●●●●●●●●●●●●●●●●●●●●●●●●●●●●●●●●●●●●●●●●●●●●●●●●●●●●●●●●●●●●●●●●●●●●●●●●●●●●●●●●●●●●●●●●●●●●●●●●●●●●●●●●●●●●●●●●●●●●●●●●●●●●●●●●●●●●●●●●●●●●●●●●●●●●●●●●●●●●●●●●●●●●●●●●●●●●●●●●●●●●●●●●●●●●●●●●●●●●●●●●●●●●●●●●●●●●●●●●●●●●●●●●●●●●●●●●●●●●●●●●●●●●●●●●●●●●●●●●●●●●●●●●●●●●●●●●●●●●●●●●●●●●●●●●●●●●●●●●●●●●●●●●●●●●●●●●●●●●●●●●●●●●●●●●●●●●●●●●●●●●●●●●●●●●●●●●●●●●●●●●●●●●●●●●●●●●●●●●●●●●●●●●●●●●●●●●●●●●●●●●●●●●●●●●●●●●●●●●●●●●●●●●●●●●●●●●●●●●●●●●●●●●●●●●●●●●●●●●●●●●●●●●●●●●●●●●●●●●●●●●●●●●●●●●●●●●●●●●●●●●●●●●●●●●●●●●●●●●●●●●●●●●●●●●●●●●●●●●●●●●●●●●●●●●●●●●●●●●●●●●●●●●●●●●●●●●●●●●●●●●●●●●●●●●●●●●●●●●●●●●●●●●●●●●●●●●●●●●●●●●●●●●●●●●●●●●●●●●●●●●●●●●●●●●●●●●●●●●●●●●●●●●●●●●●●●●●●●●●●●●●●●●●●●●●●●● ● ● ●
● ● K13
●●●●●●●●●●●●●●●●●●●●●●●●●●●●●●●●●●●●●●●●●●●●●●●●●●●●●●●●●●●●●●●●●●●●●●●●●●●●●●●●●●●●●●●●●●●●●●●●●●●●●●●●●●●●●●●●●●●●●●●●●●●●●●●●●●●●●●●●●●●●●●●●●●●●●●●●●●●●●●●●●●●●●●●●●●●●●●●●●●●●●●●●●●●●●●●●●●●●●●●●●●●●●●●●●●●●●●●●●●●●●●●●●●●●●●●●●●●●●●●●●●●●●●●●●●●●●●●●●●●●●●●●●●●●●●●●●●●●●●●●●●●●●●●●●●●●●●●●●●●●●●●●●●●●●●●●●●●●●●●●●●●●●●●●●●●●●●●●●●●●●●●●●●●●●●●●●●●●●●●●●●●●●●●●●●●●●●●●●●●●●●●●●●●●●●●●●●●●●●●●●●●●●●●●●●●●●●●●●●●●●●●●●●●●●●●●●●●●●●●●●●●●●●●●●●●●●●●●●●●●●●●●●●●●●●●●●●●●●●●●●●●●●●●●●●●●●●●●●●●●●●●●●●●●●●●●●●●●●●●●●●●●●●●●●●●●●●●●●●●●●●●●●●●●●●●●●●●●●●●●●●●●●●●●●●●●●●●●●●●●●●●●●●●●●●●●●●●●●●●●●●●●●●●●●●●●●●●●●●●●●●●●●●●●●●●●●●●●●●●●●●●●●●●●●●●●●●●●●●●●●●●●●●●●●●●●●●●●●●●●●●●●●●●●●●●●●●●●●●●●●●●●●●●●●●●●●●●●●●●●●●●●●●●●●●●●●●●●●●●●●●●●●●●●●●●●●●●●●●●●●●●●●●●●●●●●●●●●●●●●●●●●●●●●●●●●●●●●●●●●●●●●●●●●●●●●●●●●●●●●●●●●●●●●●●●●●●●●●●●●●●●●●●●●●●●●●●●●●●●●●●●●●●●●●●●●●●●●●●●●●●●●●●●●●●●●●●●●●●●●●●●●●●●●●●●●●●●●●●●●●●●●●●●●●●●●●●●●●●●●●●●●●●●●●●●●●●●●●●●●●●●●●●●●●●●●●●●●●●●●●●●●●●●●●●●●●●●●● ● ● ●
● WES
0 2 4 6 8 10 12
●●●●●●●●●●●●●●●●●●●●●●●●●●●●●●●●●●●●●●●●●●●●●●●●●●●●●●●●●●●●●●●●●●●●●●●●●●●●●●●●●●●●●●●●●●●●●●●●●●●●●●●●●●●●●●●●●●●●●●●●●●●●●●●●●●●●●●●●●●●●●●●●●●●●●●●●●●●●●●●●●●●●●●●●●●●●●●●●●●●●●●●●●●●●●●●●●●●●●●●●●●●●●●●●●●●●●●●●●●●●●●●●●●●●●●●●●●●●●●●●●●●●●●●●●●●●●●●●●●●●●●●●●●●●●●●●●●●●●●●●●●●●●●●●●●●●●●●●●●●●●●●●●●●●●●●●●●●●●●●●●●●●●●●●●●●●●●●●●●●●●●●●●●●●●●●●●●●●●●●●●●●●●●●●●●●●●●●●●●●●●●●●●●●●●●●●●●●●●●●●●●●●●●●●●●●●●●●●●●●●●●●●●●●●●●●●●●●●●●●●●●●●●●●●●●●●●●●●●●●●●●●●●●●●●●●●●●●●●●●●●●●●●●●●●●●●●●●●●●●●●●●●●●●●●●●●●●●●●●●●●●●●●●●●●●●●●●●●●●●●●●●●●●●●●●●●●●●●●●●●●●●●●●●●●●●●●●●●●●●●●●●●●●●●●●●●●●●●●●●●●●●●●●●●●●●●●●●●●●●●●●●●●●●●●●●●●●●●●●●●●●●●●●●●●●●●●●●●●●●●●●●●●●●●●●●●●●●●●●●●●●●●●●●●●●●●●●●●●●●●●●●●●●●●●●●●●●●●●●●●●●●●●●●●●●●●●●●●●●●●●●●●●●●●●●●●●●●●●●●●●●●●●●●●●●●●●●●●●●●●●●●●●●●●●●●●●●●●●●●●●●●●●●●●●●●●●●●●●●●●●●●●●●●●●●●●●●●●●●●●●●●●●●●●●●●●●●●●●●●●●●●●●●●●●●●●●●●●●●●●●●●●●●●●●●●●●●●●●●●●●●●●●●●●●●●●●●●●●●●●●●●●●●●●●●●●●●●●●●●●●●●●●●●●●●●●●●●●●●●●●●●●●●●●●●●●●●●●●●●●●●●●●●● ●●●
●●● ● ●●
● ●
● ●
●
●●●●●●●●●●●●●●●●●●●●●●●●●●●●●●●●●●●●●●●●●●●●●●●●●●●●●●●●●●●●●●●●●●●●●●●●●●●●●●●●●●●●●●●●●●●●●●●●●●●●●●●●●●●●●●●●●●●●●●●●●●●●●●●●●●●●●●●●●●●●●●●●●●●●●●●●●●●●●●●●●●●●●●●●●●●●●●●●●●●●●●●●●●●●●●●●●●●●●●●●●●●●●●●●●●●●●●●●●●●●●●●●●●●●●●●●●●●●●●●●●●●●●●●●●●●●●●●●●●●●●●●●●●●●●●●●●●●●●●●●●●●●●●●●●●●●●●●●●●●●●●●●●●●●●●●●●●●●●●●●●●●●●●●●●●●●●●●●●●●●●●●●●●●●●●●●●●●●●●●●●●●●●●●●●●●●●●●●●●●●●●●●●●●●●●●●●●●●●●●●●●●●●●●●●●●●●●●●●●●●●●●●●●●●●●●●●●●●●●●●●●●●●●●●●●●●●●●●●●●●●●●●●●●●●●●●●●●●●●●●●●●●●●●●●●●●●●●●●●●●●●●●●●●●●●●●●●●●●●●●●●●●●●●●●●●●●●●●●●●●●●●●●●●●●●●●●●●●●●●●●●●●●●●●●●●●●●●●●●●●●●●●●●●●●●●●●●●●●●●●●●●●●●●●●●●●●●●●●●●●●●●●●●●●●●●●●●●●●●●●●●●●●●●●●●●●●●●●●●●●●●●●●●●●●●●●●●●●●●●●●●●●●●●●●●●●●●●●●●●●●●●●●●●●●●●●●●●●●●●●●●●●●●●●●●●●●●●●●●●●●●●●●●●●●●●●●●●●●●●●●●●●●●●●●●●●●●●●●●●●●●●●●●●●●●●●●●●●●●●●●●●●●●●●●●●●●●●●●●●●●●●●●●●●●●●●●●●●●●●●●●●●●●●●●●●●●●●●●●●●●●●●●●●●●●●●●●●●●●●●●●●●●●●●●●●●●●●●●●●●●●●●●●●●●●●●●●●●●●●●●●●●●●●●●●●●●●●●●●●●●●●●●●●●●●●●●●●●●●●●●●●●●●●●●●●●●●●●●●●●●●●●●●●●●●● ● ●●● ●●
● ●
● ● FN1
0 2 4 6 8 10 12
●●●●●●●●●●●●●●●●●●●●●●●●●●●●●●●●●●●●●●●●●●●●●●●●●●●●●●●●●●●●●●●●●●●●●●●●●●●●●●●●●●●●●●●●●●●●●●●●●●●●●●●●●●●●●●●●●●●●●●●●●●●●●●●●●●●●●●●●●●●●●●●●●●●●●●●●●●●●●●●●●●●●●●●●●●●●●●●●●●●●●●●●●●●●●●●●●●●●●●●●●●●●●●●●●●●●●●●●●●●●●●●●●●●●●●●●●●●●●●●●●●●●●●●●●●●●●●●●●●●●●●●●●●●●●●●●●●●●●●●●●●●●●●●●●●●●●●●●●●●●●●●●●●●●●●●●●●●●●●●●●●●●●●●●●●●●●●●●●●●●●●●●●●●●●●●●●●●●●●●●●●●●●●●●●●●●●●●●●●●●●●●●●●●●●●●●●●●●●●●●●●●●●●●●●●●●●●●●●●●●●●●●●●●●●●●●●●●●●●●●●●●●●●●●●●●●●●●●●●●●●●●●●●●●●●●●●●●●●●●●●●●●●●●●●●●●●●●●●●●●●●●●●●●●●●●●●●●●●●●●●●●●●●●●●●●●●●●●●●●●●●●●●●●●●●●●●●●●●●●●●●●●●●●●●●●●●●●●●●●●●●●●●●●●●●●●●●●●●●●●●●●●●●●●●●●●●●●●●●●●●●●●●●●●●●●●●●●●●●●●●●●●●●●●●●●●●●●●●●●●●●●●●●●●●●●●●●●●●●●●●●●●●●●●●●●●●●●●●●●●●●●●●●●●●●●●●●●●●●●●●●●●●●●●●●●●●●●●●●●●●●●●●●●●●●●●●●●●●●●●●●●●●●●●●●●●●●●●●●●●●●●●●●●●●●●●●●●●●●●●●●●●●●●●●●●●●●●●●●●●●●●●●●●●●●●●●●●●●●●●●●●●●●●●●●●●●●●●●●●●●●●●●●●●●●●●●●●●●●●●●●●●●●●●●●●●●●●●●●●●●●●●●●●●●●●●●●●●●●●●●●●●●●●●●●●●●●●●●●●●●●●●●●●●●●●●●●●●●●●●●●●●●●●●●●●●●●●●●●●●●●●●●●●●●●●●●● ● ● ●
● ●
● ●
●●●●●●●●●●●●●●●●●●●●●●●●●●●●●●●●●●●●●●●●●●●●●●●●●●●●●●●●●●●●●●●●●●●●●●●●●●●●●●●●●●●●●●●●●●●●●●●●●●●●●●●●●●●●●●●●●●●●●●●●●●●●●●●●●●●●●●●●●●●●●●●●●●●●●●●●●●●●●●●●●●●●●●●●●●●●●●●●●●●●●●●●●●●●●●●●●●●●●●●●●●●●●●●●●●●●●●●●●●●●●●●●●●●●●●●●●●●●●●●●●●●●●●●●●●●●●●●●●●●●●●●●●●●●●●●●●●●●●●●●●●●●●●●●●●●●●●●●●●●●●●●●●●●●●●●●●●●●●●●●●●●●●●●●●●●●●●●●●●●●●●●●●●●●●●●●●●●●●●●●●●●●●●●●●●●●●●●●●●●●●●●●●●●●●●●●●●●●●●●●●●●●●●●●●●●●●●●●●●●●●●●●●●●●●●●●●●●●●●●●●●●●●●●●●●●●●●●●●●●●●●●●●●●●●●●●●●●●●●●●●●●●●●●●●●●●●●●●●●●●●●●●●●●●●●●●●●●●●●●●●●●●●●●●●●●●●●●●●●●●●●●●●●●●●●●●●●●●●●●●●●●●●●●●●●●●●●●●●●●●●●●●●●●●●●●●●●●●●●●●●●●●●●●●●●●●●●●●●●●●●●●●●●●●●●●●●●●●●●●●●●●●●●●●●●●●●●●●●●●●●●●●●●●●●●●●●●●●●●●●●●●●●●●●●●●●●●●●●●●●●●●●●●●●●●●●●●●●●●●●●●●●●●●●●●●●●●●●●●●●●●●●●●●●●●●●●●●●●●●●●●●●●●●●●●●●●●●●●●●●●●●●●●●●●●●●●●●●●●●●●●●●●●●●●●●●●●●●●●●●●●●●●●●●●●●●●●●●●●●●●●●●●●●●●●●●●●●●●●●●●●●●●●●●●●●●●●●●●●●●●●●●●●●●●●●●●●●●●●●●●●●●●●●●●●●●●●●●●●●●●●●●●●●●●●●●●●●●●●●●●●●●●●●●●●●●●●●●●●●●●●●●●●●●●●●●●●●●●●●●●●●●●●●●●●●● ●●●●●
● ●
● ● ELB ● ●●●●●●●●●●●●●●●●●●●●●●●●●●●●●●●●●●●●●●●●●●●●●●●●●●●●●●●●●●●●●●●●●●●●●●●●●●●●●●●●●●●●●●●●●●●●●●●●●●●●●●●●●●●●●●●●●●●●●●●●●●●●●●●●●●●●●●●●●●●●●●●●●●●●●●●●●●●●●●●●●●●●●●●●●●●●●●●●●●●●●●●●●●●●●●●●●●●●●●●●●●●●●●●●●●●●●●●●●●●●●●●●●●●●●●●●●●●●●●●●●●●●●●●●●●●●●●●●●●●●●●●●●●●●●●●●●●●●●●●●●●●●●●●●●●●●●●●●●●●●●●●●●●●●●●●●●●●●●●●●●●●●●●●●●●●●●●●●●●●●●●●●●●●●●●●●●●●●●●●●●●●●●●●●●●●●●●●●●●●●●●●●●●●●●●●●●●●●●●●●●●●●●●●●●●●●●●●●●●●●●●●●●●●●●●●●●●●●●●●●●●●●●●●●●●●●●●●●●●●●●●●●●●●●●●●●●●●●●●●●●●●●●●●●●●●●●●●●●●●●●●●●●●●●●●●●●●●●●●●●●●●●●●●●●●●●●●●●●●●●●●●●●●●●●●●●●●●●●●●●●●●●●●●●●●●●●●●●●●●●●●●●●●●●●●●●●●●●●●●●●●●●●●●
●●●●●●●●●●●●●●●●●●●●●●●●●●●●●●●●●●●●●●●●●●●●●●●●●●●●●●●●●●●●●●●●●●●●●●●●●●●●●●●●●●●●●●●●●●●●●●●●●●●●●●●●●●●●●●●●●●●●● ●●●●●●●●●●●●●●●●●●●●●●●●●●●●●●●●●●●●●●●●●●
●●●●●●●●●●●●●●●●●●●●●●●●●●●●●●●●●●●●●●●●●●●●●●●●●●●●●●●●●●●●●●●●●●●●●●●●●●●●●●●●●●●●●●●●●●●●●●●●●●●●●●●●●●●●●●●●●●●●●●●●●●●●●●●●●●●●●●●●●●●●●● ●●●●●●●●●●● ●●●●●●●●●● ● ●●●●●●●●●●●●●●●●●● ●
●●●●●● ●●●●●●● ●●●●● ●●●●● ●●●●●●●● ●●●●●●●●●●● ● ●●
● ● ●
● ●
●
●●●●●●●●●●●●●●●●●●●●●●●●●●●●●●●●●●●●●●●●●●●●●●●●●●●●●●●●●●●●●●●●●●●●●●●●●●●●●●●●●●●●●●●●●●●●●●●●●●●●●●●●●●●●●●●●●●●●●●●●●●●●●●●●●●●●●●●●●●●●●●●●●●●●●●●●●●●●●●●●●●●●●●●●●●●●●●●●●●●●●●●●●●●●●●●●●●●●●●●●●●●●●●●●●●●●●●●●●●●●●●●●●●●●●●●●●●●●●●●●●●●●●●●●●●●●●●●●●●●●●●●●●●●●●●●●●●●●●●●●●●●●●●●●●●●●●●●●●●●●●●●●●●●●●●●●●●●●●●●●●●●●●●●●●●●●●●●●●●●●●●●●●●●●●●●●●●●●●●●●●●●●●●●●●●●●●●●●●●●●●●●●●●●●●●●●●●●●●●●●●●●●●●●●●●●●●●●●●●●●●●●●●●●●●●●●●●●●●●●●●●●●●●●●●●●●●●●●●●●●●●●●●●●●●●●●●●●●●●●●●●●●●●●●●●●●●●●●●●●●●●●●●●●●●●●●●●●●●●●●●●●●●●●●●●●●●●●●●●●●●●●●●●●●●●●●●●●●●●●●●●●●●●●●●●●●●●●●●●●●●●●●●●●●●●●●●●●●●●●●●●●●●●●●●●●●●●●●●●●●●●●●●●●●●●●●●●●●●●●●●●●●●●●●●●●●●●●●●●●●●●●●●●●●●●●●●●●●●●●●●●●●●●●●●●●●●●●●●●●●●●●●●●●●●●●●●●●●●●●●●●●●●●●●●●●●●●●●●●●●●●●●●●●●●●●●●●●●●●●●●●●●●●●●●●●●●●●●●●●●●●●●●●●●●●●●●●●●●●●●●●●●●●●●●●●●●●●●●●●●●●●●●●●●●●●●●●●●●●●●●●●●●●●●●●●●●●●●●●●●●●●●●●●●●●●●●● ●●●●●●●●●●●●●●●●●●●●●●●●●●●●●●●●●●●●●●●●●●●●●●●●●●●●●●●●● ●●●●●●●●●●●●●●●●●●●●●●●●● ●●●●●●●●●●●● ●●●●● ●●●●● ●●●●●● ●●● ●
● ●●●● ●●●
●● ●
● ● NB2
0 2 4 6 8 10 12
● ●●●●●●●●●●●●●●●●●●●●●●●●●●●●●●●●●●●●●●●●●●●●●●●●●●●●●●●●●●●●●●●●●●●●●●●●●●●●●●●●●●●●●●●●●●●●●●●●●●●●●●●●●●●●●●●●●●●●●●●●●●●●●●●●●●●●●●●●●●●●●●●●●●●●●●●●●●●●●●●●●●●●●●●●●●●●●●●●●●●●●●●●●●●●●●●●●●●●●●●●●●●●●●●●●●●●●●●●●●●●●●●●●●●●●●●●●●●●●●●●●●●●●●●●●●●●●●●●●●●●●●●●●●●●●●●●●●●●●●●●●●●●●●●●●●●●●●●●●●●●●●●●●●●●●●●●●●●●●●●●●●●●●●●●●●●●●●●●●●●●●●●●●●●●●●●●●●●●●●●●●●●●●●●●●●●●●●●●●●●●●●●●●●●●●●●●●●●●●●●●●●●●●●●●●●●●●●●●●●●●●●●●●●●●●●●●●●●●●●●●●●●●●●●●●●●●●●●●●●●●●●●●●●●●●●●●●●●●●●●●●●●●●●●●●●●●●●●●●●●●●●●●●●●●●●●●●●●●●●●●●●●●●●●●●●●●●●●●●●●●●●●●●●●●●●●●●●●●●●●●●●●●●●●●●●●●●●●●●●●●●●●●●●●●●●●●●●●●●●●●●●●●●●●●●●●●●●●●●●●●●●●●●●●●●●●●●●●●●●●●●●●●●●●●●●●●●●●●●●●●●●●●●●●●●●●●●●●●●●●●●●●●●●●●●●●●●●●●●●●●●●●●●●●●●●●●●●●●●●●●●●●●●●●●●●●●●●●●●●●●●●●●●●●●●●●●●●●●●●●●●●●●●●●●●●●●●●●●●●●●●●●●●●●●●●●●●●●●●●●●●●●●●●●●●●●●●●●●●●●●●●●●●●●●●●●●●●●●●●●●●●●●●●●●●●●●●●●●●●●●●●●●●●●●●●●●●●●●●●●●●●●●●●●●●●●●●●●●●●●●●●●●●●●●●●●●●●●●●●●●●●●●●●●●●●●●●●●●●●●●●●●●●●●●●●●●●●●●●●●●●●●●●●●●●●●●●●●●●●●● ●●●●●●●●●●●
● ●●
●● ● ●
● ●
●●●●●●●●●●●●●●●●●●●●●●●●●●●●●●●●●●●●●●●●●●●●●●●●●●●●●●●●●●●●●●●●●●●●●●●●●●●●●●●●●●●●●●●●●●●●●●●●●●●●●●●●●●●●●●●●●●●●●●●●●●●●●●●●●●●●●●●●●●●●●●●●●●●●●●●●●●●●●●●●●●●●●●●●●●●●●●●●●●●●●●●●●●●●●●●●●●●●●●●●●●●●●●●●●●●●●●●●●●●●●●●●●●●●●●●●●●●●●●●●●●●●●●●●●●●●●●●●●●●●●●●●●●●●●●●●●●●●●●●●●●●●●●●●●●●●●●●●●●●●●●●●●●●●●●●●●●●●●●●●●●●●●●●●●●●●●●●●●●●●●●●●●●●●●●●●●●●●●●●●●●●●●●●●●●●●●●●●●●●●●●●●●●●●●●●●●●●●●●●●●●●●●●●●●●●●●●●●●●●●●●●●●●●●●●●●●●●●●●●●●●●●●●●●●●●●●●●●●●●●●●●●●●●●●●●●●●●●●●●●●●●●●●●●●●●●●●●●●●●●●●●●●●●●●●●●●●●●●●●●●●●●●●●●●●●●●●●●●●●●●●●●●●●●●●●●●●●●●●●●●●●●●●●●●●●●●●●●●●●●●●●●●●●●●●●●●●●●●●●●●●●●●●●●●●●●●●●●●●●●●●●●●●●●●●●●●●●●●●●●●●●●●●●●●●●●●●●●●●●●●●●●●●●●●●●●●●●●●●●●●●●●●●●●●●●●●●●●●●●●●●●●●●●●●●●●●●●●●●●●●●●●●●●●●●●●●●●●●●●●●●●●●●●●●●●●●●●●●●●●●●●●●●●●●●●●●●●●●●●●●●●●●●●●●●●●●●●●●●●●●●●●●●●●●●●●●●●●●●●●●●●●●●●●●●●●●●●●●●●●●●●●●●●●●●●●●●●●●●●●●●●●●●●●●●●●●●●●●●●●●●●●●●●●●●●●●●●●●●●●●●●●●●●●●●●●●●●●●●●●●●●●●●●●●●●●●●●●●●●●●●●●●●●●●●●●●●●●●●●●●●●●●●●●●●●●●●●●●●●●●●●●●●●●●●●●●●●●● ●
● ●
● HEL
5 10 20 50 100 200 5001000 20005000
Observed SWH [m] Observed SWH [m] Observed SWH [m]
Simula
ted
SWH
[m
]
Simula
ted
SWH
[m
]
Simula
ted SWH [m
]
Figure 2.Scatter and quantile–quantile plot of SWH (in metres) between in situ observation (x-axis) and coastDat2 hindcast data (y-axis).
Coloured squares indicate the number of data in each 0.5 m×0.5 m bin. Coloured dots represent the percentile values of the quantile–quantile
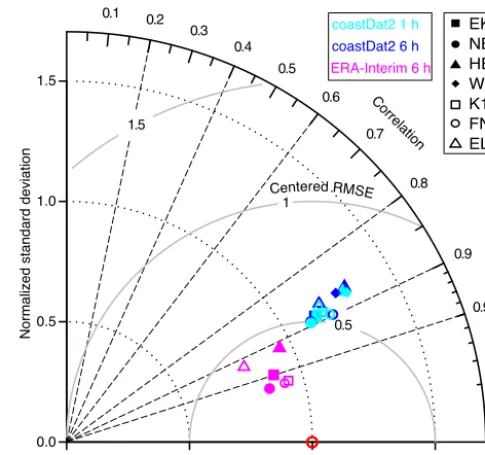
ERA-Interim reanalysis. Here, generally, a tendency towards an underestimation of the higher SWHs can be inferred. This feature is most pronounced at near-coastal locations such as at station ELB. An evaluation with a normalized Tay-lor diagram (Fig. 3) indicates that for both the ERA-Interim and the coastDat2 SWHs, correlation with observations typ-ically varies around 0.9 with the values being slightly higher for the ERA-Interim reanalysis. The analysis further reveals that the observed SWH variability is somewhat underesti-mated by the ERA-Interim reanalysis and overestiunderesti-mated in the coastDat2 data set. The centred root mean square er-rors are slightly above (below) 0.5 m for coastDat2 (ERA-Interim). Comparing 6 h instead of hourly values for the coastDat2 SWHs, no substantial differences for the statisti-cal values used by the Taylor diagram can be found. A more detailed comparison of error statistics for the seven locations is provided in Table 2.
A spatial comparison of the differences between ERA-Interim and coastDat2 SWHs for the common period 1980– 2014 is illustrated in Fig. 4. With the exception of near-coastal waters, the SWH obtained from the coastDat2 hind-cast is on average higher compared to that from the ERA-Interim reanalysis, with increasing differences from south to north. Largest systematic differences of up to 0.6 m were found off the Norwegian coast. A similar spatial pattern is obtained when root mean square differences are compared. These differences were found to vary between about 0.4 m in the southern North Sea and more than 0.9 m in the northern parts of the model domain. When the bias is removed from the root mean square differences, again a similar pattern for the standard deviation of differences with somewhat smaller values compared to the root mean square differences is ob-tained.
When the spatial comparison is made with the SWHs de-rived from the GlobWave satellite data set instead of ERA-Interim, differences are less distinct but still present (Fig. 5). Similar spatial features but with smaller values are found in the southern North Sea and near the coasts. The latter cor-responds to too small wave heights in ERA-Interim when compared to GlobWave data (not shown). Although the un-derestimation may reach values of up to 0.4 m on average, the magnitude of the systematic differences between ERA-Interim and GlobWave is still smaller than that between the coastDat2 and the GlobWave data. Note that the robustness of these results is limited, as the number of available satel-lite data is small. For most of the domain less than 100 co-located data points were available for the comparison. This corresponds to only about 0.1 % of the potentially available hourly values within the period 1992–2014.
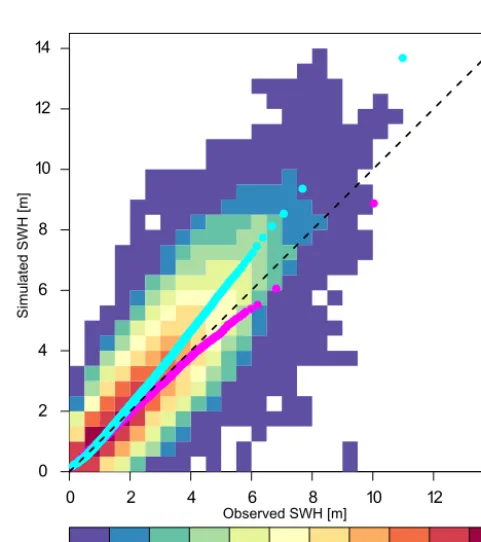
To obtain a more robust figure, an additional comparison of co-located data from GlobWave and coastDat2 was made, taking all co-located data irrespective of their location into account. The results are shown in Fig. 6 and corresponding error statistics are presented in Table 2. Altogether, errors statistics obtained and conclusions derived from this
exer-No
rm
a
liz
e
d
s
ta
n
d
a
rd
d
e
v
ia
tio
n
0.5 1 1.5
0.1 0.2 0.3
0.4 0.5
0.6 0.7
0.8
0.9
0.95
0.99 Corr
elation
●
● ●
coastDat2 1 h coastDat2 6 h ERA-Interim 6 h
●
EKO NB2 HEL WES K13 FN1 ELB 1.5
1.0
0.5
0.0
0.0 0.5 1.0 1.5
C entered RMSE
Figure 3.Normalized Taylor diagram from 1 h (cyan) and 6 h (blue) coastDat2 SWHs and from 6 h ERA-Interim (magenta) SWHs at seven (coastDat2) and at six (ERA-Interim) observational sites. The red circle represents a perfect model compared to the observations.
cise are similar to those based on comparison with in situ ob-servations. Values for bias and RMSE are slightly enhanced compared to those derived from comparison with in situ ob-servations. This can be attributed to the fact that most of the in situ observations were taken in the southern part of the North Sea, where error statistics of the coastDat2 hindcast are smaller, while the more northern parts with larger errors have a stronger weight in the GlobWave comparison.
4.2 Wave period
Different definitions for wave periods are used depending on the specific analysis. Here two of the more frequently used measures are used for comparison with observations: (i) the mean zero crossing period derived from the
zeroth-and second-order moment of the spectrum (Tm02) and (ii) the
mean wave period (MWP) defined by the ratio of the first-and zeroth-order moment of the spectrum corresponding to the total energy of the wave spectrum (Holthuijsen, 2007). The comparison is made based on the availability of the dif-ferent data sets.
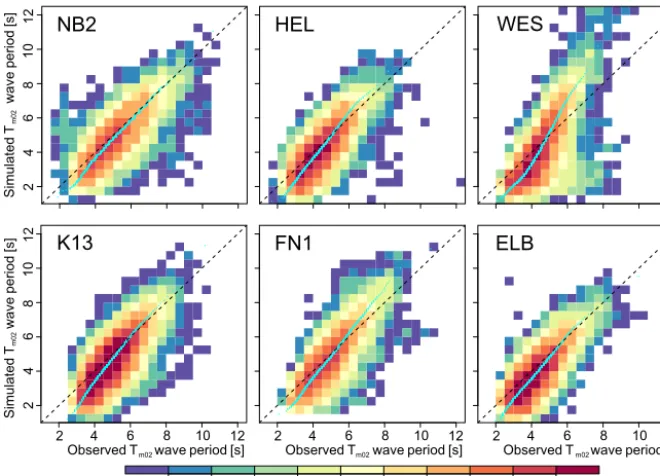
When observed and hindcastTm02periods are compared,
(m )
4° W 2° W 0° 2° E 4° E 6° E 8° E 10° E 12° E
-0.6 -0.4 -0.2 0 0.2 0.4 0.6 0.35 0.45 0.55 0.65 0.75 0.35 0.45 0.55 0.65 0.75
(m ) (m )
51° N 52° N 53° N 54° N 55° N 56° N 57° N 59° N 58° N
4° W 2° W 0° 2° E 4° E 6° E 8° E 10° E 12° E 4° W 2° W 0° 2° E 4° E 6° E 8° E 10° E 12° E
(a) (b) (c)
Figure 4.Spatial distribution (in metres) of bias(a), root mean square distance(b)and standard deviation of the error(c)between SWHs derived from the coastDat2 hindcast and the ERA-Interim reanalysis for the period 1980–2014.
-0.6 -0.4 -0.2 0 0.2 0.4 0.6 0.35 0.45 0.55 0.65 0.75 0.35 0.45 0.55 0.65 0.75
(m) (m)
51° N 52° N 53° N 54° N 55° N 56° N 57° N 58° N 59° N 51° N 52° N 53° N 54° N 55° N 56° N 57° N 58° N 59° N
4° W 2° W 0° 2° E 4° E 6° E 8° E 10° E 12° E 4° W 2° W 0° 2° E 4° E 6° E 8° E 10° E 12° E 4° W 2° W 0° 2° E 4° E 6° E 8° E 10° E 12° E (m)
(a) (b) (c)
Figure 5.Spatial distribution of bias(a), root mean square error(b)and standard deviation of the error(c)[m] between SWHs from the coastDat2 hindcast and the GlobWave data set for the period 1992–2014 when all available satellite data are used for comparison (top) and when only data with more than 100 flyovers per grid point are used (bottom).
Table 3.Error metrics for theTm02period at six locations derived from in situ observations (OBS) and coastDat2 hindcast (CD2) data for hourly values.
Name Count Mean (s) Standard deviation (s) Bias (s) RMSE (s) Scatter index Correlation
CD2 OBS / CD2 OBS / CD2 CD2 CD2 CD2 CD2
K13 84744 4.76 / 4.37 0.91 / 1.21 −0.39 0.84 0.18 0.79
NB2 28485 4.92 / 4.65 1.19 / 1.34 −0.27 0.87 0.18 0.79
FN1 30893 4.72 / 4.51 1.05 / 1.14 −0.21 0.82 0.17 0.82
HEL 46074 4.32 / 3.93 0.93 / 1.21 −0.30 0.81 0.19 0.78
ELB 55190 4.03 / 3.6 0.92 / 1.12 −0.43 0.82 0.20 0.78
Table 4.Error metrics for the MWP at four locations derived from in situ observations (OBS), coastDat2 hindcast (CD2) and ERA-Interim (ERAi) data for 1 h (coastDat2) and 6 h (ERA-Interim) data, respectively.
Name Count Mean (s) Standard deviation (s) Bias (s) RMSE (s) Scatter index Correlation
CD2/ERAi OBS / CD2 / ERAi OBS / CD2 / ERAi CD2 / ERAi CD2 / ERAi CD2 / ERAi CD2 / ERAi
NB2 28485 / 5254 5.25 / 6.16 / 5.75 1.23 / 1.54 / 1.2 0.91 / 0.59 1.31 / 0.83 0.25 / 0.16 0.79 / 0.88
FN1 30893 / 4655 5.11 / 6.14 / 5.75 1.19 / 1.66 / 1.21 1.04 / 0.62 1.41 / 0.8 0.28/0.16 0.82 / 0.91
ELB 55190 / 14292 4.32 / 4.99 / 4.96 1.02 / 1.39 / 1.05 0.67 / 0.63 1.08 / 0.87 0.25 / 0.2 0.8 / 0.83
WES 43979 / NA 4.58 / 5.45 / NA 1.02 / 1.77 / NA 0.87 / NA 1.46 / NA 0.32 / NA 0.78 / NA
NA: not available.
Table 5.Error metrics for the mean wave direction at three locations derived from in situ observations (OBS), coastDat2 hindcast (CD2) and ERA-Interim (ERAi) data for 1 h (coastDat2) and 6 h (ERA-Interim) data, respectively.
Name Count Mean (◦) Standard deviation (◦) Bias (◦) RMSE (◦) Scatter index Correlation
CD2/ERAi OBS / CD2 / ERAi OBS / CD2 / ERAi CD2 / ERAi CD2 / ERAi CD2 / ERAi CD2 / ERAi
NB2 28485 / 5254 241 / 233 / 226 99 / 100 / 95 26 / 24 41 / 37 0.17 / 0.15 0.79 / 0.85
K13 84744 / 42372 204 / 205 / 217 113 / 117 / 107 25 / 22 40 / 35 0.20 / 0.17 0.82 / 0.86
FN1 30893 / 4655 254 / 238 / 235 102 / 105 / 97 24 / 26 38 / 38 0.15 / 0.15 0.83 / 0.85
wave dissipation caused by missing small-scale bathymetric features not resolved at the given spatial resolution of the wave hindcast model.
A spatial comparison of the MWPs from the coastDat2 hindcast and the ERA-Interim reanalysis for the period 1980–2014 is presented in Fig. 8. On average, the coast-Dat2 hindcast shows longer MWP (up to more than 0.6 s) for large areas of the North Sea with the largest differences occurring in the deeper waters in the northeastern part of the model domain. In coastal areas, differences are mostly less pronounced. For the root mean square differences and the standard deviation of the differences, similar spatial patterns can be inferred.
A comparison betweenTm02period measures derived from
observations and the coastDat2 hindcast is presented in Ta-ble 3. The MWP measures between observations, coastDat2 hindcast and the ERA-Interim reanalysis are presented in
Ta-ble 4. It can be inferred that, compared to observations,Tm02
periods are on average underestimated in the coastDat2 hind-cast while MWPs are on average overestimated. For
ERA-Interim no Tm02 data were available. MWPs are similarly
biased high, although with somewhat smaller values. Vari-ability is generally overestimated in both model simulations with the ERA-Interim errors again being smaller.
0 2 4 6 8 10 12 14
0 2 4 6 8 10 12 14
●●●●●●●●●●●●●●●●●●●●●●●●●●●●●●●●●●●●●●●●●●●●●●●●●●●●●●●●●●●●●●●●●●●●●●●●●●●●●●●●●●●●●●●●●●●●●●●●●●●●●●●●●●●●●●●●●●●●●●●●●●●●●●●●●●●●●●●●●●●●●●●●●●●●●●●●●●●● ● ● ● ● ● ● ● ● ●
●●●●●●●●●●●●●●●●●●●●●●●●●●●●●●●●●●●●●●●●●●●●●●●●●●●●●●●●●●●●●●●●●●●●●●●●●●●●●●●●●●●●●●●●●●●●●●●●●●●●●●●●●●●●●●●●●●●●●●●●●●●●●●●●●●●●●●●●●●●●●●●●●●●●●●●●●●●●●●●●●●●●●●●●●●●●●●●●●●●●●●●●●●●●●●●●●●●●●●●●●●●●●●●●●●●●●●●●●●●●●●●●●●●●●●●●●●●●●●●●●●●●●●●●●●●●●●●●●●●●●●●●●●●●●●●●●●●●●●●●●●●●●●●●●●●●●●●●●●●●●●●●●●●●●●●●●●●●●●●●●●●●●●●●●●●●●●●●●●●●●●●●●●●●●●●●●●●●●●●●●●●●●●●●●●●●●●●●●●●●●●●●●●●●●●●●●●●●●●●●●●●●●●●●●●●●●●●●●●●●●●●●●●●●●●●●●●●●●●●●●●●●●●●●●●●●●●●●●●●●●●●●●●●●●●●●●●●●●●●●●●●●●●●●●●●●●●●●●●●●●●●●●●●●●●●●●●●●●●●●●●●●●●●●●●●●●●●●●●●●●●●●●●●●●●●●●●●●●●●●●●●●●●●●●●●●●●●●●●●●●●●●●●●●●●●●●●●●●●●●●●●●●●●●●●●●●●●●●●●●●●●●●●●●●●●●●●●●●●●●●●●●●●●●●●●●●●●●●●●●●●●●●●●●●●●●●●●●●●●●●●●●●●●●●●●●●●●●●●●●●●●●●●●●●●●●●●●●●●●●●●●●●●●●●●●●●●●●●●●●●●●●●●●●●●●●●●●●●●●●●●●●●●●●●●●●●●●●●●●●●●●●●●●●●●●●●●●●●●●●●●●●●●●●●●●●●●●●●●●●●●●●●●●●●●●●●● ●
●
●●●●●●●●●●●●●●●●●●●●●●●●●●●●●●●●●●●●●●●●●●●●●●●●●●●●●●●●●●●●●●●●●●●●●●●●●●●●●●●●●●●●●●●●●●●●●●●●●●●●●●●●●●●●●●●●●●●●●●●●●●●●●●●●●●●●●●●●●●●●●●●●●●●●●●●●●●●●●●●●●●●●●●●●●●●●●●●●●●●●●●●●●●●●●●●●●●●●●●●●●●●●●●●●●●●●●●●●●●●●●●●●●●●●●●●●●●●●●●●●●●●●●●●●●●●●●●●●●●●●●●●●●●●●●●●●●●●●●●●●●●●●●●●●●●●●●●●●●●●●●●●●●●●●●●●●●●●●●●●●●●●●●●●●●●●●●●●●●●●●●●●●●●●●●●●●●●●●●●●●●●●●●●●●●●●●●●●●●●●●●●●●●●●●●●●●●●●●●●●●●●●●●●●●●●●●●●●●●●●●●●●●●●●●●●●●●●●●●●●●●●●●●●●●●●●●●●●●●●●●●●●●●●●●●●●●●●●●●●●●●●●●●●●●●●●●●●●●●●●●●●●●●●●●●●●●●●●●●●●●●●●●●●●●●●●●●●●●●●●●●●●●●●●●●●●●●●●●●●●●●●●●●●●●●●●●●●●●●●●●●●●●●●●●●●●●●●●●●●●●●●●●●●●●●●●●●●●●●●●●●●●●●●●●●●●●●●●●●●●●●●●●●●●●●●●●●●●●●●●●●●●●●●●●●●●●●●●●●●●●●●●●●●●●●●●●●●●●●●●●●●●●●●●●●●●●●●●●●●●●●●●●●●●●●●●●●●●●●●●●●●●●●●●●●●●●●●●●●●●●●●●●●●●●●●●●●●●●●●●●●●●●●●●●●●●●●●●●●●●●●●●●●●●●●●●●●●●●●●●●●●●●●●●●●●●●●●●●●●●●●●●●●●●●●●●●●●●●●●●●●●●●●●●●●●●●●●●●●●●●●●●●●●●●●●●●●●●●●●●●●●●●●●●●●●●●●●●●●●●●●●●●●●●●●●●●●●●●●●●●●●●●●●●●●●●●●●●●●●●●●●●●●●●●●●●●●●●●●●●●● ●●●●●●●●●●●●
●●●● ●●
●
●
50 100 200 500 1000 2000 Observed SWH [m]
Simula
ted SWH [m
]
5000 10 000 20 000 50 000
Figure 6.Scatter and quantile–quantile plot of SWH (in metres)
between altimeter (GLOBWAVE) observation (x-axis) and
coast-Dat2 hindcast data (y-axis). Coloured squares indicate the number
of the data in each 0.5 m×0.5 m bin. Coloured dots represent the
![Figure 5. Spatial distribution of bias (a), root mean square error (b) and standard deviation of the error (c) [m] between SWHs from thecoastDat2 hindcast and the GlobWave data set for the period 1992–2014 when all available satellite data are used for comparison (top) andwhen only data with more than 100 flyovers per grid point are used (bottom).](https://thumb-us.123doks.com/thumbv2/123dok_us/8980192.1889560/6.612.85.509.278.507/distribution-deviation-thecoastdat-globwave-available-satellite-comparison-yovers.webp)