Improving accuracy of corneal power
measurement with partial coherence
interferometry after corneal refractive surgery
using a multivariate polynomial approach
Michele Lanza
1*, Robert Koprowski
2and Mario Bifani Sconocchia
1Background
Unreliable corneal power evaluation is considered to be among the most important causes of lack of intraocular lens (IOL) power calculation accuracy after myopic exci-mer laser corneal refractive surgery (MECRS) [1, 2]. Currently, ophthalmologists have many different devices that are able to evaluate corneal power with high precision in eyes that did not have any surgery. However, this accuracy decreases drastically after refractive surgery, major causes of this problem are (1) the inability to calculate the exact anterior corneal curvature by current available devices because of corneal surface altera-tion after refractive surgery and (2) an invalidated keratometric index due to a change of relationship between the anterior and the posterior corneal surface [1, 2]. Typically, it is possible to observe an overestimation of corneal power after MECRS, which leads to
Abstract
Background: To improve accuracy of IOLMaster (Carl Zeiss, Jena, Germany) in corneal power measurement after myopic excimer corneal refractive surgery (MECRS) using multivariate polynomial analysis (MPA).
Methods: One eye of each of 403 patients (mean age 31.53 ± 8.47 years) was sub-jected to MECRS for a myopic defect, measured as spherical equivalent, ranging from
− 9.50 to − 1 D (mean − 4.55 ± 2.20 D). Each patient underwent a complete eye examination and IOLMaster scan before surgery and at 1, 3 and 6 months follow up. Axial length (AL), flatter keratometry value (K1), steeper keratometry value (K2), mean keratometry value (KM) and anterior chamber depth measured from the corneal endothelium to the anterior surface of the lens (ACD) were used in a MPA to devise a method to improve accuracy of KM measurements.
Results: Using AL, K1, K2 and ACD measured after surgery in polynomial degree 2 analysis, mean error of corneal power evaluation after MECRS was + 0.16 ± 0.19 D. Conclusions: MPA was found to be an effective tool in devising a method to improve precision in corneal power evaluation in eyes previously subjected to MECRS, accord-ing to our results.
Keywords: Refractive surgery, IOLMaster, Corneal power, Artificial intelligence
Open Access
© The Author(s) 2018. This article is distributed under the terms of the Creative Commons Attribution 4.0 International License (http://creat iveco mmons .org/licen ses/by/4.0/), which permits unrestricted use, distribution, and reproduction in any medium, provided you give appropriate credit to the original author(s) and the source, provide a link to the Creative Commons license, and indicate if changes were made. The Creative Commons Public Domain Dedication waiver (http://creat iveco mmons .org/publi cdoma in/zero/1.0/) applies to the data made available in this article, unless otherwise stated.
RESEARCH
an underestimation of IOL power calculated according to these data and consequently to hyperopic refraction after cataract surgery [3–5]. Hyperopia after cataract surgery is a very unsatisfactory condition. For this reason, many methods have been developed to overcome this problem [6–20]. New formulas have been introduced and new algorithms have been developed in order to provide more accuracy in IOL power calculation for these cases [21–23]. It is important to remember that the number of people who have undergone refractive surgery in the past is very high and currently the number is still increasing. It is easy to imagine that in the future most patients facing cataract surgery may have already had a previous refractive operation [24, 25]. However, a precise meas-urement of corneal power in patients who have previously undergone MECRS can help us to understand whether undercorrection or overcorrection is due to an error in the excimer laser calibration or in the evaluation of refraction before surgery, in order to design better ablation profiles for this type of surgery [16, 23].
One of the most widespread and reliable devices for measuring corneal power and cal-culating IOL power is IOLMaster (Carl Zeiss, Jena, Germany), a device that is able to measure axial length by partial coherence interferometry (PCI) and corneal power by automated keratometry, its accuracy in eyes not previously submitted to MERCS is very high but even this instrument has proved to be unreliable in corneal power evaluation after MECRS [26, 27]. By browsing biomedical engineering articles in search of methods to improve the measurements of devices, it can be observed that there is an equal pref-erence between two approaches: those using mathematical methods for understanding and simulating phenomena in medicine and those that do not use such methods [28, 29]. The use of mathematical methods to replicate medical phenomena has certainly broad-ened the area of research in the field of simulation and testing. On the other hand, it is difficult to reproduce any process occurring in the living organism using the limited tools offered by mathematics [30–32]. While artificial intelligence methods still have certain limitations, they should prove useful in this field of knowledge. The purpose of this study is to improve the reliability of corneal power measurement using IOLMaster with the help of the polynomial method.
Methods
subjective refractions, thereby achieving the best-corrected visual acuity. Cyclople-gic refraction was performed during the first visit, whereas subjective refraction was determined during the last visit before surgery, taking into account the cycloplegic refraction results. All surgical treatments were performed under topical anesthesia using oxybuprocaine eye drops (Benoxinato® Alfa Intes, Italy) using an Allegretto Wave excimer laser system (WaveLight Laser Technologies AG, Erlangen, Ger-many). After surgery, the operated eye received the following medications: diclofenac sodium 0.1% eye drops twice a day for the first 2 days, moxifloxacin preservative-free eye drops until re-epithelialization and preservative-free artificial tears for 1 month. After re-epithelialization, clobetasone eye drops were prescribed for all patients for at least 1 month, four times a day. Preoperative and follow-up examinations at 1, 3 and 6 months after PRK included a comprehensive ophthalmologic examination and IOLMaster evaluation.
Data distributions were checked for normality by means of the Kolmogorov–Smirnov test, which showed that all data were normally distributed (p > 0.05). Statistical evalua-tion of the differences in the studied parameters before and after surgery was performed with SPSS (version 19.0, IBM Corporation) using the Student’s T-test for paired data. Refractions and data from IOLMaster scans performed at 6-month follow-up were used to evaluate reliability of the corneal power measurements. The data obtained in the last follow-up were selected because they should be more stable in both refraction and mor-phological evaluations. Parameters from IOLMaster selected for the study were axial length (AL), flatter keratometry value (K1), steeper keratometry value (K2), mean ker-atometry value (KM) and anterior chamber depth measured from the corneal endothe-lium to the anterior surface of the lens (ACD).
Effective treatment was calculated as the difference between the refractive defect that was to be completely removed and refraction measured at 6-month follow-up; these val-ues were compared with differences in corneal power measured by IOLMaster before surgery and after 6 months. If there is a significant difference between effective treat-ment and corneal power changes measured by IOLMaster, it means that this device is not reliable in measuring the corneal curvature after MECRS.
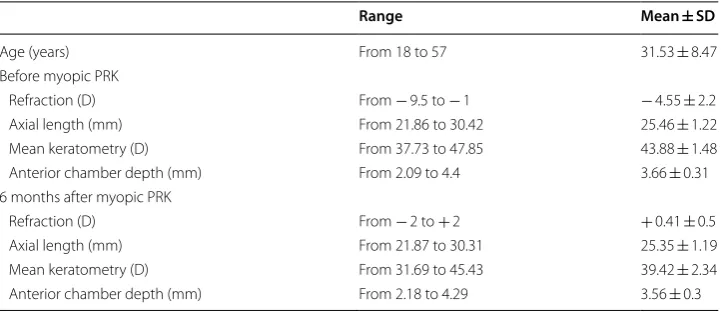
Table 1 Range, mean and standard deviation (SD) of refractions and parameters measured with IOLMaster such as axial length (AL), mean keratometry (KM), anterior chamber depth (ACD) before refractive surgery and at 6 months follow up
Range Mean ± SD
Age (years) From 18 to 57 31.53 ± 8.47
Before myopic PRK
Refraction (D) From − 9.5 to − 1 − 4.55 ± 2.2 Axial length (mm) From 21.86 to 30.42 25.46 ± 1.22 Mean keratometry (D) From 37.73 to 47.85 43.88 ± 1.48 Anterior chamber depth (mm) From 2.09 to 4.4 3.66 ± 0.31 6 months after myopic PRK
This approach aims to increase precision of IOLMaster in measuring corneal power after MECRS using polynomial methods. Within the framework of the study, all combi-nations of these parameters were tested: AL; K1; K2; KM and ACD.
In addition, the corrected value of mean keratometry expected (KMR) was calculated.
This value represents the one that should have been observed after MECRS in the evalu-ated eyes. It has been calculevalu-ated adding to the mean keratometry (KM) measured before surgery to the effective treatment. The number of defined and analyzed parameter com-binations was limited to five:
• AL, K1, K2, ACD;
• AL, ACD;
• AL, K1, K2;
• AL;
• K1, K2.
The selection of these combinations has been adopted taking in account parameters usually measured and utilized in formulas for IOL calculation, moreover there are the parameters more often able to provide indications about refractive defect of eyes. For these reasons, combinations including only one keratometric value, such as K1 or K2, have not been purposed: they could bias the overall analysis: these values alone could not provide reliable indications about corneal power.
A multivariate polynomial approach was used, which fits a general polynomial regres-sion model in n dimenregres-sions. The value of n dimenregres-sions was changed in the range n∈(1,7). The proposed range results from the limitations adopted for the distribution of patients’ parameters. The approximation of the relationships between AL, K1, K2, ACD and the resulting KMR is not linear [33], therefore the value of n dimensions of the polynomial
regression model must be above one. On the other hand, too high n values will result in overfitting the data. This analysis was performed using the author’s (Koprowski) algo-rithm which works fully automatically and repeatedly, allowing for quantitative results. This algorithm was written in MATLAB Version 7.11.0.584 (R2010b), Operating System: Microsoft Windows 7 Version 6.1 (Build 7601: Service Pack 1), Java VM Version: Java 1.6.0_17-b04 with Sun Microsystems Inc. Java HotSpot (TM) 64-Bit Server VM mixed mode, with: Bioinformatics Toolbox, Version 3.6 (R2010b); Image Acquisition Toolbox, Version 4.0 (R2010b); Image Processing Toolbox, Version 7.1 (R2010b); Neural Network Toolbox Version 7.0, (R2010b); Statistics Toolbox, Version 7.4 (R2010b) and Wavelet Toolbox Version 4.6 (R2010b). The calculations lasted no more than one second on a Windows-based PC and the Intel i7-3770 processor.
All procedures performed in studies involving human participants were in accord-ance with the ethical standards of the institutional and/or national research committee and with the 1964 Helsinki declaration and its later amendments or comparable ethical standards. For this type of study formal consent is not required because patients signed an informed consent for the surgical procedures that included use of data for following eventual studies.
Results
The results were obtained in two stages:
• Data pre-processing and,
• Multidimensional polynomial approximation.
Data pre‑processing
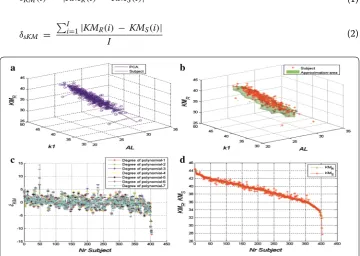
In the initial stage, the changes in KMR values as a function of K1 and AL were
visual-ized. The values of K1 and AL were selected arbitrarily only for the visualization of the changes and preliminary assessment of the complexity of the problem. This visualiza-tion, shown in Fig. 1a, b, was supplemented with principal component analysis (PCA) and analysis of clusters based on the analysis of the distance between the data of individ-ual patients. In the first case (Fig. 1b), one main component was proposed—marked with a black line in Fig. 1a. The calculated coordinates K1, AL and KMR of the extreme points
for all analysed patients are 29.1, 30.5 and 29.5 and 23.1, 43.8 and 44.6. The assessment of the possibility of approximating this distribution with one main component was per-formed by defining the error δKM(i) for a single patient and the error δsKM(i) as the mean
error for all I patients:
(1)
δKM(i) = |KMR(i) − KMS(i)|
(2)
δsKM =
I
i=1|KMR(i) − KMS(i)|
I
where: KMR: true data (ground true)—the value of KM calculated for the patient after
correction, calculated taking into account effective treatment after surgery, KMS:
predic-tion data—the value predicted using the approach discussed, i: subject number.
The error of fitting one main component to the corrected data (KMR) is 2.3 + 1.1
D (mean error for all I subjects with standard deviation). For the second approach described, measurement of distances for each point (between ground true and predic-tion data) in the three-dimensional space was proposed. This enabled the creapredic-tion of an approximated area covering a cluster of points, where the extreme values of the parame-ters were rejected. The resulting three-dimensional object allows for predictions of KMR
values based on the parameters K1 and AL (Fig. 1b). The values of the error δsKM in this
case exceeded 3D. Therefore, the polynomial approach was proposed for use.
Multidimensional polynomial prediction
In the polynomial approach, the value of n dimensions was changed in the range n∈(1,7). The results of the error δsKM for all 403 patients and parameters AL, K1, K2 and ACD
are shown in Fig. 1c, where it is possible to observe that the error values are quite large and vary widely. The minimum value is − 13 and the maximum one is + 15 D. Of the seven polynomial degrees, n = 7 was chosen. The results obtained for all the parameters and polynomial approach are shown in Fig. 1d. The KMS prediction values are very close
to KMR values. The quantitative results are shown in Table 2 (the training and test sets).
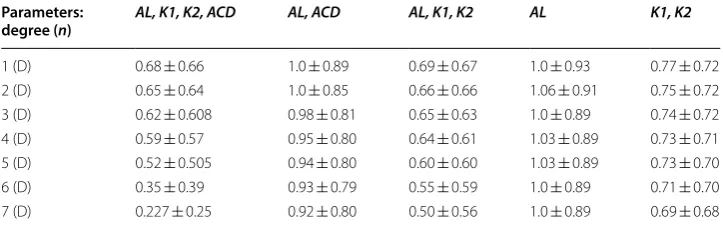
The table presented (Table 2) shows that the smallest error values are for n = 7 and four parameters AL, K1, K2 and ACD, and are 0.227 ± 0.25 D. The largest values of δSKM
are obtained for AL and n = 2, i.e. 1.06 ± 0.91. By analysing this table with the results, it can be assumed that the next polynomial degrees n = 8, n = 9 etc. will increase the predictive accuracy of KM values. Since overfitting data is very likely in this case, the set of 403 patients was divided into two subsets: the training set comprising 2/3 of the total number (269 patients) and the test set comprising the remaining one-third (134 patients). The division of the sets results from the typical proportions applied, e.g. in machine learning and classification [the objects were randomly selected—a random generator was created matrix containing pseudorandom values drawn from the stand-ard uniform distribution on the open interval (0,1)]. The training set is the basis for
Table 2 Mean values of the error δSKM (and standard deviation) between real
and predicted data KM for different combinations of parameters and different polynomial degrees (for 403 patients constituting the training and test sets)
AL axial length, K1 flatter keratometry value, K2 steeper keratometry value, KM mean keratometry value, ACD anterior chamber depth measured from the corneal endothelium to the anterior surface of the lens
Parameters:
degree (n) AL, K1, K2, ACD AL, ACD AL, K1, K2 AL K1, K2
calculating polynomial coefficients, whereas the values of δSKM are calculated for the test
set. The results are shown in Table 3.
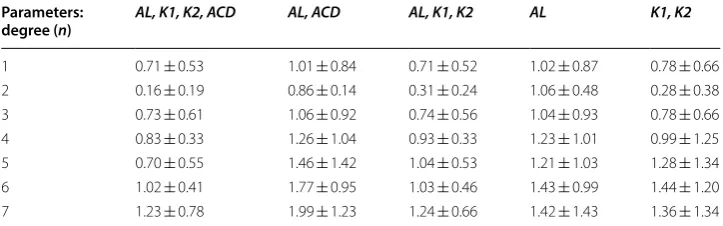
According to the above table (Table 3), the mean error in calculating corneal power after MECRS using AL, K1, K2, ACD and n = 2 is + 0.16 ± 0.19 D. Above the second polynomial degree, there occurs the problem of overfitting data. For this reason, for the same training and test data (as was the case with the results shown in Table 2) for n = 5, 6 and 7, the results obtained were apparently incrementally better. On the other hand, when the division into training and test data was applied, the actual error was + 0.16 ± 0.19 D, this is representing the error in corneal power evaluation after MERCS when this method was applied. When analysing Table 3, it should be noted that the high-est error values were obtained for the parameters AL and ACD as well as AL. This is also confirmed by the results presented in Table 2.
Example: formula for variable K1, K2 and 1 order polynomial:
The formula proposed by the authors to calculate KMS (variable AL, K1, K2. ACD and
2 order polynomial – please see Table 3).
Discussion
Cataract surgery is no longer perceived as sight-saving surgery but as a refractive operation. Patients do not only expect vision improvement following surgery but they often demand better quality of vision, free of spectacles [24]. A satisfactory refractive result, represented by a postoperative refractive defect in spherical equivalent ± 0.5 D and astigmatism < 1 D is the goal, in many cases, of phacoemulsification and IOL implant but only 55% of the eyes that undergo this surgery will achieve this result [25]. Moreover, patients who have previously undergone MECRS have high expectations (3)
KMS = −1.0359 + K1 ∗ 0.4345 + K2 ∗ 0.5769
(4)
KMS = 11.12 ∗ AL− 4.51∗ K1 +8.1 ∗ K2− 21.09 ∗ACD + 0.0061∗ AL ∗ K1
−0.115 ∗ AL∗ K2 +0.521 ∗ AL∗ ACD +0.013 ∗ K1 ∗K2
−0.034 ∗ K1 ∗ACD + 0.235∗ K2 ∗ACD − 0.183∗ AL2
+0.054 ∗ K12 −0.075 ∗ K22 + 0.034 ∗ ACD2 − 143.7
Table 3 Mean values of the error δSKM (and standard deviation) between real
and predicted data KM for different combinations of parameters and different polynomial degrees (for the test set)
AL axial length, K1 flatter keratometry value, K2 steeper keratometry value, KM mean keratometry value, ACD anterior chamber depth measured from the corneal endothelium to the anterior surface of the lens
Parameters:
degree (n) AL, K1, K2, ACD AL, ACD AL, K1, K2 AL K1, K2
of improved vision without spectacles but it is much harder in these eyes to achieve emmetropia after cataract surgery [25, 34, 35].
Patients who underwent myopic refractive surgery often have a change in the opti-cal profile of the cornea and variable degrees of astigmatism [35]. When these eyes, whose anatomy is modified by an excimer laser, develop cataracts, there may be very disappointing hyperopic results due to difficulties in calculating the IOL power to be implanted during cataract surgery [35].
The ideal method to estimate accurate corneal power is to measure it directly with a reliable device. IOLMaster is a very widespread and easy to use device, and once its precision in corneal power evaluation after MECRS has improved, it will provide ophthalmologists with a satisfactory solution to this problem without any additional cost for offices or hospitals.
Different correcting formulas have been proposed in order to improve reliability of corneal power evaluation after MECRS [8–20] and most of them rely on linear regres-sion calculation of the correcting factors that still produce a discrete lack of accuracy. In order to deal with the increasingly high expectations of patients, especially for those who have undergone MECRS in the past, physicians need to improve their tools to achieve emmetropia after cataract surgery. For this reason, a more sophisticated method to calculate corneal power would be a very good option in this field. The mul-tivariate polynomial one, was selected because of its reliability. In order to obtain the best results, it is fundamental to remember that this strategy may produce a wide range of error if proper polynomial degree analysis is not chosen (Fig. 1c). In this study, 7 degrees were selected. It is important to emphasize that these calculations were performed on 403 eyes, which is a very substantial population. It also takes into account morphological and refractive data at 6 months follow up, when the effects of surgery may be considered to be stable.
This study is purposing a new approach to accurately calculate corneal power after MERCS, it has been developed thanks to data obtained before and after myopic PRK but it is working only using the IOLMaster parameters after this kind of surgery. Fur-ther studies need to verify the clinical reliability of this methods and, if the theoreti-cal results will be confirmed in clinitheoreti-cal practice, it will support previous researchers’ theory stating that nowadays it is no longer necessary to obtain patient data before MECRS to provide an accurate IOL power calculation: many alternative methods and formulas have been tested to be reliable [36]. The next stage of our research will be to apply this method to actual cases of patients who will refer to our practices for cata-ract surgery after MECRS. This will enable to compare the results obtained with the most widespread and reliable formulas and methods used in these cases.
In conclusion, this study provides a new formula for corneal power calculation after MECRS using IOLMaster. This device has been proven to be very reliable and accu-rate in naïve eyes but has shown a lack of precision in eyes previously subjected to MECRS. The proposed correcting formula has demonstrated very satisfactory poten-tial precision as a result of the elaborated analysis strategy chosen to obtain it.
Authors’ contributions
Author details
1 Multidisciplinary Department of Medical, Surgical and Dental Sciences, Campania University “Luigi Vanvitelli”, Via de Crecchio 16, 80100 Naples, Italy. 2 Department of Biomedical Computer Systems, Faculty of Computer Science and Mate-rials Science, Institute of Computer Science, University of Silesia, Sosnowiec, Poland.
Acknowledgements Not applicable. Competing interests
The authors declare that they have no competing interests. Availability of data and materials
The datasets used and/or analysed during the current study are available from the corresponding author on reasonable request.
Consent for publication Not applicable.
Ethics approval and consent to participate
All procedures performed in studies involving human participants were in accordance with the ethical standards of the institutional and/or national research committee and with the 1964 Helsinki declaration and its later amendments or comparable ethical standards. For this type of study formal consent is not required because patients signed an informed consent for the surgical procedures that included use of data for following eventual studies.
Funding
No funding has been received for this study.
Publisher’s Note
Springer Nature remains neutral with regard to jurisdictional claims in published maps and institutional affiliations.
Received: 26 July 2018 Accepted: 9 August 2018
References
1. Hoffer KJ. Intraocular lens power calculation after previous laser refractive surgery. J Cataract Refract Surg. 2009;35:759–65.
2. Haigis W. Intraocular lens calculation after refractive surgery for myopia: Haigis L formula. J Cataract Refract Surg. 2008;34:1658–63.
3. Rosa N, Furgiuele D, Lanza M, Capasso L, Romano A. Correlation of changes in refraction and corneal topography after photorefractive keratectomy. J Refract Surg. 2004;20:478–83.
4. Rosa N, Capasso L, Lanza M, Iaccarino G, Romano A. Reliability of a new correcting factor in calculating intraocular lens power after refractive corneal surgery. J Cataract Refract Surg. 2005;31:1020–4.
5. Lanza M, Iaccarino S, Cennamo M, Lanza A, Coen G. New Scheimpflug camera device in measuring corneal power changes after myopic laser refractive surgery. Contact Lens Anterior Eye. 2015;38:115–9.
6. Shammas HJ, Shammas MC, Garabet A, Kim JH, Shammas A, LaBree L. Correcting the corneal power measurements for intraocular lens power calculations after myopic laser in situ keratomileusis. Am J Ophthalmol. 2003;136:426–32. 7. Aramberri J. Intraocular lens power calculation after corneal refractive surgery: double-K method. J Cataract Refract
Surg. 2003;29:2063–8.
8. Rabsilber TM, Reuland AJ, Holzer MP, Auffarth GU. Intraocular lens power calculation using ray tracing following excimer laser surgery. Eye. 2007;21:697–701.
9. Masket S, Masket SE. Simple regression formula for intraocular lens power adjustment in eyes requiring cataract surgery after excimer laser photoablation. J Cataract Refract Surg. 2006;32:430–4.
10. Borasio E, Stevens J, Smith GT. Estimation of true corneal power after keratorefractive surgery in eyes requiring cataract surgery: BESSt formula. J Cataract Refract Surg. 2006;32:2004–14.
11. Qazi MA, Cua IY, Roberts CJ, Pepose JS. Determining corneal power using Orbscan II videokeratography for intraocu-lar lens calculation after excimer laser surgery for myopia. J Cataract Refract Surg. 2007;33:21–30.
12. Randleman JB, Foster JB, Loupe DN, Song CD, Stulting RD. Intraocular lens power calculations after refractive sur-gery: consensus-K technique. J Cataract Refract Surg. 2007;33:1892–8.
13. Rosa N, De Bernardo M, Borrelli M, Filosa ML, Minutillo E, Lanza M. Reliability of the IOLMaster in measuring corneal power changes after hyperopic photorefractive keratectomy. J Refract Surg. 2011;27:293–8.
14. Rosa N, Capasso L, Lanza M, Borrelli M. Clinical results of a corneal radius correcting factor in calculating intraocular lens power after corneal refractive surgery. J Refract Surg. 2009;25:599–603.
15. Tang Q, Hoffer KJ, Olson MD, Miller KM. Accuracy of Scheimpflug Holladay equivalent keratometry readings after corneal refractive surgery. J Cataract Refract Surg. 2009;35:1198–203.
16. Rosa N, De Bernardo M, Borrelli M, Lanza M. New factor to improve reliability of the clinical history method for intraocular lens power calculation after refractive surgery. J Cataract Refract Surg. 2010;36:2123–8.
• fast, convenient online submission
•
thorough peer review by experienced researchers in your field
• rapid publication on acceptance
• support for research data, including large and complex data types
•
gold Open Access which fosters wider collaboration and increased citations maximum visibility for your research: over 100M website views per year
•
At BMC, research is always in progress.
Learn more biomedcentral.com/submissions
Ready to submit your research? Choose BMC and benefit from:
18. Kwitko S, Marinho DR, Rymer S, Severo N, Arce CG. Orbscan II and double-K method for IOL calculation after refrac-tive surgery. Graefes Arch Clin Exp Ophthalmol. 2012;250:1029–34.
19. Jin H, Auffarth GU, Guo H, Zhao P. Corneal power estimation for intraocular lens power calculation after corneal laser refractive surgery in Chinese eyes. J Cataract Refract Surg. 2012;38:1749–57.
20. De Bernardo M, Capasso L, Caliendo L, Paolercio F, Rosa N. IOL power calculation after corneal refractive surgery. Biomed Res Int. 2014;2014:658350.
21. Savini G, Barboni P, Zanini M. Intraocular lens power calculation after myopic refractive surgery: theoretical compari-son of different methods. Ophthalmology. 2006;113:1271–82.
22. Savini G, Hoffer KJ, Carbonelli M, Barboni P. Intraocular lens power calculation after myopic excimer laser surgery: clinical comparison of published methods. J Cataract Refract Surg. 2010;36:1455–65.
23. Yang R, Yeh A, George MR, Rahman M, Boerman H, Wang M. Comparison of intraocular lens power calculation methods after myopic laser refractive surgery without previous refractive surgery data. J Cataract Refract Surg. 2013;39:1327–35.
24. Alio JL, Abdelghany AA, Buenaga RF. Management of residual refractive error after cataract surgery. Curr Opin Oph-thalmol. 2014;25:291–7.
25. Behnding A, Montan P, Stenevi U, Kugelberg M, Zetterström C, Lundström M. Aiming for emmetropia after cataract surgery: Swedish National Cataract Register study. J Cataract Refract Surg. 2012;38:1181–6.
26. Rosa N, Capasso L, Lanza M, Furgiuele D, Romano A. Reliability of the IOLMaster in measuring corneal power changes after photorefractive keratectomy. J Cataract Refract Surg. 2004;30:409–13.
27. Olsen T. Improved accuracy of intraocular lens power calculation with Zeiss IOL Master. Acta Ophthalmol Scand. 2007;85:84–7.
28. Lopes BT, Roberts CJ, Elsheikh A, et al. Repeatability and reproducibility of intraocular pressure and dynamic corneal response parameters assessed by the corvis ST. J Ophthalmol. 2017;2017:8515742.
29. Koprowski R, Tian L, Olczyk P. A clinical utility assessment of the automatic measurement method of the quality of Meibomian glands. Biomed Eng Online. 2017;16:82.
30. Méndez-Aguilar EM, Kelly-Pérez I, Berriel-Valdos LR, Delgado-Atencio JA. Simulation and analysis of light scattering by multilamellar bodies present in the human eye. Biomed Opt Expr. 2017;8:3029–44.
31. Zoulinakis G, Ferrer-Blasco T. Intraocular telescopic system design: optical and visual simulation in a human eye model. J Ophthalmol. 2017;2017:6030793.
32. Clemente C, Esposito L, Speranza D, Bonora N. Firecracker eye exposure: experimental study and simulation. Bio-mech Model Mechanobiol. 2017;16:1401–11.
33. Koprowski R, Lanza M, Irregolare C. Corneal power evaluation after myopic corneal refractive surgery using artificial neural networks. Biomed Eng Online. 2016;15:121.
34. Koch DD. New options for IOL calculations after refractive surgery. J Cataract Refract Surg. 2006;32:371–2. 35. Khor WB, Afshari NA. The role of presbiopia-correcting intraocular lenses after in situ Keratomileusis. Curr Opin
Ophthalmol. 2013;24:35–40.