R E S E A R C H A R T I C L E
Open Access
Capsaicinoids supplementation decreases
percent body fat and fat mass: adjustment
using covariates in a post hoc analysis
James Rogers
1, Stacie L. Urbina
2, Lem W. Taylor
2, Colin D. Wilborn
2, Martin Purpura
3, Ralf Jäger
3and Vijaya Juturu
4*Abstract
Background:Capsaicinoids (CAPs) found in chili peppers and pepper extracts, are responsible for enhanced metabolism. The objective of the study was to evaluate the effects of CAPs on body fat and fat mass while considering interactions with body habitus, diet and metabolic propensity.
Methods:Seventy-five (N= 75) volunteer (male and female, age: 18 and 56 years) healthy subjects were recruited. This is a parallel group, randomized, double-blind, placebo controlled exploratory study. Subjects were randomly assigned to receive either placebo, 2 mg CAPs or 4 mg CAPs dosing for 12 weeks. After initial screening, subjects were evaluated with respect to fat mass and percent body fat at baseline and immediately following a 12-week treatment period. The current study evaluates two measures of fat loss while considering six baseline variables related to fat loss. Baseline measurements of importance in this paper are those used to evaluate body habitus, diet, and metabolic propensity. Lean mass and fat mass (body habitus); protein intake, fat intake and carbohydrate intake; and total serum cholesterol level (metabolic propensity) were assessed. Body fat and fat mass were respectively re-expressed as percent change in body fat and change in fat mass by application of formula outcome = (12-week value–baseline value) / baseline value) × 100. Thus, percent change in body fat and change in fat mass served as dependent variables in the evaluation of CAPs. Inferential statistical tests were derived from the model to compare low dose CAPs to placebo and high dose CAPs to placebo.
Results:Percent change in body fat after 12 weeks of treatment was 5.91 percentage units lower in CAPs 4 mg subjects than placebo subjects after adjustment for covariates (p= 0.0402). Percent change in fat mass after 12 weeks of treatment was 6.68 percentage units lower in Caps 4 mg subjects than placebo subjects after adjustment for covariates (p= 0.0487). Conclusion:These results suggest potential benefits of Capsaicinoids (CAPs) on body fat and fat mass in post hoc analysis. Further studies are required to explore pharmacological, physiological, and metabolic benefits of both chronic and acute Capsaicinoids consumption.
Trial registration:ISRCTN10458693‘retrospectively registered’.
Keywords:Capsicum, Capsaicinoids, Statistical modelling, Body fat, Fat mass
* Correspondence:[email protected]
Presented at The World Congress on Insulin Resistance, Diabetes & Cardiovascular Disease, Dec 1–3, 2016; Abstract published in ENDOCRINE PRACTICE 2017; 23 (1): 44.
4OmniActive Health Technologies Inc., 67 East Park Place, Suite 500,
Morristown, NJ 07950, USA
Full list of author information is available at the end of the article
Background
Since approximately 7500 BC, chili peppers belonging to the species Capsicum annuum have been a part of the human diet in South, Middle, and North America. The plants were domesticated between 5200 and 3400 BC in U.S. and used as a food preserving substance in Mexico [1]. In U.S. consumption of all peppers has increased, ris-ing from an average of 15.3 pounds per person in 2005 to 19.1 pounds per person in 2012 and consumption of bell peppers grew from 9.2 pounds to 11.7 pounds, while chili pepper consumption grew from 6.1 pounds to 7.4 pounds [2]. Red/Chili Peppers are widely cultivated in South America, Asia, Africa, and Mediterranean countries [3]. Pure Capsaicin measures 16,000,000 Scoville heat units (SHU). The spicy varieties of Capsicum are commonly called chili peppers, or simply“chilies”.
Capsicum (Capsicum annuumL. or Capsicum frutes-cens L.) and paprika (Capsicum annuumL.) are among the spices and other natural seasonings and flavorings that are generally recognized as safe (GRAS) for their intended use in food [4]. Capsicum and paprika are also listed among the essential oils, oleoresins (solvent-free), and natural extractives (including distillates) that are GRAS for their intended use in food [5,6]. Capsaicinoids are mainly ingested as naturally occurring pungency-producing components of capsicum spices (chili, cayenne pepper, red pepper). The bell pepper is the only member of theCapsicumgenus that does not produce capsaicin, a lipophilic chemical that can cause a strong burning sensa-tion when it comes in contact with mucous membranes. The lack of capsaicin in bell peppers is due to a recessive form of a gene that eliminates capsaicin and, conse-quently, the“hot”taste usually associated with the rest of theCapsicumgenus.
Parrish [7] reported that CAPs typically range from 0.10 mg/g in chili pepper to 2.50 mg/g in red pepper and 60 mg/g in red pepper oleoresin. In another study, Thomas et al. [8] reported that Capsicum varieties contain 0.22–20 mg total CAPs/g of dry weight. The amount of chili pepper used varies from country-to-country. For ex-ample, it was reported that the mean daily consumption of chili peppers in Mexico, Korea, Thailand, India and the United States are 15, 8, 5, 2.5, and 0.05–0.50 g/person/day, respectively [9]. Assuming that 1 g of chili contains 3 mg CAPs, the intake of CAPs in Mexico, Korea, Thailand, India and the United States will be approxi-mately 45, 24, 15, 7.5, and 0.15–1.5 mg/person/day, respectively. The 2012 data from US indicate chili pepper consumption to be 9 g/person (CAPs consumption will be approximately 27.00 mg/person/day).
Capsaicinoids (CAPs, Fig. 1) are the major pungent, naturally occurring active compounds in chilli peppers [10, 11]. The available information indicates that CAPs possess a wide variety of biological and physiological
activities, including neuropathic pain, inflammation, [12], reducing oxidative stress [13], antilithogenic effect, dia-betic neuropathy, psoriasis, cardio protective, arthritis, and cancer [14]. Whiting et al. [15] indicated that CAPs play a beneficial role, as part of a weight management pro-gram. Capsaicinoids may have potential benefits on weight loss, lipolysis and stimulates thermogenesis and energy burning by activating receptors. These receptors include white and brown fat cells. The weight loss benefits of cap-saicinoids are at the transient receptor potential cation channel subfamily V member 1, which is also known as vanilloid 1 or TRPV1. Whiting [15] met analysis showed that CAPs ingestion prior to a meal reduced ad libitum energy intake by 309.9 kJ (74.0 kcal) p< 0.001 during the meal. These results should be viewed as heterogeneity was high (I (2) =75.7%). Study findings suggest a minimum dose of 2 mg of CAPs may contribute to reductions in ad libitum energy intake. The molecular metabolic signaling mechanisms are by influencing metabolic rate, findings demonstrate CAPs appear to regulate hunger and satiety, blood metabolites, and catecholamine release [11,15].
Weight management strategies consist of therapeutic lifestyle changes including increased physical activity and reduced caloric intake; however, some of these cases fail and/or significant weight loss is maintained only in the short term because of lack of compliance and poten-tial weight recycling. Natural weight management ingre-dients aid weight reduction and compliance due to faster weight loss and increasing compliance. Weight management is known to be a complex function of gen-etic, metabolic, and behavioral components. It was theo-rized that in the absence of extremely large sample sizes, models taking these factors and the interactions between them into account would be needed to properly evaluate the impact of CAPs from Capsicum extract. Three back-ground factors were thought to be of prima facie merit, namely, baseline body habitus, baseline diet and baseline metabolic propensity. The causes of the obesity epidemic are undoubtedly multifactorial [16, 17]. Recent research suggest body composition variables by covariate factors revealed 35, 28 and 21% of percentage of body fat (PBF), fat mass index (FMI), and fat free mass index (FFMI), re-spectively [18] and weight gain [19]. Baseline covariates include food intake, physical activity, alterations in sleep patterns, and the stresses impact the outcome in many clinical trials. Conducting exploratory analyses including such variables when large baseline imbalances are ob-served might be helpful to assess the robustness of the primary analysis.
was felt that this exploratory study, without facilitation using such a model, might from the beginning be doomed to failure due to lack of statistical power. By modeling the data, a type II error (i.e., the false denial of a supportive treatment outcome) is lessened.
Methods
This is a parallel group, randomized, double-blind, pla-cebo controlled study conducted at University of Mary Hardin-Baylor, TX, USA. Subjects included 54 Caucasians (34 female/20 male), 13 Hispanics (8 female/5 male), 8 African American (4 female/4 male) and 2 Asians (1 female/1 male). Subjects were evaluated with respect to percent fat mass and body fat at baseline and immediately following a 12-week treatment period. Subjects were ran-domly assigned to receive either placebo (Corn starch,), 2 mg CAPs dosing [100 mg Capsimax providing 2 mg capsaicinoids] or 4 mg CAPs dosing (100 mg × 2 Capsi-max providing 4 mg capsaicinoids). Thus, this study employed a pretest– posttest design with three between
subject conditions created by random assignment. Baseline measurements were prior to dosing and therefore qualify as covariates free of conflation with treatment. All experimen-tal protocols were approved by the University of Mary Hardin-Baylor Institutional Review Board prior to initiation of research activities (ISRCTN registry #10458693).
Subjects
The subjects were recruited based on paper advertisements, via flyers, telephone (verbal guide), email, social media, and internet targeting research participants to determine their eligibility and interest. Subjects were recruited who exhib-ited the following study inclusion characteristics: 1) male or female volunteers ranging between 18 and 56 years of age; 2) healthy; 3) no ergogenic supplement ingestion in the last 6 months; 4) able to comply with required study ac-tivities; 5) expressing agreement to avoid strenuous activ-ity 24–48 h prior to study visits; 6) expressing agreement to avoid smoking, caffeine use and tobacco use for 12-h prior to study visits; 6) exhibiting a BMI between of
Nor Dihydrocapsaicin
24.5–29.5 kg/m2; and 7) able to provide a written and dated informed consent for study participation.
Subjects were excluded from the study on the basis of the following characteristics: 1) consumption of ergogenic levels of nutritional supplements that may affect muscle mass or aerobic capacity (e.g., creatine, HMB, etc) or anabolic/catabolic hormones (e.g., androstenedione, DHEA, etc.) within 6 months of study start; 2) presence of any absolute or relative contraindication regarding exercise test-ing or study prescription as outlined by the ACSM; 3) reporting of any unusual adverse events associated with the study that in consultation with the supervising physician would results in recommended study removal; 4) presence of strong history of food or drug allergy of any kind; 5) ingestion of any dietary supplement (excluding multi-vitamins) within 1 month of study start; 6) existence of any chronic disease and or condition(s) that the principal investigator believes may jeopardize the study; or 7) exist-ing pregnancy prior to or durexist-ing the study.
There were 28 placebo subjects, 27 subjects in CAPs 2 mg (low dose) treatment and 22 subjects in CAPs 4 mg (high dose) treatment group completed the study. Seventy five subjects completed the treatments. Inclu-sion and excluInclu-sion criteria were used to screen patients for study entrance but were not used for treatment as-signment which was random.
Variables
Multiple study parameters were collected over various time points during the study. These variables included a diet log, laboratory values, cardio-metabolic parameters, body composition and anthropometric measurements, adverse events, and QoL (quality of life) indices.
In this study, dietary supplementation of Capsicum for 12 weeks has shown to promote appetite suppression, which translated to reduced self-reported caloric intake after 12 weeks of supplementation. While Capsicum ad-ministration resulted in improved body circumferences in a main effects analysis, it did not apparently affect DEXA fat mass or fat-free mass in a statistically signifi-cant way [20]. The current study evaluates two measures of fat loss while considering six baseline variables related to fat loss. Baseline measurements of importance in this paper are those used to evaluate body habitus, diet and metabolic propensity. The following parameters at base-line were respectively used for these variable types: lean mass and fat mass (body habitus); protein intake, fat in-take and carbohydrate inin-take (diet); and total serum cholesterol level (metabolic propensity).
It was determined that in the statistical modeling for fat loss in this study, body habitus would be captured as baseline lean mass and baseline fat mass; diet would be captured in three variables, namely, baseline protein in-take, fat inin-take, and carbohydrate intake assessed through
food frequency questionnaires; and metabolic tendency would be capture as baseline total serum cholesterol level. The author reasoned that if fat loss could be modeled using these variables along with treatment assignment, the model predicted outcome of weight loss as a function of treatment, while controlling for these background factors, would afford an assessment of the impact of CAPs on fat loss. Without taking background factors into account, evaluation of CAPs would be carried out under subopti-mal conditions relative to the available sample size. This paper has both an empirical and a methodologic intent. Studies of economically feasible sizes with the goal of screening a panel of outcome variables for treatment sig-nals are important venues of discovery. These formative studies narrow future investigative windows and generate data based hypotheses. As such, they are an important contribution to the scientific literature. When such studies address complex outcome variables (which often are the variables of greatest interest) such as fat loss, too often they are analyzed with statistical models best suited for large summative trials (e.g., Phase III trials). This paper il-lustrates the utility of a model based approach to discov-ery in studies of a moderate size. The value of statistical modeling that accounts for important concomitant factors in fat loss is illustrated in this paper by evaluating fat loss using a simple analysis of variance model without covari-ates or interactions and a generalized linear model that in-cludes both of these features.
Investigational product
Capsicum extract is a Capsaicinoids enriched standard-ized product obtained from dried red fruits ofCapsicum annuum L. The Capsicum extract is standardized into bead lets form (Capsimax) with food grade carbohy-drates that is useful for food applications. Capsimax is a faint pinkish white colored free flowing uniform spher-oidal bead lets with spicy odor, characteristics of dried ripe fruits of Capsicum. The product contains a mini-mum of 2% Capsaicinoids. The product is standardized to 2% Capsaicinoids, of which 1.2–1.35% is Capsaicin, 0.6–0.8% is dihydrocapsaicin, and 0.1–0.2% is nor-dihydrocapsaicin. The final product contains 15–25% extract from capsicum, 45–55% sucrose and 30–35% cellulose gum coatings.
Body composition and blood chemistries
was assessed by sending samples to a commercial labora-tory (Quest Diagnostics, Irving, TX).
A power analysis was done on 25 subjects and 21 sub-jects per group yield a power of 0.85 and 0.81 in terms of body composition changes.
Statistical modeling
Prior to implementation of a statistical model to evaluate fat loss it was conceptualized that subject variation on three background dimension should be addressed during the evaluation process. These were baseline body hab-itus, baseline diet and baseline metabolic propensity. The objective was to parsimoniously capture these dimen-sions in as few variables as possible. Baseline lean mass and fat mass were used to capture body habitus; baseline carbo-hydrate intake, fat intake and protein intake were used to capture baseline diet; and baseline total cholesterol level was used to capture baseline metabolic propensity. Once selected, these baseline variables were used as independent variables in the statistical model used to evaluate fat loss. Percent body fat and fat mass were respectively re-expressed as percent change in body fat and change in fat mass by application of formula outcome = (12-week value – baseline value) / baseline value) × 100. Thus, percent change in body fat and fat mass served as dependent variables in the evaluation of CAPs.
After considering potential interactions among the base-line covariates and treatment, a comprehensive evaluation model was defined that expressed percent change in body fat (or fat mass) as a function of the baseline covariates noted previously, the treatment main effect and interac-tions between treatment and covariates. Interacinterac-tions were a key component of the model as these were thought to capture the complex interplay between background fac-tors and weight loss. We determined that the baseline var-iables and interactions could reasonably be expected to impact fat loss. Taking them into account during the evaluation of a nutraceutical designed to facilitate fat loss therefore seemed sensible.
In summary, two identical statistical models were used to respectively assess percent change in body fat and fat mass. Each model contained 1) the treatment effect (pla-cebo, low dose and high dose); 2) six baseline covariates (carbohydrate intake, fat intake, protein intake, fat mass, lean mass and total cholesterol value); and 3) the inter-action of each of the six covariates with treatment.
The above generalized linear model was used to estimate mean values and standard errors for percent change in body fat and fat mass. Inferential statistical tests were de-rived from the model to compare low dose CAPs to pla-cebo and high dose CAPs to plapla-cebo. Covariate adjustment was Type III (each effect adjusted for all others); the model was obtained using Restricted Maximum Likelihood Esti-mation; and the model solution was accomplished using
Newton-Raphson iterations [21–23]. Individual models were fit to percent change in percent body fat and to per-cent change in fat mass. Normal model convergence was observed. Missing values were accommodated in a manner that is typical for the generalized linear model. If a covariate value was missing at baseline, the subject was not evaluated in the model. No attempt was made to estimate the missing baseline value. As noted above, there were 77 total subjects in the study. Missing baseline values were concentrated in two subjects. Therefore, the net effect of missing baseline values was that 75 of the 77 total patients were avail-able to each of the two models used to evaluate fat loss. Twenty-six rather than 27 patients were available from the Capsimax 2 mg treatment; all 22 patients were available from the Capsimax 4 mg treatment; and 27 of the 28 patients were available from the placebo group. Otherwise, as is an advantage of the generalized linear model, any missing values in the dependent variable were accommodated by the variance-covariance matrix to obtain model predicted means (i.e., Least Squares (LS) Means) and associated standard errors.
Tables present basic comparisons between treatment groups for the baseline variables serving as covariates. Tables also show the predicted means and standard er-rors as well as the significance levels for each treatment vs. control contrast obtained from the generalized linear model used to adjust for background factors. Finally, a one-way Analysis of Variance model was used to evaluate three treatments “without” covariate adjustment. These results were used to provide a base of comparison that modeled the data without accounting for the background factors of known importance to fat loss that were in-cluded as covariates in the generalized linear model described above.
This paper provides a comparison between the results obtained when important background factors are and are not included in the modeling of outcome data that concern complex physiological response variables such as fat loss. To do this, adjustments for multiplicity of com-parisons must be avoided. Then, the unaltered p-values from the model with and the model without covariate ad-justment will be available for “direct” comparison. If the more comprehensive model has increased statistical power, the contrast p-value for the comprehensive model should be lower than for the model that eliminates covari-ates and their interactions with treatment.
Baseline variables
a history of resistance to fat loss. Descriptive statistics across the treatment groups are presented in Table 1. Additionally, analyses were conducted to compare the three treatment groups on all baseline variables simultan-eously (i.e., a multivariate analysis was conducted) as well as individually (i.e., a univariate analysis of variance was conducted on each baseline variable).
Results
Results for comparisons at baseline are first presented. Thereafter results for percent change in body fat and fat mass are presented.
Baseline characteristics and baseline covariates
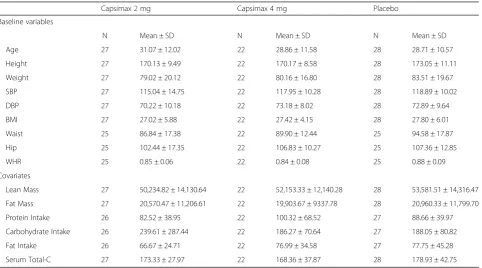
Table 1 presents descriptive statistics across the three treatment groups. The three groups are quite similar on baseline variable values as well as baseline covariate values. Both multivariate and univariate analyses carried out on baseline variables and baseline covariates resulted in unremarkable statistical significance levels (p> 0.05 in all instances).
Body fat anf fat mass
Percent change in percent body fat
To provide a baseline against which the modeled data analysis can be compared, Table2 presents the findings
of a both a one-way ANOVA without control for back-ground variables and the full generalized linear model that accommodates covariates and treatment by covariate interactions. Without consideration of baseline character-istics there is little difference between low dose CAPs 2 mg and placebo (difference = 0.20,p= 0.99) and no sig-nificant difference was observed. On the other hand, high dose CAPs 4 mg subjects evidence an improvement in percent change in percent body fat (−0.70) while the pla-cebo group exhibited a deterioration in percent change in percent body fat (2.70). However, the difference between these (−3.39) was not statistically significant.P-values re-spectively for the CAPs 2 mg vs. placebo contrast and the CAPs 4 mg vs. placebo contrast are p = 0.99 (extreme non- significance) andp= 0.20 (not significant).
The basic directional findings are very similar in the modeled data found in the Table2“With Baseline Covari-ates” analysis but the guiding p-values from the model suggest that the intuitive interpretation given above for the analysis lacking control for baseline factors meets the traditional 0.05 significance level for the high dose CAPS 4 mg vs. placebo contrast. Table2presents the model pre-dicted means and treatment vs. placebo contrasts. Due to the considerable reduction in the model generated stand-ard errors for the means (i.e., due to attribution of error variance to the covariates used as control variables) and
Table 1Descriptive statistics at baseline by treatment group
Capsimax 2 mg Capsimax 4 mg Placebo
Baseline variables
N Mean ± SD N Mean ± SD N Mean ± SD
Age 27 31.07 ± 12.02 22 28.86 ± 11.58 28 28.71 ± 10.57
Height 27 170.13 ± 9.49 22 170.17 ± 8.58 28 173.05 ± 11.11
Weight 27 79.02 ± 20.12 22 80.16 ± 16.80 28 83.51 ± 19.67
SBP 27 115.04 ± 14.75 22 117.95 ± 10.28 28 118.89 ± 10.02
DBP 27 70.22 ± 10.18 22 73.18 ± 8.02 28 72.89 ± 9.64
BMI 27 27.02 ± 5.88 22 27.42 ± 4.15 28 27.80 ± 6.01
Waist 25 86.84 ± 17.38 22 89.90 ± 12.44 25 94.58 ± 17.87
Hip 25 102.44 ± 17.35 22 106.83 ± 10.27 25 107.36 ± 12.85
WHR 25 0.85 ± 0.06 22 0.84 ± 0.08 25 0.88 ± 0.09
Covariates
Lean Mass 27 50,234.82 ± 14,130.64 22 52,153.33 ± 12,140.28 28 53,581.51 ± 14,316.47
Fat Mass 27 20,570.47 ± 11,206.61 22 19,903.67 ± 9337.78 28 20,960.33 ± 11,799.70
Protein Intake 26 82.52 ± 38.95 22 100.32 ± 68.52 27 88.66 ± 39.97
Carbohydrate Intake 26 239.61 ± 287.44 22 186.27 ± 70.64 27 188.05 ± 80.82
Fat Intake 26 66.67 ± 24.71 22 76.99 ± 34.58 27 77.75 ± 45.28
Serum Total-C 27 173.33 ± 27.97 22 168.36 ± 37.87 28 178.93 ± 42.75
Total-CTotal cholesterol;BMIBody mass index;SBPSystolic blood pressure;DBPDiastolic Blood Pressure;WHRWaist Hip Ratio
1) Main Effect Multivariate p (Wilks’Lambda) = 0.7073 for Baseline Variables. Univariate Main Effectp-values in all instances werep> 0.05 and ranged from
p= 0.3047 top= 0.8695. 2) Main Effect Multivariate p (Wilks’Lambda) = 0.0.8562 for Baseline Covariates. Univariate Main Effect p-values in all instances were
the modeled equalization of covariates at baseline, the sig-nificance levels are greatly improved (i.e., statistical power is improved). For example, the model adjusted difference between CAPs 4 mg and placebo is −5.91 percentage units (p= 0.0402). If the two analyses in Table2exhibited markedly different pattern of mean differences, one might doubt the validity of the model. In this case, the intuitive approach using basic unadjusted ANOVA and the gener-alized linear model approach that captures baseline factors of known a priori importance to fat loss, provide the same substantive message, albeit the latter with markedly im-proved statistical power and statistical significance for the high dose vs. placebo contrast.
Percent change in fat mass
As would be expected, the results for percent change in fat mass parallel those for percent change in percent body fat. Table 3 shows the presence of a favorable difference between high dose 4 mg CAPs and placebo of about 4 percentage points but this difference fails to
obtain statistical significance (difference =−4.07,p= 0.20). A small directional difference exists between low dose CAPs and placebo but this difference is distantly non-significant (−0.82,p= 0.79). When adjustment for covari-ates is carried out through the model, Table 3 reveals the same general pattern of outcome (little difference between low dose CAPs 2 mg and placebo but a substan-tial difference between CAPs 4 mg and placebo), but after adjustment for baseline factors, the high dose CAPs 4 mg vs. placebo contrasts is statistically significant (difference =−6.68,p= 0.05).
Discussion
The simpler analysis without adjustment for covariance points to the same substantive understanding of the im-pact of CAPs on fat loss as the results derived from the generalized linear model that adjusts for covariates. The difference is a substantial increase in statistical power using the model. If the results were distinctly different be-tween the basic analysis and those found after complex
Table 2Percent change in percent body fat compared between active and placebo groups using model generated means (LS Means)
Contrast Treatment N LS Mean (SE) LS Mean Difference (SE) PValue
Without Baseline Covariates
Capsimax 2 mg vs Placebo Capsimax 2 mg 27 2.68 (1.78) 0.20 0.9939
Placebo 28 2.70 (1.75)
Capsimax 4 mg vs Placebo Capsimax 4 mg 22 −0.70 (1.97) 3.39 0.2014
Placebo 28 2.70 (1.75)
With Baseline Covariates
Capsimax 2 mg vs Placebo Capsimax 2 mg 26 3.51 (2.09) −1.47 0.6030
Placebo 27 4.99 (2.28)
Capsimax 4 mg vs Placebo Capsimax 4 mg 22 −0.92 (2.06) −5.91 0.0402
Placebo 27 4.99 (2.28)
Analysis“Without Baseline Covariates”was a One-way ANOVA model. Analysis“With Baseline Covariates”was a generalized linear model containing treatment, variates and treatment x covariate interactions. Two subjects were lost to the“With Baseline Covariates”analysis due to missing values at baseline
Table 3Percent change in fat mass compared between active and placebo groups using model generated means (LS Means)
Contrast Treatment N LS Mean (SE) LS Mean Difference (SE) PValue
Without Baseline Covariates
Capsimax 2 mg vs Placebo Capsimax 2 mg 27 2.44 (2.14) −0.82 0.7860
Placebo 28 3.26 (2.10)
Capsimax 4 mg vs Placebo Capsimax 4 mg 22 −0.81 (2.37) −4.07 0.2037
Placebo 28 3.26 (2.10)
With Baseline Covariates
Capsimax 2 mg vs Placebo Capsimax 2 mg 26 3.45 (2.79) −2.43 0.5044
Placebo 27 5.88 (2.76)
Capsimax 4 mg vs Placebo Capsimax 4 mg 22 −0.80 (2.37) −6.68 0.0487
Placebo 27 5.88 (2.76)
adjustment, it would be necessary to carefully unravel the reasons for such a difference. A decision would need to be made concerning whether the model, in fact represented a plausible outcome or presented an artefactual finding. In this case, however, the same general finding is present by both methods of analysis, the difference being that adjust-ment for background factors has markedly increased stat-istical power. The reasonable conclusion is CAPs at the high dose reduces percent body fat and fat mass.
A second supportive feature of the analysis is the pres-ence of a dose response. However, in both analyses, there is a small directional finding favoring CAPs 2 mg over pla-cebo, but the difference fails to reach statistical signifi-cance, markedly so in the basic analysis with an improved level of significance in the adjusted analysis that neverthe-less is still clearly greater than the 0.05 benchmark. Over-all, however, the results are consistent and plausible. The worst outcome was evidenced by placebo.
Capsicum has been shown to help improve metabolism and hormone function [24], diabetes [25], and reduce in-sulin and leptin resistance [26]. Capsicum and CAPs have also been linked to cardiovascular health, endothelial function [27], LDL-cholesterol oxidation [28], stimulate energy expenditure [11, 29–31]. This thermogenic effect has been exploited for purposes of weight management. Capsaicinoids have been reported to reduce appetite [32–34], increase thermogenesis [25,35–38], and increase lipolysis [25, 35, 36, 39], or changes in serum glycerol and free fatty acids [10, 11]. The thermogenic effect of Capsaicinoids is mediated, at least in part, by a Capsaicinoid sensitive structure located in the rostral ventrolateral medulla [40]. Capsaicinoids treatment may also stimulate vasodilation [27], which may indirectly impact thermogenesis, as any resultant loss of heat may necessitate an increase in metabolism.
Ludy et al. [41] reported effects of red pepper on energy balance from a combination of metabolic and sensory in-puts. It was also suggested that individuals may become desensitized to red pepper. Capsaicin’s effect on appetite suppression, analgesia and lipolysis are mediated in part by expression of multiple genes involved in the lipid cata-bolic pathway, including those involved in thermogenesis [i.e., UCP2] and may be due to vanilloid receptor subtype 1 (VR1) binding capsaicin [42–45].
The following section explores potential biological pathways for the study findings on fat loss and influence of diet and body habitus. The methodological lesson from the current study is that in complex processes in-volving behavior, social and physiological components, such as fat loss, it is very important to control for at least some of the important subject background factors that might contribute to the directionality of the out-come parameter. In this instance, it was reasoned prior to final analysis that diet, body habitus and metabolic
tendency would be important considerations when asses-sing fat loss. The data base contained three variables dir-ectly related to diet (baseline protein, fat and carbohydrate intake), two factors directly related to baseline body hab-itus (lean mass and fat mass), and a single encompassing variable that at least in part should capture metabolic ten-dency, namely, total cholesterol. Upon controlling for these factors, the statistical power of the inferential testing procedure was greatly increased. It was shown that higher dose 4 mg CAPs positively influenced fat loss, and after adjustment for background factors of obvious importance to fat loss, a resulting favorable CAPs vs. placebo differ-ence existed with a probability of a type I error (i.e., a false positive conclusion) of less than 0.05.
In our first analysis for the study of CAPs effect on body composition, repeated measures without baseline covari-ate adjustments did not provided statistical significance for body fat and fat mass [46]. In the current analysis, baseline covariate adjustment resulted in statistical signifi-cance for body fat and fat mass in 4 mg CAPs treatment. This outcomefactsuggests that baseline covariate analysis should have been considered at the point of protocol development. However, that it was not in the current instance does not eliminate the importance of fitting an appropriate model after the fact, particularly in light of the known relationship of the covariates selected here to fat loss. Models leading to insight at any point are contribu-tory. A case might be made that it should be common practice in studies involving complex outcomes with sus-pected interactions with predisposing factors, that meth-odologies that anticipate the need for modeling be described a priori. For example, it is possible to include meaningful covariates in the data capture process at the beginning of a study and to outline methods of model development that will use those covariates, even if the pre-cise model ultimately used is not described in advance. The limitations of the study are the L-CAP and H-CAP groups were supplemented with 2 mg/d and 4 mg/d of capsaicinoids, and other studies have supplemented par-ticipants with much higher doses (i.e., 135 mg/d [6]). In addition, our participants were healthy and were mildly overweight but not obese. Thus, if capsaicinoid supple-mentation is indeed effective at improving body compos-ition, then more double blind clinical studies need to be performed in participants with greater BMIs.
terms of the specific ‘doses’ needed to reduction in ab-dominal body fat, energy intake and lipolysis.
Evidence suggests that the worldwide obesity epidemic is likely to continue its rise and several factors influence weight and risk of obesity [47]. Non-modifiable risk factors such as life style changes, healthy eating pat-terns, reducing caloric intake, and physical activity help to achieve long term weight loss. In the U.S. more than 20.60% women and 9.70% men are using weight loss dietary supplement at some point in their life and spend about $2 billion a year on weight loss dietary supplements in pill form (tablets, capsules, and soft gels). The use of multivitamin multi minerals decreased, and trends in use of individual supplements varied and were heterogeneous by population subgroups [48–50]. CAPs have shown ef-fects on appetite, WHR [45], energy expenditure [15] and lipolysis [10, 11]. Capsaicinoids ingestion prior to a meal reduced ad libitum energy intake by 309.9 kJ (74.0 kcal) p< 0.001 during a meal. In a recent meta- analysis, suggest that capsaicin or capsaicinoids or capsiate could be a new therapeutic approach in obesity promoting a negative energy balance and increased fat oxidation [51]. Capsaicin/Capsaicinoids induces apoptosis and inhibits adipogenesis in pre-adipocytes and adipocytes. Activation of the transient receptor potential vanilloid-1 channels may prevent adipogenesis and improves visceral fat re-modeling through the up-regulation of connexin [46] (Cx43) and regulates fat metabolism [52–57].
Conclusion
Overall, CAPs to be used as long-term, natural weight management aide. Further long-term placebo controlled randomized trials with high dose of CAPs are now needed to investigate these effects further.
Abbreviations
CAPs:Capsaicinoids; Cx43: Connexin; DEXA: Dual x-ray absorptiometry; FFMI: Fat free mass index; FMI: Fat mass index; LDL: Low-Density Lipoprotein; PBF: Percentage of body fat; QoL: Quality of life; SHU: Scoville heat units; TRP: Transient receptor potential; UCP: Uncoupling protein; VR1: Vanilloid receptor subtype 1
Acknowledgements
Authors are grateful to all volunteers for their participation in the study and thankful to all statisticians involved in statistical analysis for the study.
Funding
OmniActive Health Technologies Ltd., India.
Availability of data and materials
The dataset used for the current study can be obtained upon request from investigators.
Authors’contributions
JR prepared the data file for the statistical analyses, performed parts of the statistical analyses and drafted the manuscript. SU, CW and LT are responsible for the collection of the clinical data and prepared the data file for the statistical analyses. CW RJ and MP designed the main study, was responsible for the practical implementation, finalized the manuscript and is responsible for the integrity of the work. VJ involved as a scientist in study design, study initiation,
discussions, manuscript review, reviewed valuable comments from all authors and opinions on the manuscript and all authors reviewed and approved the last version.
Ethics approval and consent to participate
All experimental protocols were approved by the University of Mary Hardin-Baylor Institutional Review Board prior to initiation of research activities (ISRCTN registry #10458693). Informed consent written and signed by subjects was obtained from all participants.
Competing interests
All authors listed had no conflict of interest. VJ is an employee of Omni Health Technologies Inc., NJ. JR is a consulting statistician for Omni Health Technologies Inc., NJ.
Publisher’s Note
Springer Nature remains neutral with regard to jurisdictional claims in published maps and institutional affiliations.
Author details
1Summit Analytical, LLC, 8354 Northfield Blvd., Building G, Suite 3700, Denver,
CO 80238, USA.2Human Performance Laboratory, University of Mary Hardin-Baylor, Belton, TX 76513, USA.3Increnovo LLC, 2138 E Lafayette Pl,
Milwaukee, WI 53202, USA.4OmniActive Health Technologies Inc., 67 East Park Place, Suite 500, Morristown, NJ 07950, USA.
Received: 2 March 2017 Accepted: 9 May 2018
References
1. http://www.aboutcapsinoids.com/pages/history.htm. Retrieved on 02/07/ 2017.
2. https://www.apcorganics.com/our-products/peppers. Retrieved on 02/07/ 2017.
3. Silva LR, Azevedo J, Pereira MJ, Valentao P, Andrade PB. Chemical assessment and antioxidant capacity of pepper (Capsicum annuumL.) seeds. Food Chem Toxicol. 2013;53:240–8.
4. https://www.accessdata.fda.gov/scripts/cdrh/cfdocs/cfcfr/CFRSearch.cfm?fr= 182.10. Retrieved on 02/07/2017.
5. https://www.gpo.gov/fdsys/granule/CFR-2012-title21-vol3/CFR-2012-title21-vol3-sec182-20. Retrieved on 02/07/2017.
6. http://www.accessdata.fda.gov/scripts/cdrh/cfdocs/cfcfr/cfrsearch.cfm?fr=73. 340. Retrieved on 02/07/2017.
7. Parrish M. Liquid chromatographic method of determining capsaicinoids in capsicums and their extractives: collaborative study. J Assoc Off Anal Chem Intern. 1996;79(3):738–45.
8. Thomas BV, Schreiber AA, Weisskopf CP. Simple method for quantitation of capsaicinoids in peppers using capillary gas chromatography. J Agric Food Chem. 1998;46:2655–63.
9. Govindarajan VS, Sathyanarayana MN. Capsicum-production, technology, chemistry, and quality. Part V. Impact on physiology, pharmacology, nutrition, and metabolism; structure, pungency, pain, and desensitization sequences. Crit Rev Food Sci Nutr. 1991;29:435–74.
10. Bloomer RJ, Canale RE, Fisher-Wellman KH. The potential role of capsaicinoids in weight management. Agro Food Industry Hi-tech. 2009;20(4):60–2. 11. Bloomer RJ, Canale RE, Shastri S, Suvarnapathki S. Effect of oral intake of
capsaicinoid beadlets on catecholamine secretion and blood markers of lipolysis in healthy adults: a randomized, placebo controlled, double-blind, cross-over study. Lipids Health Dis. 2010;9:72.
12. Choi SE, Kim TH, Yi SA, Hwang YC, Hwang WS, Choe SJ, Han SJ, Kim HJ, Kim DJ, Kang Y, Lee KW. Capsaicin attenuates palmitate induced expression of macrophage inflammatory protein 1 and interleukin 8 by increasing palmitate oxidation and reducing c-Jun activation in THP-1 (human acute monocytic leukemia cell) cells. Nutr Res. 2011;31(6):468–78.
13. Henning SM, Zhang Y, Seeram NP, Lee RP, Wang P, Bowerman S. Antioxidant capacity and phytochemical content of herbs and spices in dry, fresh and blended herb paste form. Inter J Food Sci Nutr. 2011;62(3):219–25.
15. Whiting S, Derbyshir E, Tiwari BK. Capsaicinoids and capsinoids. A potential role for weight management? A systematic review of the evidence. Appetite. 2012;59:341–8.
16. Heinonen I, Helajärvi H, Pahkala K, Heinonen OJ, Hirvensalo M, Pälve K, Tammelin T, Yang X, Juonala M, Mikkilä V, Kähönen M, Lehtimäki T, Viikari J, Raitakari OT. Sedentary behaviours and obesity in adults: the Cardiovascular Risk in Young Finns Study. BMJ Open. 2013;3(6)
17. Deshmukh-Taskar PR, O'Neil CE, Nicklas TA, Yang SJ, Liu Y, Gustat J, Berenson GS. Dietary patterns associated with metabolic syndrome, sociodemographic and lifestyle factors in young adults: the Bogalusa heart study. Public Health Nutr. 2009;12(12):2493–503.
18. Ghosh A, Das Chaudhuri AB. Explaining body composition by some covariate factors among the elderly Bengalee Hindu women of Calcutta, India. J Nutr Health Aging. 2005;9(6):403–6.
19. Popkin BM. Global nutrition dynamics: the world is shifting rapidly toward a diet linked with noncommunicable diseases. Am J Clin Nutr. 2006;84(2):289–98. 20. Urbina SL, Villa KB, Santos E, Olivencia A, Bennett H, Lara M, Foster C, Taylor L,
Roberts M, Kephart W, Purpura M, Jaeger R, Wilborn C. Twelve weeks of capsaicinoid supplementation reduces appetite and self-reported caloric intake. Appetite: Submitted; 2016.
21. Sahai H, Ageel M. The Analysis of Variance: Fixed, Random and Mixed Models. Boston, Basel and Berlin: Birkhauser; 2000. p. 543–50.
22. Verbeke G, Molenberghs G. Linear Mixed Models for Longitudinal Data. New York: Springer-Verlag; 2000. p. 93–120.
23. NCSS 10 Statistical Software. Mixed Model–No Repeated Measures (). NCSS, LLC, Kaysville, Utah, USA, 2015; Chapter 221.ncss.com/software/ncss
24. Kang JH, Tsuyoshi G, Le Ngoc H, et al. Dietary capsaicin attenuates metabolic dysregulation in genetically obese diabetic mice. J Med Food. 2011;14:310–5. 25. Lejeune MP, Kovacs EM, Westerterp-Plantenga MS. Effect of capsaicin on
substrate oxidation and weight maintenance after modest bodyweight loss in human subjects. Br J Nutr. 2003;90:651–9.
26. Kang JH, Goto T, Han IS, Kawada T, Kim YM, Yu R. Dietary capsaicin reduces obesity-induced insulin resistance and hepatic steatosis in obese mice fed a high-fat diet. Obesity. 2010;18:780–7.
27. Chularojmontri L, Suwatronnakorn M, Wattanapitayakul SK. Influence of capsicum extract and capsaicin on endothelial health. J Med Assoc Thail. 2010;93:S92–101.
28. Ahuja KDK, Ball MJ. Effects of daily ingestion of chili on serum lipoprotein oxidation in adult men and women. Br J Nutr. 2006;96(2):239–42. 29. Kawada T, Watanabe T, Takaishi T, Tanaka T, Iwai K. Capsaicin-induced
beta-adrenergic action on energy metabolism in rats: influence of capsaicin on oxygen consumption, the respiratory quotient, and substrate utilization. Proc Soc Exp Biol Med. 1986;183:250–6.
30. Kawabata F, Inoue N, Yazawa S, Kawada T. Effects of Ch-19 sweet, a non-pungent cultivar of red pepper, in decreasing the body weight and suppressing body fat accumulation by sympathetic activation in humans. Biosci Biotechnol Biochem. 2006;70:2824–35.
31. Belza A, Frandsen E, Kondrup J. Body fat loss achieved by stimulation of thermogenesis by a combination of bioactive food ingredients: a placebo-controlled, double-blind 8-week intervention in obese subjects. Int J Obesity. 2007;31:121–30.
32. Yoshioka M, St-Pierre S, Drapeau V, et al. Effects of red pepper on appetite and energy intake. Br J Nutr. 1999;82:115–23.
33. Yoshioka M, Doucet E, Drapeau V, Dionne I, Tremblay A. Combined effects of red pepper and caffeine consumption on 24 h energy balance in subjects given free access to foods. Br J Nutr. 2001;85:203–11.
34. Westerterp-Plantenga MS, Smeets A, Lejeune MP. Sensory and gastrointestinal satiety effects of capsaicin on food intake. Int J Obes. 2005;29(6):682–8. 35. Yoshioka M, Lim K, Kikuzato S, et al. Effects of red-pepper diet on the
energy metabolism in men. J Nutr Sci Vitaminol (Tokyo). 1995;41:647–56. 36. Yoshioka M, St-Pierre S, Suzuki M, Tremblay A. Effects of red pepper added
to high-fat and high-carbohydrate meals on energy metabolism and substrate utilization in Japanese women. Br J Nutr. 1998;80:503–10. 37. Matsumoto T, Miyawaki C, Ue H, et al. Effects of capsaicin-containing yellow
curry sauce on sympathetic nervous system activity and diet-induced thermogenesis in lean and obese young women. J Nutr Sci Vitaminol (Tokyo). 2000;46:309–15.
38. Mahmmoud YA. Capsaicin stimulates uncoupled ATP hydrolysis by the sarcoplasmic reticulum calcium pump. J Biol Chem. 2008;283:21418–26. 39. Inoue N, Matsunaga Y, Satoh H, Takahashi M. Enhanced energy expenditure
and fat oxidation in humans with high BMI scores by the ingestion of novel
and non-pungent capsaicin analogues [capsinoids]. Biosci Biotechnol Biochem. 2007;71:380–9.
40. Osaka T, Lee T-H, Kobayashi A. Thermogenesis mediated by a capsaicin-sensitive area in the ventrolateral medulla. Neuroreport. 2000;11:2425–8. 41. Ludy MJ, Moore GE, Mattes RD. The effects of capsaicin and capsiate on energy balance: critical review and meta-analyses of studies in humans. Chem Senses. 2012;37:103–21.
42. Story GM, Crus-Orengo L. Feel the burn. Am Scientist. 2007;95:326–33. 43. Caterina MJ, Leffler A, Malmberg AB, et al. Impaired nociception and pain
sensation in mice lacking the capsaicin receptor. Science. 2000;288:306–13. 44. Szallasi A, Blumberg PM. Vanilloid (capsaicin) receptors and mechanisms.
Pharmacol Rev. 1999;51:159–212.
45. Lee MS, Kim CT, Kim IH, Kim Y. Effects of capsaicin on lipid catabolism in 3T3-L1 adipocytes. Phytother Res. 2011;25:935–9.
46. Urbina SL, Villa KB, Santos E, Olivencia A, Bennett H, Lara M, Foster C, Taylor L, Roberts M, Kephart W, Purpura M, Jaeger R and Wilborn C. Capsaicinoids Supplementation Reduces Appetite and Body Circumferences in Healthy Men and Women A Placebo Controlled Randomized Double Blind Study. FASEB J 2016, 30 (1) Supplement lb 356.
47. Lenz TL, Hamilton WR. Supplemental products used for weight loss. J Am Pharm Assoc. 2004;44:59–67.
48. Blanck HM, Serdula MK, Gillespie C, Galuska DA, Sharpe PA, Conway JM, Khan LK, Ainsworth BE. Use of nonprescription dietary supplements for weight loss is common among Americans. J Am Diet Assoc. 2007;107(3): 441–7.
49. Nutrition Business Journal. Is sports nutrition its own worst enemy?. NBJ. 2014, XI. http://www.newhope.com/news/sports-nutrition-its-own-worst-enemy.
50. Kantor ED, Rehm CD, Du M, White E, Giovannucci EL. Trends in Dietary Supplement Use Among US Adults From 1999-2012. JAMA. 2016;316(14): 1464–74.
51. Zsiborás C, Mátics R, Hegyi P, Balaskó M, Pétervári E, Szabó I, Sarlós P, Mikó A, Tenk J, Rostás I, Pécsi D, Garami A, Rumbus Z, Huszár O, Solymár M. Capsaicin and capsiate could be appropriate agents for treatment of obesity: a meta-analysis of human studies. Crit Rev Food Sci Nutr. 2018; 58(9):1419-27.
52. Zhang LJ, et al. Activation of transient receptor potential vanilloid type-1 channel prevents adipogenesis and obesity. Circ Res. 2007;100:1063–70. 53. Leung FW. Capsaicin as an anti-obesity drug. Prog Drug Res. 2014;68:171–9. 54. Chen J, Li L, Li Y, Liang X, Sun Q, Yu H, Zhong J, Ni Y, Chen J, Zhao Z, Gao
P, Wang B, Liu D, Zhu Z, Yan Z. Activation of TRPV1 channel by dietary capsaicin improves visceral fat remodeling through connexin43-mediated Ca2+ influx. Cardiovasc Diabetol. 2015;14:22.
55. Motter AL, Ahern GP. TRPV1-null mice are protected from diet-induced obesity. FEBS Lett. 2008;582(15):2257–62.
56. Szolcsányi J. Effect of capsaicin on thermoregulation: an update with new aspects. Temperature (Austin). 2015;2(2):277–96.