Dissertation
An
integrated
data
platform
for
gene
mining
and
biological
knowledge
discovery
Keywan
Hassani-Pak
Dissertation submitted to the faculty of technology at Bielefeld University to obtain the degreeofDoctorofScience(Dr.rer.nat.).
Title
KnetMiner-Anintegrateddataplatformfor geneminingand biologicalknowledgediscovery
Author
KeywanHassani-Pak RothamstedResearch AL52JQ,UK
Supervisors
Prof.Dr.RalfHofestädt, BielefeldUniversity,Germany Prof.Dr.ChristopherRawlings, RothamstedResearch,UK
Dates
Submitted:January2nd,2017
Doctoralexam:May4th,2017
Data isn't information. Information, unlike data, is useful. While there’s a gulf between data and information, there’s a wide ocean between information and knowledge. What turns the gears in our brains isn't information, but ideas, inventions, and inspiration. Knowledge - not
information - implies understanding. And beyond knowledge lies what we should be seeking: wisdom.
Abstract
Discovery of novel genes that control important phenotypes and diseases is one of the key challenges in biological sciences. Now, in the post-genomics era, scientists have access to a vast range of genomes, genotypes, phenotypes and ‘omics data which - when used systematically - can help to gain new insights and make faster discoveries. However, the volume and diversity of such un-integrated data is often seen as a burden that only those with specialist bioinformatics skills, but often only minimal specialist biological knowledge, can penetrate. Therefore, new tools are required to allow researchers to connect, explore and compare large-scale datasets to identify the genes and pathways that control important phenotypesanddiseasesinplants,animalsandhumans.
Acknowledgements
Thisworkwouldnothavebeenpossible withoutthesupport ofseveralpeople.
First, and foremost, I would like to thank my supervisor Prof. Chris Rawlings at Rothamsted Research for his support during the Ondex and KnetMiner projects, and for guiding me to be a creative and independent scientist. I would also like to show my greatest appreciation to Prof. Ralf Hofestädt at University of Bielefeld for giving me the opportunity to do an independent PhD (“freie promotion”) with him and examining my work. I’m very grateful to Prof. Achim Dobermann, Director of Rothamsted Research, for his warm encouragement to complete my PhD journey by granting me permission to take a sabbatical to write my dissertation.
I want to thank my colleagues Ajit Singh, Marco Brandizi, Martin Castellote, Maria Esch, Fengyuan Hu, Minja Zorc, Mike Phillips, Monika Mistry and Lisa Lill for their contributions to the KnetMiner project from 2011 to 2017. I enjoyed working with everyone of you on this exciting project. I’m also grateful to Jan Taubert, Matthew Hindle, Artem Lysenko, Catherine Canevet and all other Ondex team members, from 2008 to 2011, for the development of the Ondex software which provided the foundation of my work. I also appreciate the help of the Rothamsted Bioinformatics team for proofreading my thesis and providing valuable comments.
Contents
1INTRODUCTION 10
1.1Overview 11
2BACKGROUND 13
2.1Connectinggenotypetophenotype 13
2.2Geneticmethodsfordissectingcomplextraits 14 2.2.1QTLmapping(geneticlinkage) 15
2.2.2GWAS(geneticassociation) 16
2.3Genomicsandotheromicstechnologies 18 2.4Bioinformaticsapproachtogenediscovery 19
2.4.1LifeSciencedatabases 19
2.4.2Dataintegrationandbiologicalnetworks 25
2.5Relatedtools 26
3BUILDINGGENOME-SCALEKNOWLEDGENETWORKS 28
3.1Background 28
3.2Methods 31
3.2.1Ondexapproachtodataintegration 31 3.2.2Integrationofcropspecificdata 34 3.2.3Integrationofmodelspeciesdata 37
3.2.4Updatingknowledgenetworks 40
3.3Results 41
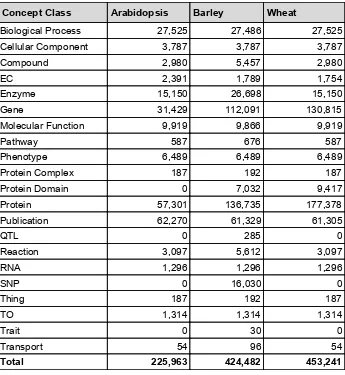
3.3.1ComparisonofGSKNs 41
3.3.2SearchandvisualisationofGSKNintheOndexfrontend 44 3.3.3ApplicationofGSKNtogenediscoveryandcropimprovement 46
3.4Discussion 47
4EXTENDINGONDEXWITHTEXTMININGCAPABILITIES 51
4.1Background 51
4.2Methods 54
4.2.1DocumentretrievalandindexinginOndex 54 4.2.2Mappingpublicationstoconceptsintheknowledgenetwork 55 4.2.3Usingco-occurrencetobuildweightedassociationnetworks 56
4.3Results 57
4.3.1Proof-of-conceptandevaluationofthetextminingapproach 57 4.3.1.1Mappingconceptstothecorpus 59 4.3.1.2Weightedassociationnetworks 60 4.3.1.3Validationofethylene-proteinassociations 62 4.3.2ExtendingOndexworkflowswithtextmining 64
5SEARCHINGKNOWLEDGENETWORKSANDRANKINGGENES 70
5.1Background 70
5.2Methods 71
5.2.1Gene-evidencenetworksandsemanticmotifs 71 5.2.2Extractinggene-evidencenetworksinwheat 75
5.2.3GeneRanking 77
5.2.3.1InverseGeneFrequency(IGF) 77 5.2.3.2EvidenceDocumentFrequency(EDF) 79 5.2.3.3Genescoringfunction(KNETscore) 79
5.3Results 80
5.3.1Characteristicsofgene-evidencenetworks 80 5.3.2Validationofgenescoringmethod 82
5.4Discussion 86
5.4.1Gene-evidencenetworks 86
5.4.2Genescoringmethod 87
6DESIGNANDIMPLEMENTATIONOFKNETMINER 90
6.1Background 90
6.2Objectives 91
6.3KnetMinerSystemOverview 92
6.4TheKnetMiner-Server 93
6.4.1Pre-processingtheknowledgenetwork 93
6.4.2Incomingrequesttypes 94
6.5KnetMinerClientSubsystem 96
6.5.1Userqueryinterface 96
6.5.1.1AGoogle-likesearchinterface 97
6.5.1.2Querysuggestions 99
6.5.1.3AddingQTLdatatothesearch 100 6.5.1.4Addinggeneliststothesearch 101 6.5.2Visualisationofsearchresults 101
6.5.2.1Mapview 102
6.5.2.2Geneview 104
6.5.2.3Evidenceview 105
6.5.2.4Networkview 106
6.6DevelopmentofnewKnetMinerInstances 110
6.6.1KnetMinerprojectmodel 110
6.6.2ConfigurationofKnetMinerclientandserver 111 6.6.3DeploymentofKnetMinerclientandserver 114
6.7Discussion 115
7APPLICATIONSOFKNETMINERINGENEDISCOVERYRESEARCH 118 7.1UsingKnetMinertointerpretatranscriptomicsstudyinwheat 118
7.1.2Choosingtherightsearchterms 122 7.1.3Generalfeaturesforexploringgenessuppliedbytheuser 124 7.1.4Candidategenediscoveryforgrain colourandpre-harvestsproutingtraits 126 7.1.5Exploringnovelcandidategenesunrelatedtoinitialsearchterms 129
7.1.6Summary 131
7.2UsingKnetMinertointerpretGWASandQTLstudiesinArabidopsis 132
7.2.1Introduction 132
7.2.2IdentifyingcandidategenesinGWASoutput 135 7.2.3IdentifyingcandidategenesinQTLmappingoutput 136
7.2.4Summary 140
List
of
Abbreviations
AHD ArabidopsisHormoneDatabase
AMPRIL Arabidopsismultiparentrecombinantinbredlines API Applicationprogramminginterfaces
CO CropOntology CPM Countspermillion
DEG Differentiallyexpressedgenes DOI DigitalObjectIdentifier
ECO EvidenceandConclusionOntology EDF EvidenceDocumentFrequency ES Evidencesentences
EVA EuropeanVariationArchive FC Foldchange
GAF GeneAssociationFormat GO GeneOntology
GSKN Genome-scaleknowledgenetwork GWAS Genome-wideassociationstudies IDF Inversedocumentfrequency IGF InverseGeneFrequency IP Innerproduct
IR Informationretrieval LD Linkagedisequilibrium
MAGIC MultiparentAdvancedGenerationInter-Cross MeSH MedicalSubjectHeadings
MGQE Metadata-basedGraphQueryEngine NER NamedEntityRecognition
1
INTRODUCTION
The development of improved agricultural crops is a critical societal challenge, given current global developments such as population growth, climate and environmental change, and the increasingly scarcity of inputs (fuel, fertilizer, etc.) needed for agricultural productivity. To meet this challenge, we will need to design improved crop varieties, with higher yields, robustness to biotic (e.g. pathogens, pests) and abiotic shock. Furthermore, there is a need to accelerate the breeding programmes needed to implement these designs. The use of forward genetics, reverse genetics and “omics” technologies to understand genotype-phenotyperelationshipswillbecritical toachievingthisgoal.
In the recent past, during the genomics era, scientists developed technologies to sequence and assemble the chromosomes of an organism and predict the gene content. Now, in the post-genomic era, next generation sequencing technologies have been developed and this has led to an explosion of more genomic data alongside a wealth of gene expression, protein expression, genetic and biological data, which are used by scientists to decipher the complex human, animal and plant systems and understand the molecular basis of phenotypes and disease conditions. The interpretation of such data has considerable potential as an adjunct to plant and animal breeding, however, it is not yet easy to interrogate these data and obtain clear, objective answers that can be applied in practice. For many scientists with expertise in biology, biochemistry or genetics, this “omics” data explosion is often seen as a challenge that only those with specialist bioinformatics or data analytics skills, but often only minimal specialist biological knowledge, can penetrate. Therefore, new high-quality tools for data integration and interpretation urgently need to be developed to allow researchers to connect, explore and compare the relevant large and small-scale datasets available for many species. Once we fully understand how biomedical or agronomic phenotypes are regulated and how diseases emerge, it should be possible to manipulate these processes and mechanisms and go on to devise new ways to improve crop and animal productivity and reduce disease levels and thereby improve human health andglobalfoodsecurity.
scientific justification. Data-driven systematic methods that search and filter the wealth of available data and evidence in order to objectively prioritize candidate genes based on validated algorithms will be of great value to life science researchers. Such methods and tools will save them valuable time and help to provide an evidence-based justification for whycertaingeneswereconsideredandothersnot.
The objective of this PhD project was to develop a tool that will allow researchers without specialist bioinformatics skills to explore and compare the wealth of existing open-access data from multiple species with their own experimental results in order to identify gene-trait relationships through the exploration of biological databases. An approach was taken that effectively connects heterogeneous information types, mines the information and then returns the results in an accessible, explorable, as well as scalable, format that can be easily manipulated, displayed and interrogated. The aim was to create a novel in silicoenvironment from which new scientific insights and biological discoveries can be made. The resulting software is called KnetMiner - Knowledge Network Miner. Knowledge networks or graphs provide a perfect data structure for heterogeneous, complex and interconnected biological information and consist of labelled nodes, such as a gene, pathway, trait, publication, that are connected through labelled edges, such as encodes, interacts, published-in. KnetMiner was developed in stages to address the three overarching challenges i.e. biological data integration, gene mining and knowledge discovery. The KnetMiner software and the knowledge resources are freely available and provide a first step towards systematic and evidence-based gene discovery in order to facilitate crop improvement. The chapters of this thesiswilldescribethedevelopment andapplicationofKnetMiner.
1.1
Overview
Chapter 3 gives an overview of the Ondex data integration and network generation platform. I present datasets, methods and workflows for the construction of genome-scale knowledge networks for several crop species including wheat, barley, potato, tomato, maize, poplar and Brassica.
Chapter 4 presents the development, implementation and validation of a text-mining plugin for the Ondex platform. This text-mining plugin was developed to extend the previously constructed knowledge networks with novel gene-phenotype relations derived from the scientificliterature.
Chapter 5 describes how the genome-scale knowledge networks can be mined for relevant pieces of evidence and proposes a new method for candidate gene prioritization based on biological knowledge mining. Proof-of-concept and validation of the methodology is presentedusingawheatdataset ofknowngibberellingenes.
Chapter 6 presents a new web application, named KnetMiner, making big data available to scientists and breeders through an easy-to-use, user-targeted application. The KnetMiner platform is applicable to all species but the prototypes presented here use data from crop and animal species. I give a technical overview of the development and implementation of theKnetMinerwebapplicationanddescribeitsconfigurationanddeployment.
Chapter 7 demonstrates KnetMiner with two different use cases based on the analysis of QTL/GWAS data in Arabidopsis and for the analysis of differentially expressed genes in wheat. The results highlight the power of KnetMiner to support scientists and breeders with biologicalknowledgediscoveryandcropimprovement.
2
BACKGROUND
2.1
Connecting
genotype
to
phenotype
In the past 50 years, science has tried to understand the relative importance and influence of genes and/or environment on shaping phenotypic traits (Polderman et al. 2015) . Many biomedical and agronomic traits are complex and their expression is determined by a number of both genes and environmental factors. Complex traits have no apparent simple Mendelian basis for their variation. They may be the result of a single gene strongly influenced by environmental factors or the result of a number of genes of equal or differing effect; most likely a combination of both multiple genes and environmental factors. Discovering those genes that determine a particular biological phenotype in crops, animals orhumansisreferredtoas thegenotypetophenotypechallenge.
Perfect examples of complex traits in humans are general intelligence (IQ) and height. Studies have shown that IQ and height are highly heritable and polygenic traits involving many genes with small effect sizes. Height is approximately 80-90% heritable and at least 40 loci have been associated with human height (Visscher 2008). Surprisingly, these loci explain only about 5% (of the expected 80%) of phenotypic variance and no gene (variant) has been discovered so far that contributes more than 0.5cm in height per gene despite studies of tens of thousands of people (Lango Allen et al. 2010) . The exact heritability of IQ is more controversial but is estimated to be about 40-50% (Davies et al. 2011) . The influence of the environment on the development of complex traits is more challenging to quantify. Meta-analysis studies in data collected from young children have shown that environmental factors such as iodine deficiency can result in reduction of 12.5 IQ points (Qian et al. 2005) . Beside genetic and environmental factors, studies have shown large IQ differences between monozygotic twins due to epigenetic effects (i.e. DNA methylation) which resulted in differences in gene expression (Yu et al. 2012). Epigenetics is therefore seen as an important regulatory link between nature and nurture and can provide the key to transform thegeneticinformationintophenotype(Tammen, Friso,andChoi2013).
rewires a phenotype. From these studies, and others like them, emerges a growing belief that searching for individual or small numbers of functional genes may not be the best approach and that a network biology approach is more appropriate for bridging the genotype to phenotype gap (Benfey and Mitchell-Olds 2008; Carter, Hofree, and Ideker 2013; Y.-A. Kim, Yoo-Ah, and Przytycka 2013). In particular, Kitano has argued (Kitano 2004) that some complex diseases (e.g. cancer) are difficult to treat because there are networks of genes and products which interact to increase the robustness of the system. Intervention at any single pointinthenetworkisthereforeunlikelytohaveamajoreffect.
Systematic genome-wide approaches and meta-analyses of all relevant studies are needed to determine how genetics, epigenetics, and environment interact to produce complex biomedical and agronomic traits. Identification of causal genes would facilitate the translation of research results into important clinical and commercial outcomes, including identifying new biomarkers for animal or human diseases that can lead to new diagnostics; and helping to select new varieties of crop or livestock animals with improved productivity or resistance to stresses such as disease. Searching for these causal genes in human, crop or animal genomes is, however, like searching for a needle in a haystack and gathering the evidence thatsupportsthechoiceofonegene overanotheris evenmoredaunting.
2.2
Genetic
methods
for
dissecting
complex
traits
Many comprehensive reviews are available describing forward genetics methods for correlating genotype and phenotype, for example see (Weigel 2012; Mauricio 2001) for reviews of methods used in plants or a comparison between two different genetic mapping strategies in soya bean (Sonah et al. 2015) . For a review of molecular marker technology in plant sciences see (Henry 2012). The focus of this chapter is not per se the description of forward genetics approaches but rather a review of their resolution and number of identified candidateloci.
2.2.1
QTL
mapping
(genetic
linkage)
Typically, QTL mapping is performed using segregating biparental populations. Commonly, low-density marker coverage on a few hundred members of the population (lines) is sufficient to identify many QTLs. For instance, a panel of 342 microsatellite markers were used to map QTL for carcass weight and other production traits in cattle (Zimin et al. 2009) . The multigenic nature of complex traits means that many QTL may be identified in a forward genetics screen. For example, a recent study in Brassica napus identified 47 QTLs which were relevant for seed yield (Shi et al. 2009) and a similar number of 50-60 QTLs were reported to control seed oil and protein content in soya bean (Eskandari, Cober, and Rajcan 2013a, [b] 2013). In the bioenergy crop Poplar five QTL hotspots for biomass yield were identified (Rae et al. 2009) and various QTL studies in pig have discovered more than 400 fatnessQTLs(Rothschild,Hu,andJiang2007).
To increase the recombination frequency of biparental mapping populations, experimental populations can be created from multiple parents such as MAGIC (for multiple advanced generation intercross) and AMPRIL (for Arabidopsis multiparent recombinant inbred lines) populations (Kover et al. 2009; Xueqing Huang et al. 2011) . The MAGIC population was recently used to investigate the genetic basis of variation in seed size and number (Gnan, Priest, and Kover 2014). The study identified 9 QTL for seed number and 8 for seed size. QTL mapping accuracy increases with the MAGIC population to within 300kb, or an equivalentof60genes.
These studies show that typical QTLs in both plants and animals generally encompass quite sizeable parts of the genome - typically several hundred genes. While QTL mapping improves the chances of finding the right gene (or genes), reducing the options down from 22,000 in cattle or 100,000 in wheat, to hundreds of genes for a particular QTL, it is still a daunting and expensive task to evaluate every potential candidate gene in the laboratory or inafieldexperiment.
2.2.2
GWAS
(genetic
association)
SNP receives a certain p-value from the statistical test. These associations then need to be evaluated to show whether they contribute to the trait of interest directly, or are linked/ in linkage disequilibrium (LD) to a QTL that contributes to the trait of interest. The negative logarithm of the p-values is often used to create so called Manhattan plots that visualise significant peak SNPs along the chromosomes (e.g. see Figure 1 in (Hui Li et al. 2012) ). SNPsaboveacertainthreshold(e.g.-log(P-value)>8)areoftenconsideredassignificant.
In contrast to simple traits, GWA studies of complex traits often identify many significant associations along the genome. Identifying causal genes (rather than causal SNP) from GWAS requires estimations of the LD in the association population. For example, LD estimates in the global Arabidopsis population are reported to extend over not more than about 5 to 10 kb, or one to two genes, which is very convenient for GWAS (S. Kim et al. 2007). This means for every significant SNP a region +/- LD can be considered as a QTL and all genes within this region can be considered potential candidate genes. Studies in soya bean have shown that for several simple Mendelian traits the SNP physically closest to the causal gene is not always the most highly associated, or peak SNP (Sonah et al. 2015) . For instance, the SNP closest to the causal gene for pubescence colour in soya bean showed the fourth greatest association. In all cases that were examined where the causal gene was known, it was found that the peak SNP was located within 100 kb of this gene and sometimes much closer, but in no case was the causal SNP captured in the gene itself. Similar findings have been reported with GWAS performed in other plant species such as Arabidopsis (Atwell et al. 2010) , rice (Xuehui Huang et al. 2010) and maize (Hui Li et al. 2012).
Furthermore, GWAS are prone to a high false-positive rate of genotype-phenotype associations due to effects of the population structure and the large number of statistical tests. Epistasis and other factors can additionally lead to false-negatives where loci with known effects are not detected by the statistical tests applied in GWAS. Therefore, individual studies that report statistically significant associations between genes and phenotypes need to be approached with great caution until they have been replicated in multiple large samples (Chabrisetal.2012).
elucidate the biological processes and pathways that they influence remains a major challenge.
2.3
Genomics
and
other
omics
technologies
Omics technologies provide the key to characterize and use genetic variation information efficiently. For example, high throughput genomic sequencing provides the means to characterize individuals and populations, to understand the genetic repertoire that they contain, to associate individuals, haplotypes and specific loci with desired characteristics and to track the transmission of parent material through successive genetic crosses. Other “omics” technologies – for example, for measuring gene expression, the presence/absence of metabolites, automatic imaging for morphological changes, etc. – can all used to quantify different aspects of response to growth and development of an organism, as well as, natural or experimental changes. They provide a toolbox to complement genetic studies by enhancing our knowledge and understanding of gene function and the translation of genotypetophenotype.
The transcriptional regulation of genes is influenced by genetic (e.g mutations, deletions, insertions, copy number variation etc.), epigenetic (e.g. methylation) and environmental factors (e.g. biotic or abiotic stresses). Changes in gene expression level consequently lead to changed concentrations of proteins in the cell that can impact biological pathways and other molecular interactions that ultimately more directly influence phenotype. High-throughput technologies such as Microarrays or RNA-sequencing make it possible to measure the abundance of the entire transcriptome (all expressed genes) of the cell. Experiments can be designed to study the effect of different treatments or environments on the same genotype or to compare gene expression in different genotypes. The aim of such studies is to identify those genes that show a statistically significant change in gene expressionlevelbetweencertainconditions.
genome and is generally captured as Gene Ontology (GO) terms (Ashburner et al. 2000) . This type of analysis is known as gene set enrichment analysis whereby a gene set is analysed for overrepresented functional annotations compared to a background set (e.g. the entire genome). Enrichment analyses are popular because they are simple to run and do not require a priori knowledge about the experiment. They can help with a global, initial data analysis. However, the precision of gene function annotation is a problem since too many times, the detail is missing in the ontology and so the function assignment is too general to be helpful. Therefore, gene enrichment results tend to reveal very high-level biological processesthatarenotnecessarilyhelpfulingeneratingprecisehypothesis.
Analysis of QTL genes differs from the analysis of DEG. The aim of QTL analysis is to identify the causal loci or alleles that control the variation in the phenotype. The majority of genes between two significant markers in a QTL analysis may be unrelated to the phenotype and only one or a few will be causal. In contrast all DEG in omics experiments are “somehow” related to the phenotype of interest, and therefore, the DEGs needs to studied as a whole. The combination of QTLs and DEG provides key inputs to generate precise hypothesesaboutthebiologicalprocessesand networkslinkinggenotypetophenotypes.
2.4
Bioinformatics
approach
to
gene
discovery
2.4.1
Life
Science
databases
Currently, over 1500 different Life Science databases are available and documented with publications in Nucleic Acid Research Databases (Galperin, Rigden, and Fernández-Suárez 2015). The majority of them are open access and contain structured and unstructured data such as sequences, gene expression, protein interaction, quantitative traits, ontologies, literature or pathways. Bioinformatics approaches that systematically integrate and mine the wealth of biological knowledge available in myriad of databases provide another route to gene discovery. The key information types and databases for in silico gene discovery in plantsareelaboratedbelow.
Ontologies
often with associated synonyms, definitions, etc., and a set of semantic relationships between terms. These relationships support greater interoperability through the extension of existing ontologies, the ability to combine annotations that have been applied at different levels of specificity (based on relevance to the current question and/or availability of data), and the ability to reason over a data set and extract implicit knowledge that hides between the annotation and the semantics. Ontologies are needed both to formally define the semantics for the primary data under consideration, but also to define the metadata - the information that describes the data provenance, the measurement method and scale used - so that the data can be correctly interpreted and the definition of the gene function or trait remains consistent across interdisciplinary data resources. The use of ontologies also supports, through the use of synonyms, the mapping of annotated terms between different natural languages. One of the most comprehensive and best used ontologies in Life Sciences is the Gene Ontology (The Gene Ontology Consortium 2014) comprising over 43,000 terms and over 6.5 Million gene annotations that use these ontology terms (01/09/2016).
Genotypeandgeneticsdata
databases are often only available in cM based on genetic maps of the specific mapping populationbecausethegenomesequences arenotyetavailable.
Genetic variants that do not have reported links to phenotypes might initially be considered less important to gene discovery. However, knowledge about published genetic variants and their effect on protein level can inform candidate gene prioritization since variants of genes with major effects can be given higher weight than genes with no reported variants or minor variant effects. The European Variation Archive (EVA) provides access to all types of genetic variants, ranging from single nucleotide polymorphisms to large structural variants from any eukaryotic organism. EVA uses the Variant Effect Predictor (Yourshaw et al. 2015) of Ensembl to annotate variant consequences. The variant consequences are described using SequenceOntologyterms.
Reverse genetics approaches are based on disrupting genes of known sequence and studying the effect of the disruption on the phenome (Gilchrist and Haughn 2010). Reverse genetics resources consist of plant material (i.e. seeds) with a certain knockout gene that can be grown and used for functional characterisation of the disrupted gene. For several plant species, e.g. Arabidopsis, rice and wheat, reverse genetics resources have been generated that allow scientists to study the function of many genes more effectively (Kleinboelting et al. 2012; Chen et al. 2012; An et al. 2005) . The data from such resources is often available in custom tabular formats and could be used in gene prioritization tasks to rankgeneshigherforwhichgeneknockoutswithassociatedphenotypedataexist.
Phenotypedata
(e.g. cell wall polysaccharide composition) and over widely varying temporal scales, from seconds(e.g.photosyntheticresponse)tomonths(e.gwholeseasonbiomass).
Phenotype data itself (without being associated to genotype) is important in upstream processes involved in trait discovery and QTL mapping but less to gene discovery per se. Once phenotype data can be related to genotype, gene or mutants then it becomes a relationship of high importance. Reported gene-phenotype knowledge is one of the most valuable pieces of evidence in candidate gene prioritization. Such information is dispersed in many heterogeneous formats and locations. The public database UniProt contains a subsection ‘disruption phenotype’ that describes the in vivo effects caused by knockout or knockdown of a gene (“UniProt Website” n.d.). The Arabidopsis Information Resource (TAIR) provides phenotypic information for a range of genotypes with mutations in individual genes (“TAIR Website” n.d.). NCBI has the GeneRIF database (“Gene RIF Website” n.d.) that contains concise phrases describing a gene function that is sometimes used to add phenotypic descriptions. The majority of phenotypic information is, however, available in an unstructured form in the scientific literature and is therefore difficult to integrate with other knowledge resources such as ontologies. Text-mining techniques are required to extract and integratesuchinformationeffectively (seeChapter4).
Due to the heterogeneous nature of phenotype data, a variety of ontologies have been developed for phenotypic data and experimental metadata, of which many are species-specific. For example, available ontologies for plants and crops include the Plant Ontology, the Crop Ontology, the Plant Trait Ontology and the Environment Ontology. The utility of such ontologies to annotate plant genomes are still limited. Even in model species such as Arabidopsis, most phenotypic descriptions are in free text which makes automated reasoning over such data very difficult. On the other hand, in other species such as Drosophila, the phenotype ontology is systematically used to annotate genes and alleles enablingmorepowerfulsearchqueries(Osumi-Sutherlandetal.2013).
Geneexpressiondata
expression databases exist such as the Gene Expression Atlas (Petryszak et al. 2014) or the Gene Expression Omnibus (Edgar 2002). Reference-species resources such as TAIR have annotated Arabidopsis genes with Plant Ontology (Monaco et al. 2014) terms that describe in which tissues and during which developmental stages a gene is expressed. Other databases such as ATTED-II (Obayashi et al. 2009) analyse large amounts of expression datasets to compute clusters of coexpressed genes. Such co-expression data provides weak, speculative evidence that these genes are co-regulated and therefore could share a similarbiologicalfunctionoracttogethertocontrolaphenotype.
Interactiondata
Protein-protein interaction (PPI) data provides very useful knowledge for candidate gene discovery. In contrast to co-expression data, PPI data provides evidence about the physical interaction of proteins in the cell. A large number of methods have been developed over the years to study protein-protein interactions, e.g. affinity-tagged proteins, the two-hybrid system and some quantitative proteomic techniques(Berggård et al. 2007) . Interaction most likely means that the proteins are involved in the same biological process and higher level traits although they might have different functions. Public PPI databases can be searched to identify previously reported interactions for a given bait protein. BioGRID (Chatr-aryamontri et al. 2014) and IntAct (Orchard et al. 2014) databases are populated by data either
curated from the literature or from direct data depositions . Data access and download are provided for many species and in different data formats such as PSIMI-XML, PSIMI-TAB, BioPAX or RDF. Other PPI databases such as STRING (Szklarczyk et al. 2010) provide integratedandcomputationallyinferredinteractiondata.
Functionalannotationdata
of experimental evidence (“GO Statistics” n.d.). The majority of annotations in non-model species are electronically inferred through sequence based comparisons with model species. The common data type for functional gene annotations is the Gene Association Format (GAF). Many functional or structural bioinformatics databases provide mappings to GO terms e.g. EC2GO, Pfam2GO and InterPro2GO. Biological pathways provide a more fine-grained knowledge about the enzymes, chemical reactions and small molecules that form the elements of biosynthetic pathways. Popular pathway databases such as KEGG (Ogata et al. 1999) , Reactome(Fabregat et al. 2016) and BioCyc (Caspi et al. 2013) provide curated pathway information for model species and computationally inferred pathways for non-model species. A common file format for pathway data is the Biological Pathway Exchange(BioPAX)format.
Orthologydata
The function of the vast majority of genes in non-model species remains uncharacterised. Any effort to prioritize candidate genes without any evidence about their function is difficult or even impossible. Genes that have been well characterised in other species provide a reliable source of putative evidence assuming this knowledge can be transferred from one species to another. The principal idea supporting cross-species annotation transfer is that the function of proteins is, to some extent, conserved through evolution. Thus, two orthologs in two closely related species are likely to share the same function. But the level of conservation of protein function across species largely depends on the evolution of these species, including the evolution of their proteins, of their biochemical pathways and of their higher level biological traits. Orthologous relationships can be established when comparing the genomes of two or more species. Identification of orthologous gene sets typically involves phylogenetic tree analysis, heuristic algorithms based on sequence conservation, synteny analysis, or some combination of these approaches (Trachana et al. 2014; Kristensen et al. 2011). Some of the prominent databases of orthologous genes include Ensembl (Herrero et al. 2016), OrthoDB (Kriventseva et al. 2015) OMA (Altenhoff et al. 2015) and Phytozome (Goodstein et al. 2011). The common data standard for orthology data provision is OrthoXML(Schmittetal.2011).
such as Blast2GO (Gotz et al. 2008) . Such data can be used for exploratory analysis but is prone to a high false positive rate. In the context of prioritizing genes it should be given a muchlowerweightthanmore accurateorthologyinferencemethods.
2.4.2
Data
integration
and
biological
networks
The assembly of such diverse information is a technically challenging task for biologists and bioinformatician who also find it hard to evaluate the different sources of evidence and select from them the most plausible functional candidate genes. Even when this functional information gathering task is complete, assembling a coherent view of how the bits of evidence might come together to “tell a story” about the biology that could explain how multiple genes from QTLs or DEGs might be implicated in a complex trait is challenging. Bioinformatics approaches and public data resources can help to bridge the genotype to phenotype gap and prioritise candidate genes (Willet and Wade 2014). Using such in silico
approaches, scientists can integrate multiple heterogeneous types of information and providemeanstointerrogatetheinformationin amoresystematic andinformedway.
As described above, the types of biological information that are useful for gene discovery and candidate gene prioritization can include known gene-phenotype links, gene-disease associations, gene expression and co-expression, allelic information and effects of genetic variation, links to scientific literature, homology relations, protein-protein interactions, gene regulation, protein pathway memberships, gene-ontology annotations, protein-domain information and other domain specific information. Such data is typically highly connected, e.g. through common references to named biological entities, and semi-structured, e.g. because some data can be found in databases and other in free text. Furthermore, these data types are not static because new types of data are constantly emerging from advances in high-throughput experimental platforms. These characteristics of Life Science data make networks, consisting of nodes and links between them, represent a flexible data model that can capture some of the complexity and interconnectedness in the data (Huber et al. 2007) . In addition, networks are often considered as the layer that connects genotype to phenotype (Carter,Hofree,andIdeker2013).
lab to greenhouse to field is a slow process that can last several years. Following a wrong lead would waste significant effort, time and money. Therefore, it is important that only candidate genes with the highest level of evidence are considered for experimental validation. One of the key challenges is therefore to prioritise candidate genes and components of interaction networks that, if perturbed through potential interventions, have a positive impact on the biological outcome in the whole organism without producing negative sideeffects.
2.5
Related
tools
Data integration is recognised as a challenge of general importance in the Life Sciences, a number of biological data warehouse solutions have been constructed to facilitate data integration and information retrieval from diverse biological data, e.g. InterMine(R. N. Smith et al. 2012), BioMart (Yates et al. 2016) , LAILAPS (Esch et al. 2015) and Ondex (Köhler et al. 2006). The majority of biological data warehouse solutions use relational databases to store information and only a few systems such as Ondex use networks as their internal data structure.
One of the most popular tools for network visualisation in Life Sciences is Cytoscape (P. Shannonetal.2003).
3
BUILDING
GENOME-SCALE
KNOWLEDGE
NETWORKS
Life Sciences data are dispersed in various databases and heterogeneous data formats which makes a systematic interrogation of the data technically challenging. Genome-scale knowledge networks (GSKN) provide a centralised and unified representation of heterogeneous but interconnected datasets that can enable more effective knowledge mining. This chapter introduces the Ondex software and presents data sets and methods for building knowledge networks for major crops such as wheat and barley. The results section describes global characteristics of GSKNs and illustrates on one example the value of Linked Data. The principles of this work are generic and can be extended with more datasets or to other species. Some parts of this chapter have been published in (Hassani-Pak et al. 2016).
3.1
Background
The discovery of the hypotheses linking genotype to phenotype and identification of the candidate genes increasingly involves the integration of multiple heterogeneous types of information. This information is spread across many different databases (Rigden, Fernández-Suárez, and Galperin 2016) that can include known gene-phenotype or gene-disease associations, gene expression and co-expression, allelic information and effects of genetic variation, links to scientific literature, homology relations, protein-protein interactions, gene regulation, protein pathway memberships, gene-ontology annotations, protein-domain information and other domain specific information. Such data is typically highly connected, semi-structured and the data types are not static as new types of data are constantlyemergingfromadvancesinhigh-throughputexperimentalplatforms.
These characteristics make networks, consisting of nodes and links between them, a natural data structure for the representation complex and interconnected biological data. Compared to relational databases, networks provide better query performance on highly connected data (many join statements are slow). In addition, networks provide more flexibility to model the data as data is not forced into a structure like a relational table, and attributes can be added and removed easily. This is especially useful for semi-structured data where a representationinrelationaldatabasewouldresultinlotsofNULLcolumnvalues.
Han 2012). Biological knowledge networks are composed of nodes which represent biological entities such as genes, transcripts, proteins and compounds, as well as, other entities such as protein domains, ontology terms, pathways, literature and phenotypes. The links in the network correspond to relations between entities and are described using terms which reflect the semantics of the biological or functional relationship such as encodes,
interacts, controls, expressed, part_of, is_a, published_in etc. A knowledge network is referred to as genome-scale knowledge network (GSKN) when it contains the entire known genome (all genes) of an organism as nodes in the network. A centralised GSKN that is build from dispersed, heterogeneous data can significantly facilitate both computer-aided dataminingandmanualdataexploration.
There are different ways of representing information in knowledge networks. Information such as gene position can be added as an attribute of the Gene node. However, when the nature of the information is more complex, it should be represented as linked data. Linked nodes are connected through relations of well defined types. These triples can then be exploited for analysis in a more systematic way. For example, SNP information could either be represented in a compact manner as a series of attributes on a Gene node or in an expanded way by using separate SNP nodes and creating links of type has_a to create triples. The latter approach provides more power for reasoning and allows linking specific SNPstotraits,forexample,basedonthe resultsofagenomewideassociationstudy.
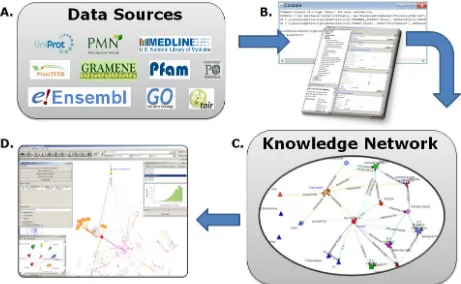
methods), remove unwanted information (filters) and simplify the network structure (transformers). Workflows can be generated and executed either via a graphical user interface (Ondex Integrator) or via the command line interface (Ondex CLI). The Ondex Scripting Console provides a means to parse custom TAB data types for integration into Ondex where no dedicated Ondex parsers are yet available. The scripting syntax is based onadomainspecificlanguage developedinLysenko2012.
Figure 3.1. Public data sources that can be integrated into Ondex (A) using the Ondex Integrator and the Ondex Console (B). Following the data integration workflow, the
integrated knowledge network (C) is loaded into the Ondex frontend for visualisation and exploration(D).