M E T H O D O L O G Y
Open Access
A fast and robust protocol for
metataxonomic analysis using RNAseq data
Jeremy W. Cox
1,2, Richard A. Ballweg
2, Diana H. Taft
2, Prakash Velayutham
3, David B. Haslam
4and Aleksey Porollo
2,3*Abstract
Background:Metagenomics is a rapidly emerging field aimed to analyze microbial diversity and dynamics by
studying the genomic content of the microbiota. Metataxonomics tools analyze high-throughput sequencing data, primarily from 16S rRNA gene sequencing and DNAseq, to identify microorganisms and viruses within a complex mixture. With the growing demand for analysis of the functional microbiome, metatranscriptome studies attract more interest. To make metatranscriptomic data sufficient for metataxonomics, new analytical workflows are needed to deal with sparse and taxonomically less informative sequencing data.
Results:We present a new protocol, IMSA+A, for accurate taxonomy classification based on metatranscriptome
data of any read length that can efficiently and robustly identify bacteria, fungi, and viruses in the same sample. The new protocol improves accuracy by using a conservative reference database, employing a new counting scheme, and by assembling shotgun reads. Assembly also reduces analysis runtime. Simulated data were utilized to evaluate the protocol by permuting common experimental variables. When applied to the real metatranscriptome data for mouse intestines colonized by ASF, the protocol showed superior performance in detection of the microorganisms compared to the existing metataxonomics tools. IMSA+A is available at https://github.com/ JeremyCoxBMI/IMSA-A.
Conclusions:The developed protocol addresses the need for taxonomy classification from RNAseq data.
Previously not utilized, i.e., unmapped to a reference genome, RNAseq reads can now be used to gather taxonomic information about the microbiota present in a biological sample without conducting additional sequencing. Any metatranscriptome pipeline that includes assembly of reads can add this analysis with minimal additional cost of compute time. The new protocol also creates an opportunity to revisit old metatranscriptome data, where taxonomic content may be important but was not analyzed.
Keywords: Microbiome, Metagenome, Metatranscriptome, Metataxonomics, RNAseq, Assembly of shotgun
reads, Altered Schaedler flora
Background
Most naturally occurring higher organisms host micro-biota. The importance of a microbiome in human health is recognized by the National Institutes of Health (NIH) via support of the Human Microbiome Project in 2007 (https://commonfund.nih.gov/hmp/), which resulted in
>500 peer-reviewed publications by the project partici-pants as of February 2016. Metagenomics is a rapidly emerging field aimed to analyze microbial diversity and dynamics by studying the microbiome (genomic content of the microbiota). Advantages in high-throughput deep sequencing enabled focused studies of microbiomes in different organisms and environmental niches. Meta-taxonomics tools analyze sequencing data to identify microorganisms and viruses from complex mixtures. These tools can be divided into two primary categories based on the data they process for identifying micro-organisms: short marker sequencing (e.g., 16S and 18S/ITS rRNA genes for bacteria and fungi, respectively) and * Correspondence:[email protected]
2The Center for Autoimmune Genomics and Etiology, Cincinnati Children’s
Hospital Medical Center, 3333 Burnet Avenue, MLC 15012, Cincinnati, OH 45229-3039, USA
3Division of Biomedical Informatics, Cincinnati Children’s Hospital Medical
Center, 3333 Burnet Avenue, Cincinnati, OH 45229, USA Full list of author information is available at the end of the article
shotgun DNA sequencing (DNAseq). However, identifica-tion of microorganisms and understanding of their role in the host health and pathogenesis pose challenges to the bioinformatics community. The major challenges for meta-taxonomics are (1) processing a large volume of sequence data efficiently, (2) dealing with ambiguous information, when the same sequence matches to multiple species, and (3) classifying with resolution below the genus clade. For example, in the DNAseq analysis, sequences may align to multiple taxa, possibly in different clades [1–3]. In 16S metagenomic analysis, a sequence is mapped to an oper-ational taxonomical unit (OTU), which represents a cluster of organisms rather than a specific organism [4].
A fundamental step in taxonomy classification is to count taxa based on the shotgun read alignments to the metagenome. Metataxonomics tools employ various strategies to produce better counts. IMSA [5] and PathSeq [6] count the number of significant sequence alignments at various levels, to species, genus, and family. Clinical Pathoscope [7, 8] and MetaGeniE [9] follow the same approach, but add an error-correcting schema. MEGAN only counts a read if the all align-ments for the read unanimously agree on the taxon. Following the Lowest common ancestor (LCA) concept, MEGAN assigns the read to the lowest taxonomic category, where there is an agreement [2, 10]. MEGAN CE [11] recommends DIAMOND [12], a high-throughput algorithm that aligns shotgun reads to protein sequences. Kraken [3] determines LCA by looking up all subsequence
k-mers in a prebuilt classification table. MetaPhlAn2 ig-nores the sequences that do not match to the precom-puted list of genes—taxonomic markers [13, 14].
Metataxonomics programs typically have several re-strictions on the data they are designed to work with. Tools with a medical inclination frequently narrow their search by the implicit assumption that there is a single microorganism causing disease (PathSeq [6], Clinical Pathoscope [7, 8], RINS [15], SURPI [16]). Such tools are less effective when studying diverse microbial communities. Moreover, a majority of published meta-taxonomics frameworks are tested with bacteria and/ or viruses (e.g., GOTTCHA [17], VirusFinder [18], VirusSeq [19]), excluding other microorganisms like protists, algae, and fungi. Limiting the taxonomy identification to one kingdom may lead to an incom-plete understanding of the studied microbiome, its interactions, and functional landscape. Moreover, the appreciation of fungal microbiome is rising [20]. Indeed, in a recent study of the oral human myco-biome, 60 nonpathogenic fungal genera were identified that are considered to be environmental in nature [21]. Typically, 100 bases or longer reads are used for testing metataxonomics tools [3, 6, 17, 22, 23], thus making their applicability to shorter reads uncertain. Lastly, though
detection of microbial DNA likely translates to the presence of microorganisms, it cannot inform about the viability and functional states (e.g., metabolism) of these populations. The reader may refer to Additional file 1
“Survey of Metataxonomic Tools” for further details on existing tools.
Ribosomal depleted shotgun RNA sequencing (RNAseq) is a high-throughput sequencing tech-nique that enables the analysis of transcriptomic landscapes of the microbiome [24–27]. The RNAseq reads assembly improves metatranscriptome func-tional annotation [28]. There is an opportunity to use existing RNAseq data for metataxonomics. If possible, using the same RNAseq data for both metatranscriptome functional analysis and taxonomy classification would be an efficient alternative to the DNAseq-based approach.
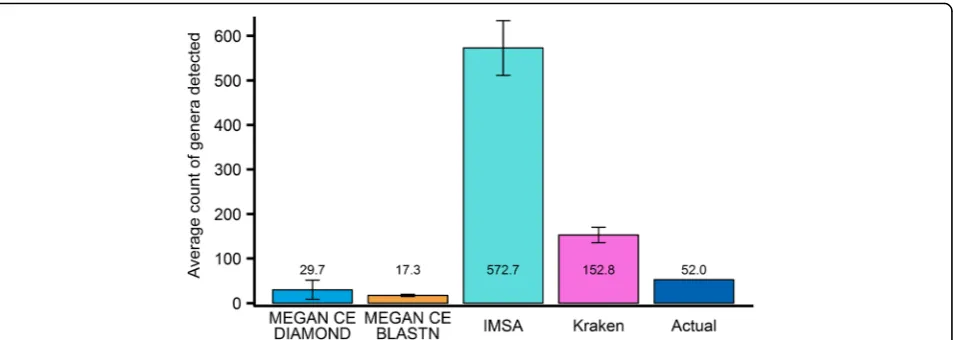
An RNAseq-based metataxonomics faces new challenges. Our brief survey on adapting DNAseq-based taxonomy classification tools to the analysis of RNAseq shotgun reads, both simulated and real data, showed that they yield impractical results (see Fig. 1 and Additional file 1 “Performance on Real Data”). RNAseq data is distinctly different from DNAseq data. Coding regions have higher conservation across species or can be result of the horizontal gene transfer. Hence, RNAseq reads are more likely to be ambiguous regarding their origins. Furthermore, the more informative, less ambiguous regions of meta-transcriptome may not be expressed under given conditions. Consequently, the taxonomy classification task with RNAseq is more difficult than that with DNAseq.
Methods
Reference sequence databases
Bacterial, fungal, and viral genomes and the corre-sponding transcriptomes as of March 1, 2015, were taken from the NCBI Genomes database [31]. To in-crease fungal representation in the reference database, additional select genomes and transcriptomes available as of June 1, 2015, were retrieved from FungiDB.org [32, 33]. For simplicity, members of Stramenopiles, sometimes called pseudo-fungi, were included in the database as members of the fungal kingdom. The re-trieved genomes were combined to make a custom reference genome database, while transcriptomes were used to generate simulated datasets (see below). This custom database was used by IMSA, IMSA+A, and MEGAN CE BLASTN pipelines. Also, the complete NCBI RefSeq database (January 10, 2016) [34] was used as an alternative reference database when testing IMSA+A.
Our Kraken database was constructed by combining the standard Kraken database (generated by its utility) with additional complete genome sequences of micro-organisms, sourced from Genbank. The database con-sists of 19,196 organisms in total, including 171 fungi, 3350 bacteria, 15448 viruses, and 227 others (primarily viridiplantae, metazoa, protists, and artificial sequences).
DIAMOND used the NCBI NR database as of October 4, 2016.
Accuracy measures
To evaluate performance of our protocol, true positive rate (TPR) and false discovery rate (FDR) were defined as follows:
TPR¼TP=ðTPþFNÞ ð1Þ
FDR¼FP=ðTPþFPÞ ð2Þ
where TP is the number of correctly identified taxa (true positive), FP—the number of taxa wrongly predicted to be in the dataset (false positive), FN—the number of taxa present but not identified (false negative). Other accur-acy measures are not applicable as they require true neg-atives (TN), which are not defined in the evaluation sets, and the protocol is not intended to predict them. De-sired optimal classification performance would be TPR > 0.90 and FDR < 0.10.
Statistics
Kruskal-Wallis test was used to evaluate the perform-ance difference (TPR, FDR) between groups. The signifi-cance level used wasα= 0.05.
Simulated datasets
shotgun reads in a unidirectional mode. Twenty-eight total datasets were generated representing various condi-tions used to evaluate the protocol.
To account for variable-relative abundance and gene expression, simulation incorporated a random relative abundance and random gene expression. Relative abun-dance was determined once per organism using a random uniform distribution from 1 to 20. Gene ex-pression was randomized using the same distribution as Flux Simulator [37], which was used to randomly gen-erate values within a range of 1 to 1000 relative units of expression. After normalization, the ultimate result is a maximum possible ratio of 1000:1 in FPKM scores for genes from the same organism (see details in Additional file 1“Simulated Gene Expression”). Because each kingdom’s reads were simulated separately, relative abundance was subsequently impacted by the choice of the proportion of reads allocated to each kingdom.
Transcript assemblers
The purpose of assembly in our protocol is to recon-struct putative genes thereby improving the taxonomy classification performance and reducing the computa-tional burden of sequence alignments since millions of shotgun reads assemble into thousands of contigs. Sev-eral assemblers were recently evaluated, measuring their performance with metatranscriptome data [28]. Of these, two transcriptome assemblers, Oases [29] and Inch-worm/Trinity [30], were chosen to be used in the IMSA +A protocol. Inchworm is a simple, fast, multi-threaded, de novo transcriptome assembler. It is conservative by extending reads only when there is an exact k-mer match. Oases operates similarly to Inchworm. However, Oases employs error correction schema. Oases merges multiple assemblies derived using various k-mers (an approach first described in [38, 39]) with a topological analysis for transcriptome-specific contigs corrections [26], including the elimination of cross-gene assemblies.
Improved IMSA counting scheme
The original IMSA workflow includes (1) subtraction of host sequences from the shotgun reads (with a number
of customizable parameters), (2) alignment of the remaining reads to the metagenome reference database using the megaBLAST algorithm [40], and (3) counting the number of BLAST hits to conduct taxonomy assign-ment. IMSA generates count reports at the species, genus, family, and division levels. In the case of ties, the count of 1 sequence splits evenly making fractional counts. All shotgun reads are considered as independent sequences. Therefore, multiple reads representing the same genomic location contribute to the counting as multiple hits. Thus, IMSA would not report whether a resulting count is due to many ambiguous alignments (scored ≤0.5 each) or because of fewer unique align-ments (scored 1 each), or a combination of these two scenarios.
Our protocol uses a modified counting scheme. It cal-culates the original IMSA counts, but breaks the count of each taxon into (1) the number of best matching se-quences without ties (unique counts or LCA counts [2]), (2) the number of sequences matching multiple taxa (ambiguous sequences), and (3) the sum of the fractional counts yielded by ambiguous sequences. Uniqueness is calculated at every clade. For example, if a sequence aligns to two different strains of Escherichia coli, then the sequence is counted as one unique hit for E. coliat the species clade level.
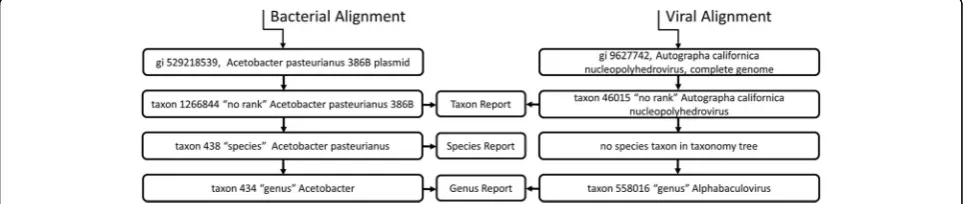
Viruses are represented in the NCBI database with in-complete taxonomies—a distinct virus may not have a species or genus assignment. IMSA and other tools put alignment evidence into taxonomic bins. Consequently, any species- or genus-based summary of the virus counts will be incomplete and misleading. To properly report the viruses detected in the sample, they are treated with a new scheme that accounts for this peculi-arity in a taxonomic classification. IMSA+A generates also report at the first taxon level (Fig. 2), which summa-rizes counts by the taxa identified by the BLAST align-ment, without traversing the classification tree to report the alignment counts at a different clade level. The re-ported taxon is usually a species, a subspecies (or strain), or the designation“no rank”. No rank indicates that the taxon does not belong to a clade. In the case of plasmid
sequences, IMSA will detect the organism, from where the plasmid originated, since the NCBI taxonomy tree for plasmids is structured so that each plasmid belongs to a taxon (species or strain).
Due to lack of any direct information in the database as to how taxonomically relate viruses, results for viruses were manually interpreted to compute accuracy mea-sures. Specifically, when two supposedly related viruses (as deduced from their similar names) were identified, the virus with considerably lower count (at least tenfold) was discarded. For example, Clostridium phage PhiS63 with count 1 was detected along with Clostridium phage phiSM101 with count 53. The former was removed from the list of detected viruses.
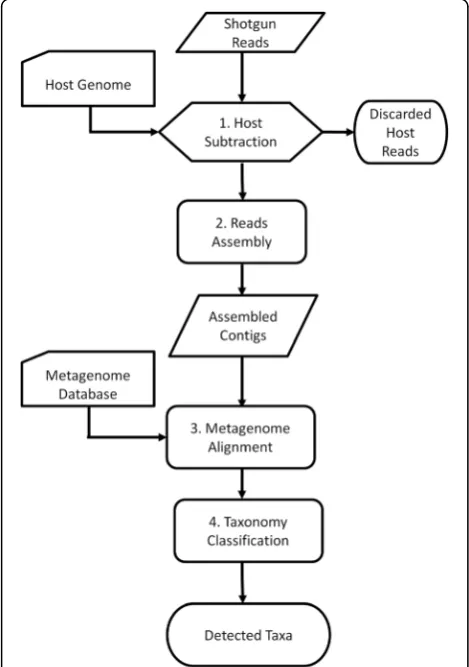
IMSA+A protocol
The new protocol aims to determine taxonomies of the microbiota represented in the metatranscriptome data. The protocol is based on IMSA [5] and adds a read as-sembly step and a modified taxonomy counting scheme. Figure 3 presents a workflow of the protocol.
RNAseq data can be submitted in either the FASTA or the FASTQ formats. All reads, including those from the
paired-end sequencing, will be treated as single reads per IMSA heuristic.
Step 1. Run IMSA to subtract host reads using a host genome/transcriptome database.
Step 2. Assemble the remaining reads.
Step 3. Align the assembled contigs against the metagenome database.
Step 4. Run the modified IMSA+A counter for taxonomy classification.
IMSA defines the steps of the metagenomic analysis in a high-level scripting language. To insert the assem-bly step into the IMSA workflow, IMSA is terminated after the host subtraction, and the last two steps are ex-ecuted outside the action script. IMSA+A provides no additional options for sequence alignments beyond those offered by IMSA.
Results
First, we demonstrate the effectiveness of the new proto-col in improving classification accuracy by using a con-servative reference database, a de novo assembler, and a new counting method. Additional key parameters, which usually confound classification, are permuted in simula-tion experiments to evaluate the protocol and identify its limitations. Then, we illustrate the performance of the developed protocol on a real RNAseq data derived from mice with a controlled microbiome, whose com-positional species are not included in the reference database.
Simulation experiments
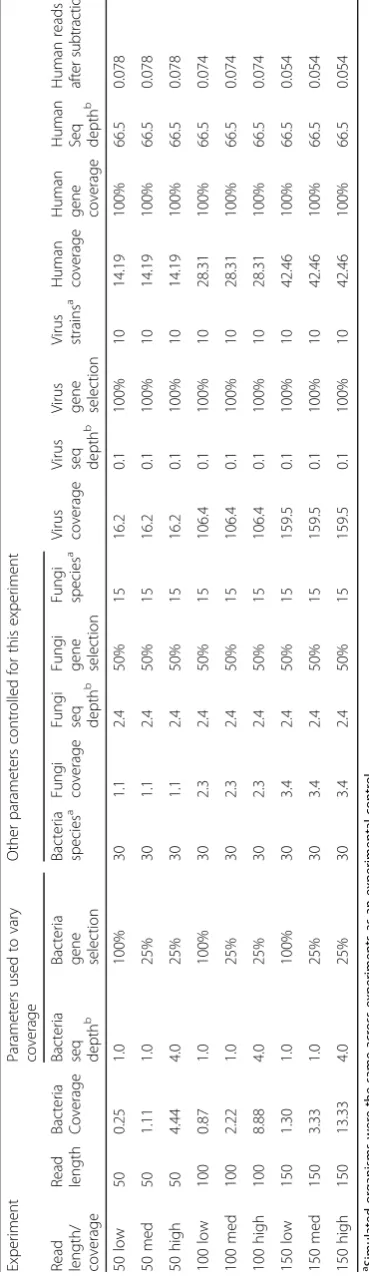
The simulation conditions were chosen to represent difficult taxonomy classification circumstances: high number of species present from multiple kingdoms (30 bacteria, 15 fungi, and 10 viruses, as well as a variable microbial composition), high host sequencing percentage (95%) leading to low microbiome sequen-cing depth, and 1% sequensequen-cing error rate. Percent gene selection was chosen 25 or 100% for bacteria, 50 and 100% for fungi and viruses, respectively. Variable gene expression and relative abundance were also evaluated in an additional dataset. Sequencing depth of 70 million was chosen to reflect our real sequencing data (not presented in this work). The proportion of sequencing depth and the number of species for each kingdom were chosen to be a plausible real-world composition. About 1% of human RNA sequences (five to eight hundred thousand) remained after subtrac-tion, and less than 0.1% of microbiome sequences were removed by subtraction step. Table 1 provides sum-mary of the nine main simulated datasets used to evaluate the protocol.
Table 1 Simulated datasets used for evaluating and optimizing the IMSA+A protocol Experim ent Parame ters used to vary coverag e Other parameters cont rolled for this exper iment Read length / coverag e Re ad le ngth Bacteria Coverage Bacteri a seq dept h b Bact eria ge ne se lection Bacteri a specie s a Fun gi coverag e
Fungi seq dept
h
b
Fungi gene selection Fungi specie
s
a
Virus coverag
e
Virus seq dept
It should be noted that organisms chosen for all simulated datasets remain in the reference database. This enabled computation of accuracy at species level and review of different parameters that potentially may influence performance of the new protocol. However, the final section of Results presents the evaluation of the protocol on real data, when the an-ticipated organisms are known to be not present in the reference database. This is the ultimate test of the usability of the protocol.
Comparison of counting schemes
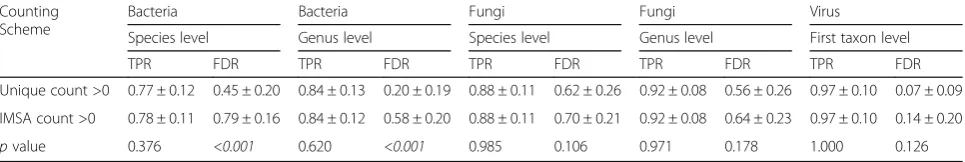
The results from 36 scenarios (9 datasets × 4 workflow versions) are summarized in Additional file 2: Table S1 and Additional file 3: Table S2 for the new counting and original IMSA counting methods, respectively. The new counting scheme consistently yields a lower FDR than the original IMSA counting scheme, while maintaining the same level of TPR (Table 2).
Subsequent results are only reported at the unique count >0 taxon-detection threshold.
Database for metagenome alignment
Table 3 demonstrates that a reference database con-structed of only whole genomes improves accuracy. Overall, results using the custom database had higher TPR and lower FDR than results based on RefSeq.
Subsequent results are reported using only the custom database. The ability of the protocol to classify micro-biome samples containing organisms, which are not represented in the reference database, is evaluated below (see Real data analysis).
Impact of assembler
Two assemblers capable of de novo metatranscriptome sequence assembly were evaluated for inclusion in the metataxonomics protocol. IMSA+A was run on the same nine datasets (Table 1) using the new count method and custom database, varying the assembler used (Fig. 4). The inclusion of an assembler improves taxonomy classification, both increasing true positives and reducing false positives. Oases lowers the number of FPs to about half of FPs by Inchworm.
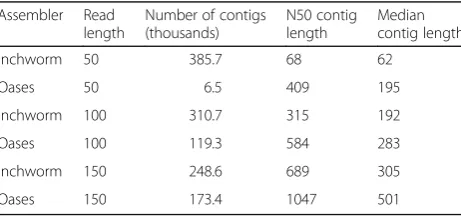
Table 4 presents a detailed comparison of IMSA+A results by the assembler used. Taxonomy classification based on Inchworm assembly produces higher TPR and FDR than when using Oases. This demonstrates that the error-correcting steps employed by Oases improve the quality of assembled contigs, fewer but longer (Table 5). The assemblers yield ten to five hundred times fewer sequences after assembly, which significantly reduces the time needed to calculate alignments.
Other key parameters
Further simulation experiments (Additional file 4: Table S3) investigated such parameters as read length (50, 100, or 150 bases, and a variable read length), mutation rate (0, 1, or 3%), composition and mixture of species, cover-age (see Additional file 1“Key Parameters”).
Only coverage was identified as a critical parameter (Additional file 1: Table S4). If it drops below 1, the proto-col shows difficulties in detecting organisms (Additional file 1: Tables S4 and S5). Coverage is determined by read length, sequencing depth, gene expression, and the number of organisms present. The protocol is robust to variation in these individual parameters, as long as the resulting coverage does not go below the critical point (Additional file 1: Tables S5–S7). Classification perform-ance decreases marginally as mutation rate increases up to 3% (Additional file 1: Table S8). Microbiome composition does not affect the protocol performance (Additional file 1: Table S9, Additional file 5: Figure S1, Additional file 6: Figure S2). Additional file 7: Figure S3 demonstrates the cumulative advantage of IMSA+A.
In previous simulation experiments, gene expression and relative abundance were controlled. We repeated the simulation conditions for “50 high” simulation (Table 1) with new randomly selected genomes, varying gene expression from 1 to 1000, and relative abundance from 1 to 20, both in relative units. The results show the protocol performs similarly to the simulation datasets with controlled gene expression and relative abundance (Table 6). Virus classification performance under these conditions shows FDR of 0.18. Thus, with highly variable expression, the protocol may have some difficulties in detecting viruses.
Table 2Average taxonomic classification performance by counting schemea
Counting Scheme
Bacteria Bacteria Fungi Fungi Virus
Species level Genus level Species level Genus level First taxon level
TPR FDR TPR FDR TPR FDR TPR FDR TPR FDR
Unique count >0 0.77 ± 0.12 0.45 ± 0.20 0.84 ± 0.13 0.20 ± 0.19 0.88 ± 0.11 0.62 ± 0.26 0.92 ± 0.08 0.56 ± 0.26 0.97 ± 0.10 0.07 ± 0.09
IMSA count >0 0.78 ± 0.11 0.79 ± 0.16 0.84 ± 0.12 0.58 ± 0.20 0.88 ± 0.11 0.70 ± 0.21 0.92 ± 0.08 0.64 ± 0.23 0.97 ± 0.10 0.14 ± 0.20
pvalue 0.376 <0.001 0.620 <0.001 0.985 0.106 0.971 0.178 1.000 0.126
TPR and FDR are averaged across all 36 experiments (see Additional file2: Table S1 and Additional file3: Table S2 for details), statistically significant results
Real data analysis
Altered Schaedler Flora (ASF) has long been used as a standardized gut microbiota to colonize germ-free ro-dents. ASF consists of eight species, Parabacteroides goldsteinii, twoClostridiumspecies, a Pseudoflavonifrac-tor species, Eubacterium plexicaudatum, Mucispirillum
schaedleri, Lactobacillus murinus, and Lactobacillus
intenstinalis [41]. We analyzed RNAseq data derived
from the samples taken from the germ-free, ASF colo-nized mice (NCBI SRA ID: SRA051354) [42, 43] using the IMSA+A (Oases) protocol. Of note, none of the eight species were included in the March 2015 NCBI ge-nomes database used in the IMSA+A protocol. The database does contain other species in the same genera for 6 of the ASF species; namely generaParabacteroides,
Lactobacillus (2 species), Clostridium (2 species), and
Eubacterium. For speciesM. schaedleri, the lowest
com-mon ancestor in the database belonged to family
Deferribacteraceae, and for the species of
Pseudoflavon-fractor, the lowest common ancestor belonged to order
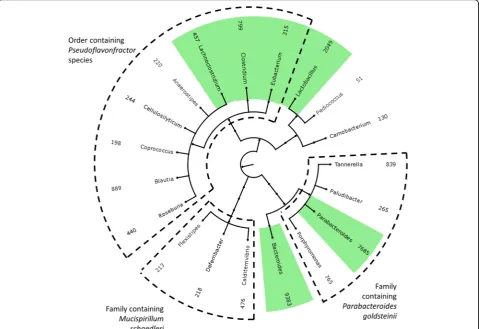
Clostridiales. Organisms unknown to the database are represented by counting the best homologue; conse-quently, one unknown organism may be represented by several organisms in the results. To minimize the false positives resulting from the presence of unknown organ-isms, we treated the 12 mice from the Xiong et. al. study [42] as technical replicates and considered only the gen-era found in all 12 samples as truly present. There was a total of 380 genera found in any of the 12 mice, of which 19 were found in all mice (Fig. 5). Of these 19, 4 were an exact match for a genus known to be present in ASF; namely Parabacteroides, Lactobacillus,Clostridium, and
Eubacterium. Additionally, the literature suggests that
Parabacteroides and Bacteroides are the same genera
when considering whole genome sequencing data [44],
and Lachnoclostridium has recently been proposed to
Fig. 4The number of genera identified by IMSA+A using different read assemblers. TP and FP counts are averaged over the nine simulated datasets (Table 1). *Viral genera are counted using the first defined taxon count (see Methods for details)
Table 3Average classification performance by metagenome database used
Database Bacteria Bacteria Fungi Fungi Virus
Species level Genus level Species level Genus level First taxon level
TPR FDR TPR FDR TPR FDR TPR FDR TPR FDR
RefSeq 0.76 ± 0.12 0.56 ± 0.20 0.83 ± 0.13 0.34 ± 0.19 0.78 ± 0.05 0.79 ± 0.19 0.89 ± 0.08 0.72 ± 0.23 0.95 ± 0.14 0.05 ± 0.07
Custom 0.78 ± 0.12 0.34 ± 0.12 0.84 ± 0.13 0.07 ± 0.07 0.98 ± 0.05 0.45 ± 0.21 0.96 ± 0.08 0.41 ± 0.19 0.99 ± 0.03 0.08 ± 0.10
pvalue 0.017 <0.001 0.507 <0.001 <0.001 <0.001 <0.001 <0.001 0.353 0.378
account for a subset ofClostridiumspecies, cluster XIV, that fall outside of family Clostridiaceae [45]. The
Clos-tridium species in ASF are cluster XIV [42], explaining
the presence ofLachnoclostridium in our results. Of the remaining 13 genera, three belong to family Deferribac-teraceae and account for the genusMucispirillum miss-ing in the database. The additional five genera belong to order Clostridiales and likely account for the missing genus Pseudoflavonfractor. Three genera are all closely related to genusParabacteroides. The remaining two gen-era are unrelated to the ASF species.
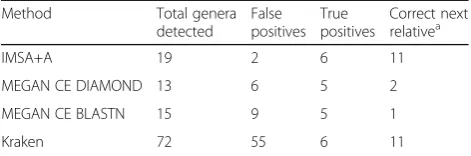
We compared the output from IMSA+A (Oases) to Kraken and MEGAN CE (MEGAN version 6) (Table 7). MEGAN BLASTN used the same custom database as IMSA+A, allowing for a direct comparison of IMSA+A to MEGAN CE BLASTN. Kraken generates a large number of false positives (55 additional genera). MEGAN CE versions are much more conservative, al-though still yielding more false positives than the IMSA +A protocol (six and nine by DIAMOND and BLASTN, respectively, vs two by IMSA+A). Moreover, both MEGAN CE versions failed to identify one genus known to be in the samples. The resulting cladograms corre-sponding to the evaluated methods can be found in Additional file 8: Figure S4; Additional file 9: Figure S5; Additional file 10: Figure S6; Additional file 11: Figure S7.
Discussion
One of the key challenges for taxonomy classification is handling the ambiguous genomic information. This
problem is especially pressing in the case of RNAseq data, where shotgun reads represent more conserved parts of microbial genomes. To address this issue, the IMSA+A protocol includes the following innovations: (1) assembles all RNAseq reads thereby reducing the degree of ambiguity, (2) ignores ambiguous sequences, and (3) uses only high-quality genome assemblies as a reference database.
We recommend using IMSA+A with the Oases assem-bler based on its lower FDR than Inchworm. However, Inchworm has the advantages of higher TPR and lower variability in overall classification performance. Running the analysis with both assemblers may provide insight to the researcher about coverage. If the Inchworm-based protocol leads to the identification of 50% more organ-isms than Oases, this may indicate that the sequencing data suffers from low coverage of the microbiome. In theory, any other RNAseq assembler could be used with IMSA+A instead of Oases.
The limited availability of high-quality genomes im-pedes an exact organism determination in most cases. Obviously, any organism not contained in the reference metagenome database cannot be determined; related or-ganisms will be identified instead as demonstrated in the Real data analysis section of Results. This is a fundamen-tal limitation of any metataxonomics tool.
From the simulated data, IMSA+A consistently has a higher FDR for fungi than for bacteria and viruses (Table 4). Misclassification may be the result of the lower diversity of sequenced fungi: of the few fully sequenced fungi (73 genomes) in the database, many of them are closely related. Another cause of misclassification may be the organization of the taxonomy tree for fungi: closely re-lated organisms are often far apart. For example,
Schizo-saccharomyces pombeand Saccharomyces cerevisiaehave
the lowest common taxon, the phylum Ascomycota, yet their genomes are similar enough to tie top BLAST hits for many queries. The need to revise the fungal taxonomy is a recognized problem, which is being addressed—fungal classifications are revised when genetic evidence is consid-ered [46]. Thus, we hypothesize that the reduction in FDR by classifying organisms at the genus level may help for bacteria but not for fungi, due to the underdeveloped phylogeny of the latter.
Table 4Average classification performance by the assembler used
Bacteria Bacteria Fungi Fungi Virus
Species level Genus level Species level Genus level First taxon level
Assembler TPR FDR TPR FDR TPR FDR TPR FDR TPR FDR
Inchworm 0.82 ± 0.02 0.40 ± 0.10 0.88 ± 0.03 0.10 ± 0.09 1.00 ± 0.00 0.56 ± 0.11 0.98 ± 0.03 0.52 ± 0.11 1.00 ± 0.00 0.13 ± 0.12
Oases 0.74 ± 0.17 0.28 ± 0.12 0.80 ± 0.17 0.05 ± 0.05 0.96 ± 0.07 0.33 ± 0.23 0.93 ± 0.10 0.30 ± 0.21 0.98 ± 0.04 0.03 ± 0.05
pvalue 0.010 0.010 0.005 0.022 0.356 0.012 0.365 0.005 0.008 0.057
TPR and FDR are averaged across 9 experiments each, statistical significant results highlighted in italics
Table 5Measures of assembly characteristics by the assembler program
Assembler Read length
Number of contigs (thousands)
N50 contig length
Median contig length
Inchworm 50 385.7 68 62
Oases 50 6.5 409 195
Inchworm 100 310.7 315 192
Oases 100 119.3 584 283
Inchworm 150 248.6 689 305
IMSA+A has limitations on its applicability. Taxonomy counts are often used to approximate relative abundance of organisms. IMSA+A should not be used for abundance estimation. First, IMSA+A output is counting data for as-sembled sequences, not the number of identical tran-scripts. Second, mRNA expression confounds such an analysis, because counts vary by individual gene expres-sion, which depends on multiple intractable factors. IMSA +A also should not be used with DNAseq data. RNA and DNA assembly are disparate problems, whereas Oases is designed for assembly of RNAseq data only.
Conclusions
We present a new protocol (IMSA+A) to meet the need for metagenomic taxonomy classification from RNAseq data. From the comprehensive evaluation of the protocol, we found the following. De novo assem-bly of RNAseq data reduces computation time and increases accuracy. The use of only high-quality, complete genomes in the reference database greatly reduces a false positive rate for taxonomy classification. IMSA+A is ro-bust for both short and long sequences, different mutation rates, variable gene expression and relative abundance, Table 6Classification performance of simulated data set with variable gene and relative abundance by IMSA+A (Oases)
Gene expression and relative abundance
Bacteria Bacteria Fungi Fungi Virus
Species level Genus level Species level Genus level First taxon level
TPR FDR TPR FDR TPR FDR TPR FDR TPR FDR
Fixeda 0.74 ± 0.17 0.28 ± 0.12 0.80 ± 0.17 0.05 ± 0.05 0.96 ± 0.07 0.33 ± 0.23 0.93 ± 0.10 0.30 ± 0.21 0.98 ± 0.04 0.03 ± 0.05
Variable 0.77 0.33 0.87 0.04 1.00 0.12 1.00 0.06 0.90 0.18
a
Average of all previous simulated experiments
Fig. 5Genera identified by the sum of unique hit counts for all 12 samples. Genera known to be in the samples arehighlighted with a green
and various microbe community compositions without restricting the type of organisms classified. IMSA+A is the first metataxonomics tool for RNAseq without restrictions on organisms in the reference database.
IMSA+A also creates an opportunity to analyze old transcriptome data, which was previously not ana-lyzed for taxonomic content. With the growing ap-preciation of the microbiome and its functional role in different contexts, such as environment and hu-man health, there is a need for re-analysis of the existing RNAseq datasets, specifically for extracting the microbiome information from the reads previ-ously considered as “garbage” and dismissed as not aligning to a reference genome. Therefore, IMSA+A gives researchers a second use for their metatran-scriptome data, as well as a possible way to minimize the cost of experiments.
Simulation experiments demonstrated that low se-quencing coverage limits the protocol’s ability to de-tect organisms, whereas database selection, de novo assembly of shotgun reads, and stricter counting scheme improve classification performance. The ana-lysis of real RNAseq data showed that the protocol is capable of detecting related taxa when the organisms are not in the reference genome database. Moreover, its performance is better than state-of-the-art methods for metataxonomics.
Additional files
Additional file 1:Key parameters, survey of metataxonomic tools, performance on real data, and simulated gene expression. (DOCX 1730 kb)
Additional file 2: Table S1.TPR and FDR are averaged across all 36 experiments. (XLSX 57 kb)
Additional file 3: Table S2.The new counting and original IMSA counting methods. (XLSX 59 kb)
Additional file 4: Table S3.Simulation experiments. (XLSX 65 kb)
Additional file 5: Figure S1.Distributions of microbiome communities generated for simulation experiments in terms of percentage (A) and species counts (B). The sequence percentages not displayed in the chart are human. High coverage—high bacteria coverage treatments (Table S4). Low Coverage—low coverage treatment for all organisms (Table S5). 3.3× bacteria—increased number of bacteriavsbaseline; 2×
fungi—increased number of fungivsbaseline; 5× virus—increased
number of virusesvsbaseline (Table S9). Out of 96 scenarios, 84 use the baseline composition. (PNG 53 kb)
Additional file 6: Figure S2.Phylogeny of microbiome communities generated for simulation experiments. Overall, IMSA+A is robust to large changes in composition (Table S9). (PNG 1450 kb)
Additional file 7: Figure S3.Comparison of the average number of genera detected for simulated datasets (Table 1) by the tested metataxonomic tools. The actual number of genera present is 52. IMSA+A was run with Oases assembler and custom database. *Viral genera are counted using the first defined taxon count for IMSA+A (see Methods for details). (PNG 136 kb)
Additional file 8: Figure S4.Genera identified by IMSA+A in all twelve samples containing ASF. Genera highlighted in green match organisms known to be present in the samples. Other colors represent“close relatives”with sequenced genomes to these ASF constituting organisms, which do not have sequenced genomes. Gold represents bacteria in the order Clostridiales, blue represents family Deferribacteraceae, and purple represents the same family as genusParabacteroides. (PNG 337 kb)
Additional file 9: Figure S5.Genera identified by Kraken in all twelve samples containing ASF. Colors have the same notation as in Figure S4. (PNG 585 kb)
Additional file 10: Figure S6.Genera identified by MEGAN CE with DIAMOND in all twelve samples containing ASF. Colors have the same notation as in Figure S4. (PNG 257 kb)
Additional file 11: Figure S7.Genera identified by MEGAN CE with BLASTN in all twelve samples containing ASF. Colors have the same notation as in Figure S4. (PNG 255 kb)
Abbreviations
16S:Prokaryotic 16S ribosomal RNA gene sequencing; 18S: Fungal 18S ribosomal RNA gene sequencing; ASF: Altered Schaedler flora; DNAseq: Shotgun DNA sequencing; FDR: False discovery rate; FPKM: Fragments per kilobase of exon per million reads mapped, a normalized unit for gene expression measurement; ITS: Internal transcribed spacer; LCA: Lowest common ancestor; NCBI: National Center for Biotechnology Information; RNAseq: Ribosomal depleted shotgun RNA sequencing; TPR: True positive rate
Acknowledgements
The authors are grateful to the CCHMC Division of Biomedical Informatics for large volume storage and computing resources enabling the conduct of this study.
Funding
This work was supported by the National Institutes of Health [5R01HL119190 to A.P.].
Availability of data and materials
Simulated datasets and databases supporting the conclusions of this article are available in the Figshare repository [https://figshare.com/s/9e62995bf520 e1ac0fc8] [47].
Project name: IMSA+A
Project home page: https://github.com/JeremyCoxBMI/IMSA-A Archived version: IMSA-A
Operating system: Linux
Programming Language: Python 2.7
Other requirements: IMSA+A depends on many other software tools. See installation instructions for full details.
License: GNU public license
Any restrictions to use by non-academics: Needs a license for IMSA and dependencies from the respective software developers.
Authors’contributions
JWC developed the IMSA+A protocol, ran simulations, and analyzed and interpreted data. RAB helped with the IMSA workflow. DHT helped with the analysis of the real samples. PV helped with benchmarking existing MTC workflows and reference databases. DBH helped with the Kraken workflow and its custom database. AP conceived of the project and supervised this work. All authors participated in drafting the manuscript, read, and approved the final manuscript.
Table 7Summary of Comparison of Various Tools on ASF data sample
Method Total genera
detected
False positives
True positives
Correct next relativea
IMSA+A 19 2 6 11
MEGAN CE DIAMOND 13 6 5 2
MEGAN CE BLASTN 15 9 5 1
Kraken 72 55 6 11
a
Competing interests
The authors declare that they have no competing interests.
Consent for publication
Not applicable.
Ethics approval and consent to participate
Not applicable.
Author details
1Department of Electrical Engineering and Computing Systems, University of
Cincinnati, 2901 Woodside Drive, Cincinnati, OH 45221, USA.2The Center for Autoimmune Genomics and Etiology, Cincinnati Children’s Hospital Medical Center, 3333 Burnet Avenue, MLC 15012, Cincinnati, OH 45229-3039, USA.
3Division of Biomedical Informatics, Cincinnati Children’s Hospital Medical
Center, 3333 Burnet Avenue, Cincinnati, OH 45229, USA.4Division of Infectious Diseases, Cincinnati Children’s Hospital Medical Center, 3333 Burnet Avenue, Cincinnati, OH 45229, USA.
Received: 21 July 2016 Accepted: 5 December 2016
References
1. Haft DH, Tovchigrechko A. High-speed microbial community profiling. Nature Methods. 2012;9:793–4.
2. Huson DH, Auch AF, Qi J, Schuster SC. MEGAN analysis of metagenomic data. Genome Research. 2007;17:377–86.
3. Wood DE, Salzberg SL. Kraken: ultrafast metagenomic sequence classification using exact alignments. Genome biology. 2014;15:R46. 4. Ja N-M, Peralta-Sánchez JM, González A, McMurdie PJ, Vázquez-Baeza Y,
Xu Z, Ursell LK, Lauber C, Zhou H, Song SJ, et al. Advancing our
understanding of the human microbiome using QIIME. Methods in Enzymology. 2013;531:371–444.
5. Dimon MT, Wood HM, Rabbitts PH, Arron ST. IMSA: integrated
metagenomic sequence analysis for identification of exogenous reads in a host genomic background. PloS one. 2013;8:e64546.
6. Kostic A, Ojesina A, Pedamallu C. PathSeq: software to identify or discover microbes by deep sequencing of human tissue. Nature. 2011;29:393–6. 7. Byrd AL, Perez-Rogers JF, Manimaran S, Castro-Nallar E, Toma I, McCaffrey T,
Siegel M, Benson G, Crandall K, Johnson WE. Clinical PathoScope: rapid alignment and filtration for accurate pathogen identification in clinical samples using unassembled sequencing data. BMC bioinformatics. 2014;15:262.
8. Francis OE, Bendall M, Manimaran S, Hong C, Clement NL, Castro-Nallar E, Snell Q, Schaalje GB, Clement MJ, Crandall KA, et al. Pathoscope: Species identification and strain attribution with unassembled sequencing data. Genome Research. 2013;23:1721–9.
9. Rawat A, Engelthaler DM, Driebe EM, Keim P, Foster JT. MetaGeniE: Characterizing Human Clinical Samples Using Deep Metagenomic Sequencing. PloS one. 2014;9:e110915.
10. Huson DH, Mitra S, Ruscheweyh H-j, Weber N, Schuster SC. Integrative analysis of environmental sequences using MEGAN4. Genome Research. 2011;21:1552–60.
11. Huson DH, Beier S, Flade I, Górska A, El-Hadidi M, Mitra S, Ruscheweyh H-J, Tappu R. MEGAN Community Edition-Interactive Exploration and Analysis of Large-Scale Microbiome Sequencing Data. PLoS Comput Biol. 2016;12(6): e1004957.
12. Buchfink B, Xie C, Huson DH. Fast and sensitive protein alignment using DIAMOND. Nature methods. 2015;12(1):59–60.
13. Segata N, Waldron L, Ballarini A, Narasimhan V, Jousson O, Huttenhower C. Metagenomic microbial community profiling using unique clade-specific marker genes. Nature Methods. 2012;9:811–4.
14. Truong DT, Franzosa EA, Tickle TL, Scholz M, Weingart G, Pasolli E, Tett A, Huttenhower C, Segata N. MetaPhlAn2 for enhanced metagenomic taxonomic profiling. Nature Methods. 2015;12:902–3.
15. Bhaduri A, Qu K, Lee CS, Ungewickell A, Khavari PA. Rapid identification of non-human sequences in high-throughput sequencing datasets. Bioinformatics (Oxford, England). 2012;28:1174–5.
16. Naccache SN, Federman S, Veeraraghavan N, Zaharia M, Lee D, Samayoa E, Bouquet J, Greninger AL, Luk K-C, Enge B, et al. A cloud-compatible bioinformatics pipeline for ultrarapid pathogen identification from next-generation sequencing of clinical samples. Genome Research. 2014;24:1180–92.
17. Freitas TK, Li P-E, Scholz MB, Chain PSG. Accurate read-based metagenome characterization using a hierarchical suite of unique signatures. Nucleic Acids Research. 2015;43:e69.
18. Wang Q, Jia P, Zhao Z. VirusFinder: software for efficient and accurate detection of viruses and their integration sites in host genomes through next generation sequencing data. PloS one. 2013;8:e64465.
19. Chen Y, Yao H, Thompson EJ, Tannir NM, Weinstein JN, Su X. VirusSeq: Software to identify viruses and their integration sites using next-generation sequencing of human cancer tissue. Bioinformatics. 2013;29:266–7. 20. Huffnagle GB, Noverr MC. The emerging world of the fungal microbiome.
Trends in Microbiology. 2013;21:334–41.
21. Ghannoum MA, Jurevic RJ, Mukherjee PK, Cui F, Sikaroodi M, Naqvi A, Gillevet PM. Characterization of the oral fungal microbiome (mycobiome) in healthy individuals. PLoS pathogens. 2010;6:e1000713.
22. Brady A, Salzberg SL. Phymm and PhymmBL: metagenomic phylogenetic classification with interpolated Markov models. Nature methods. 2009;6:673–6. 23. Borozan I, Watt SN, Ferretti V. Evaluation of alignment algorithms for discovery
and identification of pathogens using RNA-Seq. PloS one. 2013;8:e76935. 24. Passalacqua KD, Varadarajan A, Ondov BD, Okou DT, Zwick ME, Bergman
NH. Structure and complexity of a bacterial transcriptome. Journal of Bacteriology. 2009;191:3203–11.
25. Sorek R, Cossart P. Prokaryotic transcriptomics: a new view on regulation, physiology and pathogenicity. Nat Rev Genet. 2010;11:9–16.
26. Leimena MM, Ramiro-Garcia J, Davids M, van den Bogert B, Smidt H, Smid EJ, Boekhorst J, Zoetendal EG, Schaap PJ, Kleerebezem M. A comprehensive metatranscriptome analysis pipeline and its validation using human small intestine microbiota datasets. BMC genomics. 2013;14:530.
27. Xu G, Strong MJ, Lacey MR, Baribault C, Flemington EK, Taylor CM. RNA CoMPASS: a dual approach for pathogen and host transcriptome analysis of RNA-seq datasets. PloS one. 2014;9:e89445.
28. Celaj A, Markle J, Danska J, Parkinson J. Comparison of assembly algorithms for improving rate of metatranscriptomic functional annotation.
Microbiome. 2014;2:39.
29. Schulz MH, Zerbino DR, Vingron M, Birney E. Oases: robust de novo RNA-seq assembly across the dynamic range of expression levels. Bioinformatics. 2012;28:1086–92.
30. Grabherr MG, Haas BJ, Yassour M, Levin JZ, Thompson DA, Amit I, Adiconis X, Fan L, Raychowdhury R, Zeng Q, Chen Z, Mauceli E, Hacohen N, Gnirke A, Rhind N, di Palma F, Birren BW, Friedman N, Regev A. Trinity: reconstructing a full-length transcriptome without a genome from RNA-Seq data. Nature Biotechnology. 2013;29:644–52.
31. NCBI Genomes Database. ftp://ftp.ncbi.nlm.nih.gov/genomes/. Accessed 1 Mar 2015.
32. FungiDB: Fungal and Oomycete Genomics Resources. http://www.fungidb. org/fungidb/. Accessed 1 June 2015.
33. Stajich JE, Harris T, Brunk BP, Brestelli J, Fischer S, Harb OS, Kissinger JC, Li W, Nayak V, Pinney DF, et al. FungiDB: an integrated functional genomics database for fungi. Nucleic Acids Res. 2012;40(Database issue):D675–681. 34. NCBI Complete RefSeq Database. http://ftp.ncbi.nlm.nih.gov/refseq/release/.
Accessed 10 Jan 2016.
35. Angly FE, Willner D, Rohwer F, Hugenholtz P, Tyson GW. Grinder: a versatile amplicon and shotgun sequence simulator. Nucleic Acids Research. 2012;40:e94. 36. Matsumoto M, Nishimura T. Mersenne twister: a 623-dimensionally
equidistributed uniform pseudo-random number generator. ACM Transactions on Modeling and Computer Simulation. 1998;8:3–30. 37. Griebel T, Zacher B, Ribeca P, Raineri E, Lacroix V, Guigo R, Sammeth M.
Modelling and simulating generic RNA-Seq experiments with the flux simulator. Nucleic Acids Res. 2012;40(20):10073–83.
38 Robertson G, Schein J, Chiu R, Corbett R, Field M, Jackman SD, Mungall K, Lee S, Okada HM, Qian JQ, et al. De novo assembly and analysis of RNA-seq data. Nature methods. 2010;7:909–12.
39 Surget-Groba Y, Montoya-Burgos JI. Optimization of de novo transcriptome assembly from next-generation sequencing data. Genome Research. 2010; 20:1432–40.
40 Zhang Z, Schwartz S, Wagner L, Miller W. A greedy algorithm for aligning DNA sequences. Journal of computational biology : a journal of computational molecular cell biology. 2000;7:203–14.
42 Xiong X, Frank DN, Robertson CE, Hung SS, Markle J, Canty AJ, McCoy KD, Macpherson AJ, Poussier P, Danska JS, et al. Generation and analysis of a mouse intestinal metatranscriptome through Illumina based RNA-sequencing. PLoS ONE. 2012;7:e36009.
43 Sequence Read Archive (SRA) Dataset SRA051354 in the NCBI SRA database. https://www.ncbi.nlm.nih.gov/sra/. Accessed 12 July 2016.
44 Karlsson FH, Ussery DW, Nielsen J, Nookaew I. A Closer Look at Bacteroides: Phylogenetic Relationship and Genomic Implications of a Life in the Human Gut. Microbial Ecology. 2011;61:473–85.
45 Yutin N, Galperin MY. A genomic update on clostridial phylogeny: Gram-negative spore formers and other misplaced clostridia. Environ Microbiol. 2013;15:2631–41.
46 Hibbett DS, Taylor JW. Fungal systematics: is a new age of enlightenment at hand? Nature reviews Microbiology. 2013;11:129–33.
47 IMSA+A databases and datasets. https://figshare.com/s/9e62995bf520 e1ac0fc8. Accessed 12 July 2016.
• We accept pre-submission inquiries
• Our selector tool helps you to find the most relevant journal • We provide round the clock customer support
• Convenient online submission • Thorough peer review
• Inclusion in PubMed and all major indexing services • Maximum visibility for your research
Submit your manuscript at www.biomedcentral.com/submit