VOLUME 37, ARTICLE 14, PAGES 414
,
454
PUBLISHED 18 AUGUST 2017
http://www.demographic-research.org/Volumes/Vol37/14/ DOI: 10.4054/DemRes.2017.37.14
Research Article
Supportive families versus support from
families:
The decision to have a child in the Netherlands
Susan B. Schaffnit
Rebecca Sear
This publication is part of the Special Collection on “The Power of the Family,” organized by Guest Editors Hilde A.J. Bras and Rebecca Sear.
© 2017 Susan B. Schaffnit & Rebecca Sear.
This open-access work is published under the terms of the Creative Commons Attribution NonCommercial License 2.0 Germany, which permits use, reproduction & distribution in any medium for non-commercial purposes, provided the original author(s) and source are given credit.
1 Introduction 418 1.1 The cooperative breeding hypothesis and the link between family
support and fertility
419
1.2 Distinguishing levels of family support 421
2 Methods 422
2.1 Data 422
2.2 Family support 423
2.3 Distinguishing between and within family levels of support 425
2.4 Analysis 426
3 Results 427
3.1 Support over time: Between- and within-families 430 3.2 Between-family and within-family levels of support and fertility 433
4 Discussion 435
4.1 Limitations and future considerations 438
4.2 Conclusion 440
5 Acknowledgements 440
References 441
Supportive families versus support from families:
The decision to have a child in the Netherlands
Susan B. Schaffnit1 Rebecca Sear2
Abstract
BACKGROUND
Support from families can reduce costs of reproduction and may therefore be associated with higher fertility for men and women. Family supportiveness, however, varies both between families – some families are more supportive than others – and within families over time – as the needs of recipients and the abilities of support givers change. Distinguishing the effects of invariant between-family supportiveness and time-varying within-family supportiveness on fertility can help contribute to an understanding of how family support influences fertility.
OBJECTIVE
We distinguish ‘between’ and ‘within’ families for several types of support shared between parents and adult children and test whether between- and within-family variation in support associates with birth timings.
METHODS
We use seven years of annually collected LISS panel data from the Netherlands on 2,288 reproductive-aged men and women to investigate the timing of first and subsequent births.
RESULTS
We find between-family support is more often associated with fertility than is within-family support, particularly for first births and for women. Emotional support is generally associated with earlier first births for both men and women, while results for financial and reciprocal emotional support are mixed. There is some indication that the latter kind of support positively predicts births for men and negatively for women.
1 Department of Anthropology, University of California, Santa Barbara, USA. E-Mail:[email protected].
CONCLUSION
Our results suggest that feeling supported may be more important than actual support in reproductive decision-making in this high-income setting.
CONTRIBUTION
We apply a method novel to human demography to address both a conceptual and methodological issue in studies of families and fertility.
1. Introduction
Concern surrounding the underachievement of fertility preferences in Europe has prompted a large amount of research aimed at elucidating the reproductive decision-making process (Balbo, Billari, and Mills 2013). Research on links between families and fertility have demonstrated their importance in shaping couples’ fertility preferences and schedules through several pathways. Shared values (Noordhuizen, de Graaf, and Sieben 2011) and genes (Mills and Tropf 2015; Murphy and Knudsen 2002; Tropf et al. 2016) help transmit fertility patterns through lineages: There tends to be a significant, if weak, correlation between parents’ family size and the number of children they themselves have, at least in contemporary populations. Family relationships may also provide a range of social information and/or pressure which influences reproductive decision-making (Balbo and Mills 2011a; Bernardi and White 2010; Chisholm 1993; Hrdy 2009; Newson et al. 2005). Here we focus on how supportive interactions between family members may influence the fertility choices of men and women. We conceptualize family support as the range of material and emotional support that is given and received between family members throughout life and that may alter the real or perceived costs and benefits of reproduction; in the case of this study we focus on the support shared specifically between parents and their adult children.
Such inconsistencies in the literature on families and fertility in Europe may be due to an inability to disentangle two distinct meanings of support measured at any given time. Family support is common and diverse in form but can change substantially over time within families – for example, families may adjust support in response to recipients’ needs (Coall, Hilbrand, and Hertwig 2014; Snopkowski and Sear 2015) and givers’ abilities. Independently, supportiveness varies between families – some families are generally more or less supportive than others. This presents a problem when analysing correlations between family support and fertility: Traditional measures of family support conflate the effects of between-family and within-family levels of support on reproductive outcomes. It is possible that an increase/decrease in support relative to one’s own family norm (within-family levels of support) and having more/less support than other families (between-family levels of support) may have different correlations with fertility outcomes (van de Pol and Wright 2009). Unfortunately, it is usually impossible to distinguish between- and within-family support levels. In cross-sectional datasets it is not possible to determine whether an individual with a high level of family support comes from a typically highly supportive family or has just experienced a short-term boost in support from a typically less supportive family. Longitudinal data in principle allows between-family and within-family support to be distinguished but often have constraints which make this difficult: for example, waves are many years apart, inconsistently spaced, or survey questions are modified between waves.
Here we use an exceptional longitudinal dataset from the Netherlands, the Longitudinal Internet Studies for the Social Sciences (LISS) panel, which does not suffer from these problems. Using this data, we (1) distinguish and describe between-and within-family levels of several different types of support between-and (2) test for correlations between family support, at both within- and between-family levels, and progressions to first and subsequent births for men and women. In doing so we aim to elucidate the role of family support in reproductive decision-making in one high-income setting.
1.1 The cooperative breeding hypothesis and the link between family support and fertility
which is quite distinct from that of other primates (Hrdy 2009). Compatible with economic theory, the cooperative breeding hypothesis specifically predicts that higher levels of support will be correlated with higher levels of fertility. Yet, support is a diverse concept, particularly in high-income countries, encompassing many sources (parents, partners, friends, state institutions, etc.) and types (childcare, financial, emotional, etc.). Support could, for example, influence a woman’s fertility by altering her physiology (i.e., reducing the energetic costs of reproduction and increasing the likelihood that she is physically able to have another child) or her psychology (i.e., giving her the perception that it is the ‘right time’ to have a child, assuming that our evolved psychology associates having sufficient support to raise children with the ‘right time’ to have a child). Traditionally, the cooperative breeding framework gave primacy to the former and thus has emphasized the role of physical types of support like childcare or provisioning for children (Kramer 2010; Meehan, Quinlan, and Malcom 2013), in influencing reproductive outcomes (including child survival) in high-fertility and food-insecure societies. In contemporary high-income countries where women’s physiological/calorific needs are generally met and fertility rates are very low, women’s psychological state may have gained importance in the reproductive decision-making context, and thus more abstract (e.g., emotional) forms of support may have gained importance.
understanding of how support might influence fertility behaviors by distinguishing between-family and within-family levels of support when testing for correlations between family support and reproductive outcomes.
1.2 Distinguishing levels of family support
For any given type, support can be conceptualized at two different levels. Supportiveness varies between families – some families are more supportive than other families – and within families – supportiveness varies over time. Between-family support levels represent a family’s supportiveness relative to other families (their supportiveness ‘personality’). Theoretically, the between-family level of support is time-invariant, that is, some families are simply more supportive than others. In reality, like an individual’s personality (Mischel 2004), a family’s personality probably has both more and less stable components over a lifetime, though there is a dearth of research on this topic. Variation in supportiveness between families could be due to environmental factors or constraints (Brown and Brown 1993; Schaffnit and Sear 2014). For example, resource scarcity – a component of one’s environment – is sometimes associated with lower levels of supportiveness between family members as individuals have to focus attention on meeting their own needs with the few resources they have (Borgerhoff Mulder 2007; Brown and Brown 1993; Hadley 2004). Family structures and sizes may also account for variation in supportiveness between families (Danielsbacka et al. 2011; Laham, Gonsalkorale, and von Hippel 2005): Support levels may be lower in large families where investments are spread thinly among many people (at least when considering support from parents, which needs to be divided among many siblings in large families; when considering support from the wider family, large families have more potential support givers as well as more potential receivers) (Coall et al. 2009). Finally, heritable personality traits at the individual level (Asendorpf and Wilpers 1998; Charmantier, Keyser, and Promislow 2007) may also explain between-family levels of support.
unemployed) provide less financial support than those with more resources (Snopkowski and Sear 2015).
These different levels of interpretation for family support are conceptually distinct and will not necessarily correlate with fertility outcomes in similar ways (Brouwer, van de Pol, and Cockburn 2014; Martijn Salomons et al. 2006; Zhang et al. 2014). Conflating between- and within-family levels of support risks committing an ecological fallacy when interpreting correlations between the raw measures of support that have typically been used and fertility outcomes (Pollet et al. 2015). For example, being in a more supportive family than others (having high between-family support levels) may relate to earlier births and shorter birth intervals, but receiving more support than one’s family norm (high within-family support levels) could simultaneously predict delayed births if, say, an increase in support relative to one’s family norm is linked to a particular need for support on the part of the recipient which would deter births. That is, between- and within-family levels of the same type of support can have different (and even opposite) correlations with reproductive outcomes (Brouwer, van de Pol, and Cockburn 2014; Martijn Salomons et al. 2006; Snijders and Bosker 2012; Zhang et al. 2014). Determining whether between- or within-family support is more strongly associated with fertility can therefore help elucidate further how and why family support influences fertility.
In this paper we, for the first time, distinguish between- and within-family levels of support in a contemporary Netherlands sample and test whether higher amounts of each level of support are correlated with the timing of first and subsequent births. While sibling models have previously been used to assess the overall influence of families on demographic outcomes (e.g., Barclay et al. 2016), we introduce a method successfully used in biology into human demographic analysis which has the advantage of allowing singletons to be incorporated in the analysis. Both men and women are included in our sample. Even though we do not make a specific prediction as to whether between- or within-family levels support will have unique correlations with reproductive outcomes by gender, support from males’ kin may result in more pronatal outcomes than support of females’ kin if the costs of reproduction are lower for men than women and female mates are replaceable (Leonetti, Nath, and Hemam 2007; Mace and Colleran 2009).
2. Methods
2.1 Data
years of annually collected information (2008–2014) on 5,000 households and 8,000 individuals selected through a probability sample of households from the Statistics Netherlands population register (Scherpenzeel and Das 2010). Our analysis includes only panel members who were aged 15–45 in their first interview, in order to restrict our analysis to those likely to have a birth in the study period; as of 2014, age-specific fertility rates in the Netherlands were at 3.7 births per 1,000 for 15–19-year-olds, peaked in the 30–34 age range at 132.1, and dropped to only 0.39 for the 45–49 age group (Eurostat 2015). We further imposed certain restrictions in order to calculate between- and within-family support measures reliably: a minimum of three nonmissing years of data were necessary for inclusion, and no more than 20% of waves could be missing between their first and final interview wave. With these exclusions, 2,288 people (985 males and 1,303 females) and 13,460 person-years were available for analysis (5,771 for males; 7,689 for females). Participants excluded based on incompleteness of data were younger, less educated, more likely male, less likely to have a birth in the study period, and less likely to be a parent at the beginning of the study period than those who were included (Appendix Table A-1). Exploratory analyses using the complete sample showed similar results to those presented with the restricted sample, which suggests that our key findings are not simply by-products of the restricted sample. All participants in the sample contributed three or more years of data to the analysis, with 1,786 contributing five or more years’ worth of data. Information on participants’ fertility schedules, support received from and given to parents, and characteristics of the focal individuals’ parents was obtained from the Family and Household Core Survey, which is collected annually. Basic household information was obtained from the Base LISS Surveys, which are updated on a monthly basis. Base surveys from months and years corresponding to the Family and Household Survey were merged to the Family and Household Survey to gain information on several demographic and socioeconomic characteristics of focal individuals (age, education, employment status, etc.). All data is time-varying.
2.2 Family support
overall relationship quality between parents and adult child. Each type of support refers only to one’s relationship with their own parent – that is, information on parents-in-law is unavailable for partnered men and women. Relationship quality is scaled between 1 (not so good) and 4 (very good), and financial support had three ordered levels representing the amount of support over the previous year – none, <500 Euros, and >500 Euros. All other support variables have three ordered levels of frequency of support over the past three months – no, once or twice, or often. Participants with no surviving parents were given the lowest support score for each measure.
In this study we extend the concept of support as traditionally used in studies of kin support and fertility by considering both support given and received between family members. Using data on bidirectional support flowing between parents and their adult children gives a more meaningful and complete snapshot of the network and flow of exchanges within a family (Guo, Chi, and Silverstein 2012; Kim et al. 2015). Previous work which considered bidirectional flows of family support has been able to distinguish family types such as “exchangers,” “children as givers,” “emotionally detached,” or “disharmonious” (Chan 2008; Ferring et al. 2009; Guo, Chi, and Silverstein 2012). Such classifications accounting for bidirectional flows of support are important to consider if receiving a large amount of support from families – the typical metric of the family support and fertility literature – is actually generally paired with a high level of reciprocal support back to other family members. Ignoring this may overestimate the benefits of support if parents who are particularly supportive of their adult children expect and receive such support in return. Alternatively, discounting bidirectional flows of support may underestimate family supportiveness if downward flows are only noted for families with a healthy older generation who do not expect support in return.
We identified two factors using this method: reciprocal emotional support (high levels of counsel received from and given to parents, interest shown in parents’ lives, interest in own life from parents, and high relationship quality; Cronbach’s Alpha=0.91) and reciprocal practical support (high levels of practical and household help received and given; Cronbach’s Alpha=0.87). Measures of financial support between family members did not load onto either factor (Table A-2). Information on parental support in childcare was not included in the factor analysis because this type of support is specific to parous couples. These two types of support – childcare and financial – are thus analysed separately in the proceeding models from the family support patterns identified through factor analysis.
Table 1: Rotated factor loadings from confirmatory polychoric factor analysis models
Factor 1: Reciprocal Emotional Support
Parents show interest in life 0.98 Parents give counsel 0.89 Shows interest in parents’ lives 0.94 Gives counsel to parents 0.79 Overall relationship with parents 0.78 Factor 2: Reciprocal Practical Support
Received practical support from parents 0.86 Receives household help from parents 0.89 Gives practical help to parents 0.85 Gives household help to parents 0.89
2.3 Distinguishing between and within family levels of support
received by an individual throughout the study period; it thus represents the general level of each support type experienced by each individual compared to other individuals. This between-family level of support is time-invariant. The between-family measure of support is based only on prebirth observations for nulliparous individuals. For parous people who stay in the dataset after the birth of a child there is some concern that having a birth within the study period will inflate between-family support scores if support increases following a birth. A look at correlations between raw levels of support and time in the years immediately prior to and postbirth suggests that this is unlikely to largely bias our results (Figure A-1). We will return to this concern in more detail in Section 4.1. In contrast, the within-family median-centred level of support is measured as the difference of support in a given year and the median support of that type for each person. The median-centred value (within-family support) captures whether, in a given time period, supportiveness of each type is higher (positive value) or lower (negative value) than is the family norm. This measure is independent of between-family variation in family support (van de Pol and Wright 2009; Snijders and Bosker 2012), and, unlike between-family levels of support, within-family levels vary from year to year.
Altogether, eight family support variables are the primary predictors for the following analysis: between-family levels of reciprocal emotional support, reciprocal practical support, financial support from parents, and childcare from parents; and within-family levels of the same support types (Table 2).
Table 2: Summary of measures of support, the key predictors for the analysis Level of support Measurement Type of variable Types of support
Between-family variation in
support Median value of supportacross all waves Time-invariant - emotional support- practical support - financial support - childcare Within-family variation in
support Difference between supportgiven in that wave and the median level of support across all waves for that person (median-centred value)
Time-varying. Variable lagged by one year, so that support in year t–1 predicts birth in year t
- emotional support - practical support - financial support - childcare
2.4 Analysis
in the LISS dataset were couples (with separate interviews), but to maximize the sample size participants were not excluded if their partner was not represented in the dataset. In all models the dependent variable was a binary indicator of whether a birth occurred in a given year. Time was measured as age for nulliparous members of the sample and as years since previous birth (interbirth interval, IBI) for those who had already had children. Individuals only appeared in the analysis in the years in which they were observed (i.e., data is both right- and left-censored).
All four models include time-varying binary variables for the survival status of participants’ mother and father, time-varying partnership status, time-varying personal income (in 1,000s of Euros), and education (no university education/university education). These models also included between-family levels of all four support types as well as within-family support levels. Within-family levels were lagged by one year such that within-family support in time t‒1 predicted the probability of birth in time t. The models for those who already had children included a control for time-varying parity, age at first interview, and a quadratic function of time since previous birth to account for the nonlinear association between probability of birth and time since previous birth. Models for nulliparous people included a quadratic function of age to take into account the nonlinear association between age and probability of birth.
The assumption of proportional hazards of each form of support over time was tested by including interaction between each support measure and time in each of the four models individually. Models assuming time-invariant effects of support are presented. Where evidence of an interaction (i.e., time-dependence of support effects) was found, results are presented in figures.
3. Results
Figure 1: Hazards of birth by parity and sex
Hazard of first birth Hazard of additional birth
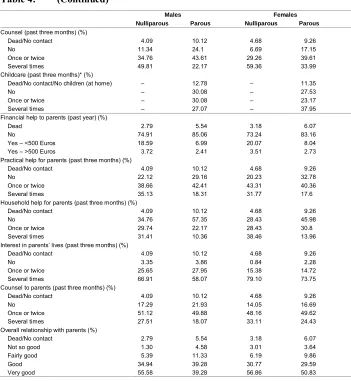
Table 3: Descriptive statistics for family support variables for men’s and women’s families in first study wave by fertility status (N=2,288)
Males Females Nulliparous Parous Nulliparous Parous
Number of individuals 565 420 636 667
Number of births 90 138 123 185
Mean [min–max]
Parity – 1.89 [1–6] – 1.97 [1–6]
Age of the household member 28.33 [15–45] 38.42 [20–45] 26.35 [15–45] 37.46 [17–45] Reciprocal emotional support (factor score) 2.69 [0–3.16] 2.37 [0–3.16] 2.75 [0–3.16] 2.51 [0–3.16] Reciprocal practical support (factor score) 2.05 [0–3.19] 1.51 [0–3.19] 2.13 [0–3.19] 1.65 [0–3.19]
Mother alive (%) 93.62 88.49 94.49 87.69
Father alive (%) 87.92 72.73 92.43 75.49
Financial help (past year)* (%)
Dead 3.03 5.72 2.42 7.55
No 49.13 72.05 43.31 66.94
Yes – <500 Euros 27.92 11.78 31.78 14.9 Yes – >500 Euros 19.91 10.44 22.49 10.61 Practical help (past three months) (%)
Dead/No contact 4.09 10.12 4.68 9.26
No 27.7 47.71 20.07 39.91
Once or twice 34.01 27.71 32.61 30.96
Several times 34.2 14.46 42.64 19.88
Household help (past three months) (%)
Dead/No contact 4.09 10.12 4.68 9.26
No 43.68 62.17 39.8 50.83
Once or twice 16.91 16.39 17.39 22.31
Several times 35.32 11.33 38.13 17.6
Interest in life (past three months) (%)
Dead/No contact 4.09 10.12 4.68 9.26
No 2.79 5.3 1.67 3.64
Once or twice 10.41 17.83 9.03 12.14
Several times 82.71 66.75 84.62 74.96
0 0.05 0.1 0.15
15 18 21 24 27 30 33 36 39 42 45 48 51
H a za rd Age (years) Males Females 0 0.05 0.1 0.15 0.2
1 3 5 7 9 11 13 15 17 19 21 23 25 27 29
H
a
za
rd
Birth interval (years)
Table 4: (Continued)
Males Females Nulliparous Parous Nulliparous Parous Counsel (past three months) (%)
Dead/No contact 4.09 10.12 4.68 9.26
No 11.34 24.1 6.69 17.15
Once or twice 34.76 43.61 29.26 39.61
Several times 49.81 22.17 59.36 33.99
Childcare (past three months)* (%)
Dead/No contact/No children (at home) – 12.78 – 11.35
No – 30.08 – 27.53
Once or twice – 30.08 – 23.17
Several times – 27.07 – 37.95
Financial help to parents (past year) (%)
Dead 2.79 5.54 3.18 6.07
No 74.91 85.06 73.24 83.16
Yes – <500 Euros 18.59 6.99 20.07 8.04
Yes – >500 Euros 3.72 2.41 3.51 2.73
Practical help for parents (past three months) (%)
Dead/No contact 4.09 10.12 4.68 9.26
No 22.12 29.16 20.23 32.78
Once or twice 38.66 42.41 43.31 40.36
Several times 35.13 18.31 31.77 17.6
Household help for parents (past three months) (%)
Dead/No contact 4.09 10.12 4.68 9.26
No 34.76 57.35 28.43 45.98
Once or twice 29.74 22.17 28.43 30.8
Several times 31.41 10.36 38.46 13.96
Interest in parents’ lives (past three months) (%)
Dead/No contact 4.09 10.12 4.68 9.26
No 3.35 3.86 0.84 2.28
Once or twice 25.65 27.95 15.38 14.72
Several times 66.91 58.07 79.10 73.75
Counsel to parents (past three months) (%)
Dead/No contact 4.09 10.12 4.68 9.26
No 17.29 21.93 14.05 16.69
Once or twice 51.12 49.88 48.16 49.62
Several times 27.51 18.07 33.11 24.43
Overall relationship with parents (%)
Dead/No contact 2.79 5.54 3.18 6.07
Not so good 1.30 4.58 3.01 3.64
Fairly good 5.39 11.33 6.19 9.86
Good 34.94 39.28 30.77 29.59
Very good 55.58 39.28 56.86 50.83
Note: * Variables marked with an asterisk (*) were used to generate median and median-centred values (between- and within-family levels). Other variables were included in factor analyses to create support factor scores that were subsequently used to generate median and median-centred values.
variation was seen in helping towards the older generation, with some forms of support being more common for women to provide (e.g., helping around the household), and others for men (e.g., practical support). Scores for reciprocal emotional and practical support were also higher for females than males.
3.1 Support over time: Between- and within-families
Levels of support varied between and within individuals and over time. Depending on gender and parity, the proportion of total variation in support that is between subjects (rho) ranges from 51%–76% for the support measures, meaning that for all support measures there is a greater amount of variation between individuals than within individuals over time (Table A-3). The measures with the highest between-individual variance were reciprocal emotional support for nulliparous females (rho=0.76) and financial and childcare support for parous males (both rho=0.71). On the other hand, between-individual variance was lowest (and thus within-individual variance was highest) for reciprocal emotional support for parous males (rho=0.53) and financial support for parous and nulliparous females (rho=0.54 and rho=0.51, respectively). Some types of support also vary predictably over time.
Figure 2a: Predicted within-family levels of support over time, showing fluctuations in support by age
Nulliparous males
Figure 2b: Predicted within-family levels of support over time, showing fluctuations in support by birth interval length relative to one’s own family norm
Parous males
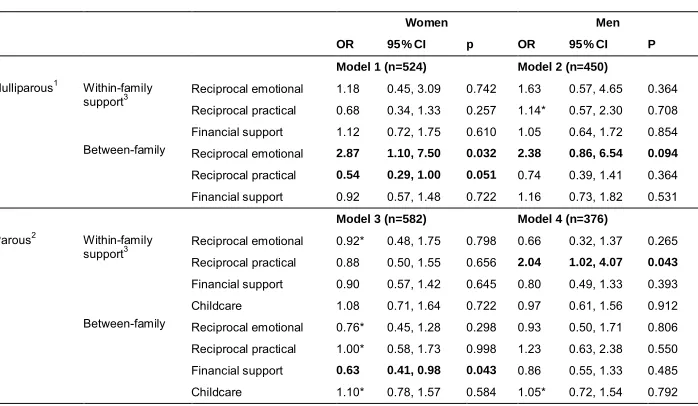
3.2 Between-family and within-family levels of support and fertility
We used discrete-time event history analysis to test for correlations between support – between-family and lagged within-family levels – and fertility for nulliparous and parous men and women. Results are shown firstly from models assuming time-independent effects of support (no interactions with time) (Table 5); when we found evidence of time dependence, we show results in figures (Figure 3).
For nulliparous men and women, between-family support more clearly predicted the timing of first births than within-family support. Women whose families had higher levels of reciprocal emotional support had earlier first-birth progressions (higher probability of birth per unit time), and there was suggestive evidence that the same may be true for males. For women, the opposite was true when it came to more hands-on, practical support: There is weak evidence that women in families with higher levels of reciprocal practical support than other families had slower birth progressions (lower probability of birth per unit time). Within-family support was less predictive of subsequent births for nulliparous men and women. In one case, that of reciprocal practical support, within-family levels did correlate with timing of first births for men, but the effects were time-dependent: Between their late 20s and late 30s, men who received higher within-family levels of practical support had higher odds of a birth in the following year than those with lower levels of within-family reciprocal practical support (Figure 3).
Similar to nulliparous participants, within-family support was less predictive of subsequent births for parous men and women – and were predictive in only two cases. Parous males whose families had higher levels of practical support than usual in one year (i.e., high within-family support) had over two times the odds of birth in the next year. For women, those with higher within-family levels of reciprocal emotional support had lower odds of an additional birth, but only in the first year following a birth (graph not shown). Very few people in the sample had a child in the first year following a birth, so despite the presence of interaction between birth interval and this type of support, we do not place weight on this result.
Table 5: Odds ratios (OR), 95% confidence intervals (95% CI), and p-values (p) for support measures from event history analysis for birth progressions by parity and gender assuming time-independent effects
Women Men OR 95% CI p OR 95% CI P Model 1 (n=524) Model 2 (n=450) Nulliparous1 Within-family
support3 Reciprocal emotional 1.18 0.45, 3.09 0.742 1.63 0.57, 4.65 0.364
Reciprocal practical 0.68 0.34, 1.33 0.257 1.14* 0.57, 2.30 0.708 Financial support 1.12 0.72, 1.75 0.610 1.05 0.64, 1.72 0.854 Between-family Reciprocal emotional 2.87 1.10, 7.50 0.032 2.38 0.86, 6.54 0.094 Reciprocal practical 0.54 0.29, 1.00 0.051 0.74 0.39, 1.41 0.364 Financial support 0.92 0.57, 1.48 0.722 1.16 0.73, 1.82 0.531
Model 3 (n=582) Model 4 (n=376) Parous2 Within-family
support3 Reciprocal emotional 0.92* 0.48, 1.75 0.798 0.66 0.32, 1.37 0.265 Reciprocal practical 0.88 0.50, 1.55 0.656 2.04 1.02, 4.07 0.043 Financial support 0.90 0.57, 1.42 0.645 0.80 0.49, 1.33 0.393 Childcare 1.08 0.71, 1.64 0.722 0.97 0.61, 1.56 0.912 Between-family Reciprocal emotional 0.76* 0.45, 1.28 0.298 0.93 0.50, 1.71 0.806 Reciprocal practical 1.00* 0.58, 1.73 0.998 1.23 0.63, 2.38 0.550 Financial support 0.63 0.41, 0.98 0.043 0.86 0.55, 1.33 0.485 Childcare 1.10* 0.78, 1.57 0.584 1.05* 0.72, 1.54 0.792
1
Nulliparous: controlling for age and age squared, parental survival, education, and income
2Parous: controlling for age at first interview, parity, time since last birth and time since last birth squared, parental survival,
education, and income
3Lagged by one year
Figure 3: Predicted odds of birth and 95% confidence intervals over time by support with time-dependent effects
Note: Interactions were each run in separate models. ‘Low,’ ‘medium,’ and ‘high’ refer to the lowest recorded, median, and highest recorded values of support for each type.
4. Discussion
potential mechanisms relating family support to fertility, we distinguished between- and within-family levels of support and tested for correlations between each level of support and birth progression for men and women in the Netherlands. Our results are varied, but, like previous research in high-income contexts (Low, Simon, and Anderson 2002; Waynforth 2012; Schaffnit and Sear, in press), they point towards the primacy of feeling supported over actual support in the reproductive decision-making process.
Feeling supported could arise due to having a generally more supportive family than others (high between-family support) for all types of support, but particularly the less tangible, emotional forms of support. These emotional forms of support could lead to “the understanding that extended family may be relied on when necessary,” as suggested by Waynforth (2012: 5). In contrast, high levels of tangible support (practical or financial) within families could be indicative of a ‘bad time’ to have a child due to temporary hardships within the family at the parent or adult child level. Our results to some extent speak to this division between feelings of support and actual support: Between-family levels of support are generally more predictive of birth progressions than within-family levels. For first births, high between-family levels of emotional support are predictive of earlier births for both males and females, and for women reciprocal practical and financial support negatively predicts first and later births, respectively.
rates of monogamy and low fertility it is questionable how much men’s and women’s and thus their families’ interests would diverge.
It is notable that for parous men and women, associations of between-family levels of material support (both reciprocal practical support and childcare) and fertility are time-dependent and predictive of progression to higher-order births only during the three to five years following a previous birth. The highest hazard of an additional birth for men and women is two to three years following a previous birth, meaning that between-family levels of concrete support have the largest (and only) correlation to birth progressions after the time of highest risk of birth. The hazard of birth four years following a previous birth is about half that of a birth three years after a previous birth, which may mean that the significance of this finding in practice is rather low. It is possible that such time-dependent findings are an artefact of inflated between-family levels of support arising from having had a birth during the period of observation, if support increases after a birth. However, the inconsistency of relationships with between-family measures of support and fertility across parity, gender, and type of support may suggest that this is not a problem (see discussion below in section 4.1).
Unlike previous studies of family support and fertility, we have considered support flowing both to and from parents and their adult children. Doing so allowed us to identify two family types in terms of their patterns and flow of support. Families with high levels of reciprocal emotional support gave counsel to one another and showed an interest in one another’s lives. Those with high levels of reciprocal practical support helped each other out with household chores and other life tasks. Such classifications allow for a more complete picture of a family’s support structure that could potentially shape one’s decision to have a birth. The finding that those who receive a lot of support also provide a lot of support may also help explain why associations between support and fertility may be weak, nonexistent, or contradictory in previous research, particularly with respect to material or practical support. Previous research has tended to assume that receiving support leads to an overall increase in the resources available for childbearing, but this assumption may overestimate the overall resources available if those receiving support are also likely to be providing support. It may also help explain differences between practical and emotional support in their relationship with childbearing, if emotional support is less subject to this kind of accounting. Had we only considered support received, correlations between support and fertility may have been underestimated given that the benefits of receiving support would be diluted by costs of giving support (if there are cost and benefits as such).
at a between-family level – correlated with shorter birth intervals for women (Kaptijn et al. 2010; Thomese and Liefbroer 2013). Kaptijn et al. (2010) specifically find that those who receive childcare support often (but not those who receive it occasionally) had a higher probability of having an additional birth. Though distinct from our concept of between-family levels of childcare, both our results and those of Kaptijn et al. (2010) point to the importance of consistency of support. Such consistency could be indicative of a sense of security, which influences one’s sense of being ready to have a child.
Regarding downward flows of financial support, there is no previous evidence that financial support from families correlates with birth progressions in the Netherlands (null results in Thomese and Liefbroer 2013), but our findings reflect others from the United Kingdom: Receiving cash or housing from parents negatively correlates to probabilities of birth (Waynforth 2012; Schaffnit and Sear, in press). We found that between-family levels of this type of support negatively correlated with birth progressions for parous women, but within-family levels had no correlation with birth progressions for males, females, parous, or nulliparous participants. In this way, ongoing financial support for parous women signals a poor time to reproduce in a way that reciprocal practical, reciprocal emotional, and childcare support do not.
In distinguishing between-family and within-family variation in support we were able to explore how family support changes over time relative to one’s own family norm. In general, we found a higher amount of variation in support levels between families than within families; in some cases, over two-thirds (and in one case three-fourths) of variation in support was between families as oppsed to within. Even so, certain types of support, particularly reciprocal practical support and financial support (but only for men in the latter case), decrease relative to the family norm during people’s 20s for those without children. It is likely that such decreases in within-family levels of support are due to migration out of the family home and perhaps the family city. Higher levels of these types of support after age 30 could be due to parents’ increasing needs or simply a tendency to move back to one’s place of origin. After having a child, families also may adjust their support regimes, though this is particularly pronounced for childcare. This is not unexpected because children both become less needy and are more likely to enrol in formal (state-provided or private) care as they age.
4.1 Limitations and future considerations
produce a dataset with enough data per person to separate between- and within-family levels of support. By dropping people with insufficient data, the sample ended up being less representative of the Dutch population than is ideal. As more waves of data become available, samples of people with complete (or near-complete) data will increase. This will be good for not only increasing sample sizes and the representativeness of the sample, but it will also allow for a fuller exploration of when within-family support matters. With more waves of information, within-family levels of support could be lagged by more than one year to determine if within-family levels of support matter more at certain times than others. Further, we may be able to explore alternative ways of characterising family support. For example, we could consider whether some families are more or less consistent in their levels of support over time as opposed to comparing mean amount of support between families.
One concern with the method of separating between- and within-family levels of support is that if support increases following a birth, then parous people who had a birth during the period of observation may have inflated between-family levels of support. Any positive correlations with between-family levels of support and having births could then be due to reverse causality; that is, having a birth predicting higher levels of support. We have several reasons to believe that this has not affected our results greatly in the study. Firstly, we investigated whether having a birth is correlated to higher raw levels of support in the years following a birth compared to years before the birth (Figure A-1). We find that reciprocal emotional and practical support are relatively stable in the wake of a birth. Financial support is higher following a birth than in the years preceding for women but not men. This means that having a birth within the study period has the potential to inflate between-family levels of financial support for women, yet despite this we do not find a positive correlation between this form of support and the timing of birth. Secondly, were between-family support levels inflated among those who had births while under observation, one would expect consistent positive correlations with between-family levels of support and progression of birth among males and females. We in fact find variation: Between-family levels of financial support for parous women negatively predict birth progressions for women but not men; and time-dependent, positive correlations with between-family levels of reciprocal emotional, reciprocal practical and childcare support and birth progressions are seen primarily among females. Although we have reason to believe that our results were not greatly biased by this conceptual issue, a cross-lagged analysis of the relationships between support and fertility could help clarify this potential problem and add to our understanding of the likely mutually predictive roles of support and reproduction within families.
broaden their scope to include support flowing between siblings, grandparents and adult grandchildren, and other kin.
4.2 Conclusion
Between- versus within-family interpretations of correlations between support and fertility help guide our understanding of mechanisms that may link family support to fertility outcomes in high-income, low-fertility settings. We found generally that having more support than other families was more predictive of progressing to a birth than short-term changes in support relative to one’s own family norm. Also, links between actual support (financial and reciprocal practical support) and birth progressions were more equivocal and more likely to be negative than other forms of support. Together this suggests that feeling generally supported emotionally may be more important than actual support in the decision to have children in modern, relatively affluent settings where the immediate physiological needs of reproduction are generally met without the extra support from families.
5. Acknowledgements
References
Asendorpf, J.B. and Wilpers, S. (1998). Personality effects on social relationships.
Journal of Personality and Social Psychology 74(6): 1531–1544. doi:10.1037/
0022-3514.74.6.1531.
Balbo, N., Billari, F.C., and Mills, M. (2013). Fertility in advanced societies: A review of research.European Journal of Population 29(1): 1–38. doi:10.1007/s10680-012-9277-y.
Balbo, N. and Mills, M. (2011a). The effects of social capital and social pressure on the intention to have a second or third child in France, Germany, and Bulgaria, 2004–05. Population Studies 65(3): 335–351. doi:10.1080/00324728.2011. 579148.
Barclay, K., Keenan, K., Grundy, E., Kolk, M., and Myrskylä, M. (2016). Reproductive history and post-reproductive mortality: A sibling comparison analysis using Swedish register data. Social Science and Medicine 155: 82–92.doi:10.1016/j. socscimed.2016.02.043.
Bernardi, L. and White, R.G. (2010). Close kin influences on fertility behavior. In: Kohli, M. and Heady, P. (eds.). Kinship and social security in contemporary Europe: Alternative approaches to the political economy of kinship. Frankfurt: Peter Lang.
Del Boca, D. (2002). The effect of child care and part time opportunities on participation and fertility decisions in Italy. Journal of Population Economics
15(3): 549–573.doi:10.1007/s001480100089.
Borgerhoff Mulder, M. (2007). Hamilton’s rule and kin competition: The Kipsigis case.
Evolution and Human Behavior 28(5): 299–312. doi:10.1016/j.evolhumbehav.
2007.05.009.
Borgerhoff Mulder, M. (2009). Tradeoffs and sexual conflict over women’s fertility preferences in Mpimbwe.American Journal of Human Biology 21(4): 478–487.
doi:10.1002/ajhb.20885.
Brown, G.E. and Brown, J.A. (1993). Do kin always make better neighbours? The effects of territory quality. Behavioral Ecology and Sociobiology 33(4): 225– 231.doi:10.1007/BF02027119.
Chan, T.W. (2008). The structure of intergenerational exchange in the UK. Oxford: University of Oxford (Sociology Working Papers 2008–05).
Charmantier, A., Keyser, A.J., and Promislow, D.E.L. (2007). First evidence for heritable variation in cooperative breeding behaviour. Proceedings of the Royal
Society B: Biological Sciences 274(1619): 1757–1761. doi:10.1098/rspb.2007.
0012.
Chi, P.S.K. and Hsin, P.-L. (1996). Family structure and fertility behavior in Taiwan.
Population Research and Policy Review 15(4): 327–339. doi:10.1007/
BF00128428.
Chisholm, J. (1993). Death, hope, and sex: Life-history theory and the development of reproductive strategies.Current Anthropology 34(1): 1–24.doi:10.1086/204131. Coall, D.A., Hilbrand, S., and Hertwig, R. (2014). Predictors of grandparental
investment decisions in contemporary Europe: Biological relatedness and beyond.PLoS One 9(1): e84082.doi:10.1371/journal.pone.0084082.
Coall, D.A., Meier, M., Hertwig, R., Wänke, M., and Höpflinger, F. (2009). Grandparental investment: The influence of reproductive timing and family size.
American Journal of Human Biology 21(4): 455–463.doi:10.1002/ajhb.20894.
Danielsbacka, M., Tanskanen, A.O., Jokela, M., and Rotkirch, A. (2011). Grandparental child care in Europe: Evidence for preferential investment in more certain kin.
Evolutionary Psychology 9(1): 3–24.doi:10.1177/147470491100900102.
DeSilva, J.M. (2011). A shift toward birthing relatively large infants early in human evolution.Proceedings of the National Academy of Sciences of the United States
of America 108(3): 1022–1027.doi:10.1073/pnas.1003865108.
Ferring, D., Michels, T., Boll, T., and Filipp, S.-H. (2009). Emotional relationship quality of adult children with ageing parents: On solidarity, conflict and ambivalence.European Journal of Ageing 6(4): 253–265. doi:10.1007/s10433-009-0133-9.
Hadley, C. (2004). The costs and benefits of kin. Human Nature 15(4): 377–395.
doi:10.1007/s12110-004-1015-7.
Hank, K. and Buber, I. (2009). Grandparents caring for their grandchildren: Findings from the 2004 Survey of Health, Ageing, and Retirement in Europe.Journal of
Family Issues 30(1): 53–73.doi:10.1177/0192513X08322627.
Hrdy, S.B. (2009). Mothers and others: The evolutionary origins of mutual
understanding. Cambridge: Harvard University Press.
Kaptijn, R., Thomese, F., Van Tilburg, T.G., and Liefbroer, A.C. (2010). How grandparents matter: Support for the cooperative breeding hypothesis in a contemporary Dutch population. Human Nature 21(4): 393–405. doi:10.1007/ s12110-010-9098-9.
Kertzer, D.I., White, M.J., Bernardi, L., and Gabrielli, G. (2009). Italy’s path to very low fertility: The adequacy of economic and second demographic transition theories. European Journal of Population 25(1): 89–115. doi:10.1007/s10680-008-9159-5.
Kim, K., Zarit, S.H., Fingerman, K.L., and Han, G. (2015). Intergenerational exchanges of middle-aged adults with their parents and parents-in-law in Korea.Journal of
Marriage and Family 77(3): 791–805.doi:10.1111/jomf.12185.
Kramer, K.L. (2010). Cooperative breeding and its significance to the demographic success of humans.Annual Review of Anthropology 39: 417–436.doi:10.1146/ annurev.anthro.012809.105054.
Laham, S.M., Gonsalkorale, K., and Von Hippel, W. (2005). Darwinian grandparenting: Preferential investment in more certain kin. Personality and
Social Psychology Bulletin 31(1): 63–72.doi:10.1177/0146167204271318.
Leonetti, D.L., Nath, D.C., and Hemam, N.S. (2007). In-law conflict. Current
Anthropology 48(6): 861–890.doi:10.1086/520976.
Low, B.S., Simon, C.P., and Anderson, K.G. (2002). An evolutionary ecological perspective on demographic transitions: Modeling multiple currencies.American
Journal of Human Biology 14(2): 149–167.doi:10.1002/ajhb.10043.
Mace, R. and Colleran, H. (2009). Kin influence on the decision to start using modern contraception: A longitudinal study from rural Gambia. American Journal of
Martijn Salomons, H., Müller, W., Dijkstra, C., Eising, C.M., and Verhulst, S. (2006). No sexual differences in embryonic period in jackdaws Corvus monedula and black-headed gulls Larus ridibundus. Journal of Avian Biology 37(1): 19–22.
doi:10.1111/j.0908-8857.2006.03614.x.
Mathews, P. and Sear, R. (2013a). Does the kin orientation of a British woman’s social network influence her entry into motherhood? Demographic Research 28(11): 313–340.doi:10.4054/DemRes.2013.28.11.
Mathews, P. and Sear, R. (2013b). Family and fertility: Kin influence on the progression to a second birth in the British Household Panel Study. PLoS One
8(3): e56941.doi:10.1371/journal.pone.0056941.
Meehan, C.L., Quinlan, R., and Malcom, C.D. (2013). Cooperative breeding and maternal energy expenditure among Aka foragers.American Journal of Human Biology 25(1): 42–57.doi:10.1002/ajhb.22336.
Mills, M.C. and Tropf, F.C. (2015). The biodemography of fertility: A review and future research frontiers.Kölner Zeitschrift für Soziologie und Sozialpsychologie
67(S1): 397–424.doi:10.1007/s11577-015-0319-4.
Mischel, W. (2004). Toward an integrative science of the person. Annual Review of
Psychology 55: 1–22.doi:10.1146/annurev.psych.55.042902.130709.
Moya, C. and Sear, R. (2014). Intergenerational conflicts may help explain parental absence effects on reproductive timing: A model of age at first birth in humans.
PeerJ 2: e512.doi:10.7717/peerj.512.
Moya, C., Snopkowski, K., and Sear, R. (2016). What do men want? Re-examining whether men benefit from higher fertility than is optimal for women.
Philosophical Transactions of the Royal Society B: Biological Sciences
371(1692): 20150149.
Murphy, M. and Knudsen, L.B. (2002). The intergenerational transmission of fertility in contemporary Denmark: The effects of number of siblings (full and half), birth order, and whether male or female. Population Studies 56(3): 235–248.
doi:10.1080/00324720215937.
Newson, L., Postmes, T., Lea, S.E.G., and Webley, P. (2005). Why are modern families small? Toward an evolutionary and cultural explanation for the demographic transition. Personality and Social Psychology Review 9(4): 360–375.
Noordhuizen, S., De Graaf, P.M., and Sieben, I. (2011). Explaining fertility norms in the Netherlands: The influence of sociodemographics, family networks, and life course events on pronatalism. Journal of Family Issues 32(12): 1647–1673.
doi:10.1177/0192513X11409529.
Van de Pol, M. and Wright, J. (2009). A simple method for distinguishing within-versus between-subject effects using mixed models.Animal Behaviour 77: 753– 758.doi:10.1016/j.anbehav.2008.11.006.
Pollet, T.V., Stulp, G., Henzi, S.P., and Barrett, L. (2015). Taking the aggravation out of data aggregation: A conceptual guide to dealing with statistical issues related to the pooling of individual-level observational data. American Journal of Primatology 77(7): 727–740.doi:10.1002/ajp.22405.
Schaffnit, S.B and Sear, R. (in press). Support for new mothers and fertility in the United Kingdom: Not all support is equal in the decision to have a second child.
Population Studies.
Schaffnit, S.B. and Sear, R. (2014). Wealth modifies relationships between kin and women’s fertility in high-income countries.Behavioral Ecology 25(4): 834–842.
doi:10.1093/beheco/aru059.
Scherpenzeel, A.C. and Das, M. (2010). ‘True’ longitudinal and probability-based internet panels: Evidence from the Netherlands. In: Das, M., Ester, P., and Kaczmirek, L. (eds.).Social and behavioral research and the internet: Advances
in applied methods and research strategies. Boca Raton: Taylor and Francis:
77–104.
Sear, R. and Coall, D.A. (2011). How much does family matter? Cooperative breeding and the demographic transition.Population and Development Review 37(Suppl. 1): 81–112.doi:10.1111/j.1728-4457.2011.00379.x.
Sheppard, P., Schaffnit, S.B., Garcia, J.R., and Sear, R. (2014). Fostering relations: First sex and marital timings for children raised by kin and non-kin carers.
Evolution and Human Behavior 35(3): 161–168. doi:10.1016/j.evolhumbehav.
2013.12.002.
Snijders, T.A.B. and Bosker, R.J. (2012). Multilevel analysis: An introduction to basic
and advanced mulitlevel modeling. Los Angeles: Sage.
Snopkowski, K. and Sear, R. (2015). Grandparental help in Indonesia is directed preferentially towards needier descendants: A potential confounder when exploring grandparental influences on child health.Social Science and Medicine
128: 105–114.
Tanskanen, A., Jokela, M., Danielsbacka, M., and Rotkirch, A. (2014). Grandparental effects on fertility vary by lineage in the United Kingdom.Human Nature 25(2): 269–284.doi:10.1007/s12110-014-9200-9.
Thomese, F. and Liefbroer, A.C. (2013). Child care and child births: The role of grandparents in the Netherlands. Journal of Marriage and Family 75(2): 403– 421.doi:10.1111/jomf.12005.
Tropf, F.C., Verweij, R.M., Van der Most, P.J., Stulp, G., Bakshi, A., Briley, D.A., Robinson, M., Numan, A., Esko, T., Metspalu, A., Medland, S.E., Martin, N.G., Snieder, H., Lee, S.H., and Mills, M.C. (2016). Mega-analysis of 31,396 individuals from 6 countries uncovers strong gene-environment interaction for human fertility.bioRxiv 44: 49163.doi:10.1101/049163.
Tsay, W.-J. and Chu, C.Y.C. (2005). The pattern of birth spacing during Taiwan’s demographic transition. Journal of Population Economics 18(2): 323–336.
doi:10.1007/s00148-004-0200-7.
UCLA Statistical Consulting Group (n.d.). Factor analysis with categorical (or categorical and continuous) variables [electronic resource]. Los Angeles: UCLA Institute for Digital Research and Education. http://www.ats.ucla.edu/stat/ mult_pkg/faq/general/citingats.htm
Waynforth, D. (2012). Grandparental investment and reproductive decisions in the longitudinal 1970 British cohort study. Proceedings of the Royal Society B:
Biological Sciences 279(1731): 1155–1160.
Zhang, H., Vedder, O., Becker, P., and Bouwhuis, S. (2014). Contrasting between- and within-individual trait effects on mortality risk in a long-lived seabird.Ecology
Appendix
Table A-1: Comparison of respondents who were included or excluded from the study sample based on availability of completed survey waves Included in sample based on missing waves
No Yes N=6,336 4,048 2,288
Means p (t-test)
Age 29.20 32.29 <0.001
Income (personal gross monthly, in Euros) 1,334.79 1,190.47 0.41 Proportions p (χ2 test) Gender
Male 45.39 43.11 0.05
Female 54.37 56.95
Education
Primary school 19.53 10.81 <0.001 VMBO (Junior high school) 15.14 16.46
HAVO/VWO (Senior high school) 11.85 13.13 MBO (Junior college) 25.33 29.85
HBO (College) 18.41 21.23
WO (University) 9.47 8.53
Birth in study period
None 93.85 81.77 <0.001
Yes 6.15 18.23
Parity in first wave
0 60.25 52.49 <0.001
Table A-2: Rotated factor loadings and eigenvalues from exploratory factor analysis
Rotated factor loadings (pattern matrix) and unique variances
Variable Factor1 Factor2 Factor3 Factor4 Factor5 Factor6 Factor7 Factor8 Uniqueness Support
from parents
Relationship quality 0.65 0.31 0.20 0.05 0.16 0.30 0.06 0.00 0.31 Financial help 0.39 0.38 0.54 0.03 0.08 0.01 0.01 –0.01 0.41 Practical help 0.42 0.76 0.16 0.02 0.10 0.01 –0.08 –0.14 0.19 Household help 0.34 0.81 0.19 0.05 0.09 0.03 –0.13 –0.01 0.16 Interest in life 0.85 0.46 0.21 –0.01 0.13 0.06 0.06 –0.04 –0.01 Counsel 0.69 0.44 0.19 0.09 0.40 0.07 0.00 0.00 0.13 Support
for parents
Financial help 0.31 0.41 0.41 0.26 0.07 0.14 0.03 0.03 0.47 Practical help 0.41 0.72 0.09 0.25 0.01 0.10 0.26 0.01 0.17 Household help 0.36 0.78 0.15 0.17 0.07 0.06 0.15 0.13 0.16 Interest in life 0.92 0.27 0.10 0.18 –0.05 –0.01 0.00 0.03 0.04 Counsel 0.65 0.33 0.07 0.48 0.06 0.01 0.02 0.00 0.23 Eigenvalue 3.71 3.37 0.68 0.44 0.24 0.14 0.12 0.04
Table A-3: Proportion of variation in support type that is between subjects (rho) Males Females
Table A-4: Full models of those presented in Table 4
a) Nulliparous males – time × within-family practical support interaction
Random-effects logistic regression Number of obs. = 1,895 Group variable: nomem_encr Number of groups = 450 Random effects u_i ~ Gaussian Obs. per group:
min = 1
avg = 4.2
max = 6
Integration method: mvaghermite Integration pts. = 12 Wald chi2(15) = 33.31 Log likelihood = –202.70766 Prob > chi2 = 0.0042
birth OR Std. Err. z 95% CI
median_f1_emo 2.516927 1.338476 1.74 0.083 0.8875859 7.137249 median_f2_prac 0.7182838 0.246575 –0.96 0.335 0.3665157 1.407666 median_fhelp_tv 1.166071 0.2769426 0.65 0.518 0.732089 1.857316 lmedcen_f1_emo 1.599783 0.8564117 0.88 0.38 0.5602572 4.568091 lmedcen_f2_prac 0.00 0.00 –1.93 0.053 4.81E–14 1.2354 leeftijd 8.877455 4.08187 4.75 0 3.604994 21.86112 c.lmedcen_f2_prac#c.leeftijd 2.632836 1.233687 2.07 0.039 1.050921 6.595953 c.leeftijd#c.leeftijd 0.9672522 0.0066895 –4.81 0 0.9542295 0.9804527 c.lmedcen_f2_prac#c.leeftijd#c.leeftijd 0.9851557 0.0068022 –2.17 0.03 0.9719136 0.9985783 lmedcen_fhelp_tv 1.043217 0.2694016 0.16 0.87 0.6288679 1.730573 motheralive_tv
0 1 (base)
1 0.6793203 0.6018894 –0.44 0.663 0.1196452 3.857037 fatheralive_tv
0 1 (base)
1 0.5654199 0.4658805 –0.69 0.489 0.1124655 2.842646 partner
no 1 (base)
yes 5.607971 2.967595 3.26 0.001 1.987795 15.82122 persinc_1000 1.456988 0.3155976 1.74 0.082 0.952966 2.227586 edu_bi
0 1 (base)
1 0.7532666 0.2506717 –0.85 0.395 0.3923614 1.446143 _cons 1.21E–18 9.80E–18 –5.1 0 1.56E–25 9.37E–12 /lnsig2u –1.04734 3.463586 –7.835843 5.741164
b) Parous females – time × between-family practical support interaction
Random-effects logistic regression Number of obs. = 2,547 Group variable: nomem_encr Number of groups = 582 Random effects u_i ~ Gaussian Obs. per group:
min = 1
avg = 4.4
max = 6
Integration method: mvaghermite Integration pts. = 12 Wald chi2(19) = 79.54 Log likelihood = –340.36288 Prob > chi2 = 0
birth OR Std. Err. z 95% CI
median_f1_emo 0.7749165 0.2181328 –0.91 0.365 0.4463222 1.345431 median_f2_prac 0.4135354 0.1998367 –1.83 0.068 0.1603903 1.066221 ibi 0.7202749 0.1753704 –1.35 0.178 0.446941 1.16077 c.median_f2_prac#c.ibi 1.608999 0.2783591 2.75 0.006 1.146296 2.258473 c.ibi#c.ibi 1.00198 0.0152647 0.13 0.897 0.9725038 1.032349 c.median_f2_prac#c.ibi#c.ibi 0.953963 0.0151123 –2.98 0.003 0.9247985 0.9840472 median_fhelp_tv 0.6418085 0.1482288 –1.92 0.055 0.4081467 1.00924 median_tending_tv 1.099026 0.203001 0.51 0.609 0.7652136 1.578459 lmedcen_f1_emo 0.9432717 0.3113752 –0.18 0.86 0.493917 1.801439 lmedcen_f2_prac 0.87842 0.2559012 –0.44 0.656 0.496284 1.554799 lmedcen_fhelp_tv 0.9019195 0.2143553 –0.43 0.664 0.5660651 1.437041 medcen_tending_tv 1.085593 0.2349539 0.38 0.704 0.7103006 1.659173 motheralive_tv
0 1 (base)
1 1.04306 0.9032955 0.05 0.961 0.1910574 5.694485 fatheralive_tv
0 1 (base)
1 2.644801 2.229633 1.15 0.249 0.5067678 13.80312 partner
no 1 (base)
yes 3.515675 2.295578 1.93 0.054 0.9777152 12.64169 persinc_1000 0.7362338 0.1400409 –1.61 0.107 0.5071151 1.06887 edu_bi
0 1 (base)
1 1.162558 0.2952281 0.59 0.553 0.7067313 1.912382 parity_tv 0.1840702 0.0524756 –5.94 0 0.1052735 0.3218459 age_w1 0.9765195 0.0273148 –0.85 0.396 0.9244245 1.03155 _cons 3.33798 4.646713 0.87 0.387 0.2180464 51.09974 /lnsig2u –1.071354 1.352431 –3.72207 1.579362
c) Parous males – time × between-family childcare interaction
Random-effects logistic regression Number of obs. = 1,559 Group variable: nomem_encr Number of groups = 376 Random effects u_i ~ Gaussian Obs. per group:
min = 1
avg = 4.1
max = 6
Integration method: mvaghermite Integration pts. = 12
Wald chi2(19) = 44.66 Log likelihood = –268.14996 Prob > chi2 = 0.0008
birth OR Std. Err. z 95% CI
median_f1_emo 1.001365 0.3286901 0 0.997 0.52625 1.905428 median_f2_prac 1.241511 0.4341928 0.62 0.536 0.625548 2.464 median_fhelp_tv 0.8585142 0.1960595 –0.67 0.504 0.5487291 1.343188 median_tending_tv 0.7191143 0.2803504 –0.85 0.398 0.3349289 1.543985 ibi 1.097007 0.3419768 0.3 0.766 0.5954692 2.020969 c.median_tending_tv#c.ibi 1.284419 0.1983715 1.62 0.105 0.94895 1.738482 c.ibi#c.ibi 0.9841795 0.0199353 –0.79 0.431 0.9458725 1.024038 c.median_tending_tv#c.ibi#c.ibi 0.9701026 0.0135339 –2.18 0.03 0.9439361 0.9969945 lmedcen_f1_emo 0.6338064 0.2387446 –1.21 0.226 0.3029164 1.326143 lmedcen_f2_prac 2.047823 0.7285406 2.01 0.044 1.019685 4.112622 lmedcen_fhelp_tv 0.818227 0.2104874 –0.78 0.435 0.4942012 1.354702 medcen_tending_tv 0.944963 0.2317124 –0.23 0.817 0.5843775 1.528045 motheralive_tv
0 1 (base)
1 0.8189311 0.5604669 –0.29 0.77 0.2141386 3.131841 fatheralive_tv
0 1 (base)
1 1.976512 1.116989 1.21 0.228 0.6529182 5.98329 partner
no 1 (base)
yes 1.889017 1.131082 1.06 0.288 0.5842033 6.108124 persinc_1000 0.7615085 0.1683554 –1.23 0.218 0.4937303 1.174518 edu_bi
0 1 (base)
1 1.353334 0.4130624 0.99 0.322 0.7440507 2.461542 parity_tv 0.3217515 0.099908 –3.65 0 0.1750699 0.5913296 age_w1 0.9824434 0.0308991 –0.56 0.573 0.9237111 1.04491 _cons 0.3696922 0.6130836 –0.6 0.548 0.0143298 9.537638 /lnsig2u –0.687529 1.411178 –3.453387 2.078329 sigma_u 0.7090959 0.5003302 0.1778716 2.826854
d) Parous females –time × between-family childcare interaction
Random-effects logistic regression Number of obs. = 2,547 Group variable: nomem_encr Number of groups = 582 Random effects u_i ~ Gaussian Obs. per group:
min = 1
avg = 4.4
max = 6
Integration method: mvaghermite Integration pts. = 12
Wald chi2(19) = 75.22 Log likelihood = –337.26327 Prob > chi2 = 0
birth OR Std. Err. z 95% CI
median_f1_emo 0.8273144 0.2380119 –0.66 0.51 0.4707458 1.453967 median_f2_prac 0.9839414 0.2899416 –0.05 0.956 0.5522587 1.753056 median_fhelp_tv 0.6154473 0.1453055 –2.06 0.04 0.3874579 0.9775912 median_tending_tv 0.6757393 0.219007 –1.21 0.227 0.358018 1.275421 ibi 0.9330064 0.2139298 –0.3 0.762 0.5952672 1.46237 c.median_tending_tv#c.ibi 1.437827 0.1943041 2.69 0.007 1.103259 1.873854 c.ibi#c.ibi 0.9915533 0.0143875 –0.58 0.559 0.9637516 1.020157 c.median_tending_tv#c.ibi#c.ibi 0.9527156 0.0138356 –3.34 0.001 0.9259807 0.9802225 lmedcen_f1_emo 0.9319166 0.306035 –0.21 0.83 0.4896078 1.773805 lmedcen_f2_prac 0.8722604 0.2574797 –0.46 0.643 0.4890831 1.555642 lmedcen_fhelp_tv 0.9038184 0.2185212 –0.42 0.676 0.5627059 1.451713 medcen_tending_tv 1.074305 0.2348181 0.33 0.743 0.6999623 1.648847 motheralive_tv
0 1 (base)
1 1.074333 0.9600013 0.08 0.936 0.1864333 6.190911 fatheralive_tv
0 1 (base)
1 2.67098 2.293867 1.14 0.253 0.4961914 14.37778 partner
no 1 (base)
yes 3.320596 2.193645 1.82 0.069 0.9096976 12.1209 persinc_1000 0.7191331 0.1392952 –1.7 0.089 0.4919631 1.051202 edu_bi
0 1 (base)
1 1.175409 0.3043417 0.62 0.533 0.7076079 1.952476 parity_tv 0.1733669 0.0510928 –5.95 0 0.0972992 0.3089037 age_w1 0.9802792 0.0279215 –0.7 0.484 0.9270535 1.036561 _cons 1.414051 1.987789 0.25 0.805 0.0899283 22.23484 /lnsig2u –0.8670501 1.167403 –3.155119 1.421018 sigma_u 0.6482201 0.3783671 0.2064784 2.035027
Figure A-1: Predicted raw levels of support in the two years before and after a birth (birth=year 0) for males and females who had a first birth while under observation
Males