ASSESSING THE VALUE OF A HIGH SCHOOL MENTORING PROGRAM
by Janet L. Downs
A dissertation
submitted in partial fulfillment of the requirements for the degree of
Doctor of Education in Curriculum and Instruction Boise State University
DEFENSE COMMITTEE AND FINAL READING APPROVALS
of the dissertation submitted by
Janet L. Downs
Dissertation Title: Assessing the Value of a High School Mentoring Program Date of Final Oral Examination: 07 March 2010
The following individuals read and discussed the dissertation submitted by student Janet L. Downs, and they evaluated her presentation and response to questions during the final oral examination. They found that the student passed the final oral examination.
Scott Willison, Ph.D. Chair, Supervisory Committee Kenneth Coll, Ph.D. Member, Supervisory Committee William Parrett, Ph.D. Member, Supervisory Committee Roger Stewart, Ph.D. Member, Supervisory Committee
DEDICATION
ACKNOWLEDGEMENTS
I thank the four members of my doctoral committee: Scott Willison (chair), Roger Stewart, Bill Parrett, and Ken Coll. They have been patient, thoughtful, and supportive throughout this process. I am particularly indebted to Roger Stewart, who has been a caring mentor, a helpful statistician, and an outstanding advisor.
ABSTRACT
School-based mentoring programs have recently emerged as a potential method to improve pro-social behavior, academic success, resiliency, a sense of school
connectedness, and reduce at-risk behaviors and drop-out probability among youth. This action research study surveyed 142 students to assess changes in student attitudes
associated with implementing the first year of a sophomore mentoring program at a semi-urban high school in the northwestern United States. The mentoring program was called the Pathfinder program, a youth-to-youth group mentoring program developed and marketed by Varsity Gold Leadership, Inc. The extent of influence the Pathfinder
TABLE OF CONTENTS
DEDICATION ... iii
ACKNOWLEDGEMENTS ... iv
ABSTRACT ... vi
LIST OF FIGURES ...x
CHAPTER ONE: INTRODUCTION ...1
Research Questions ...7
Limitations ...7
Delimitations ...8
CHAPTER TWO: REVIEW OF LITERATURE ...9
Mentoring Defined ...9
Mentoring Programs: Purpose and Focus ...13
The Need for Mentoring ...14
Mentoring Research ...17
Individual Pairings Using Adults in Community Settings ...18
Individual Mentoring Using Primarily Adults in School-Based Settings ...21
Individual Mentoring Using Primarily Cross-Age Peers in School-Based Settings ...26
Background Characteristics ...35
Student Behaviors ...40
School Practices ...49
Contextual Variables ...56
CHAPTER THREE: METHODOLOGY ...65
The Pathfinder Program ...65
Pathfinders Mentors ...66
Sophomore Mentees...67
Survey Development ...67
Role of the Researcher ...69
Demographic Characteristics ...70
The Population ...70
The Pathfinder Mentors ...71
The Sample of Respondents...71
Data Analysis ...72
Ethical Considerations ...75
CHAPTER FOUR: DATA ANALYSIS ...77
Factor One: The Pathfinder Program ...77
Factor Two: Teacher Reinforcement ...78
Factor Three: Academic Motivation Factor ...79
Factor Four: Student Perception of School Climate Construct ...104
Application of Current Research to This Study ...142
Infrastructure: Training, Support, and Supervision ...143
Program Practices: Focus, Matches, Frequency and Duration of Meetings ...146
Limitations to This Research ...149
Conclusions ...150
Recommendations ...152
REFERENCES ...154
APPENDIX 1 ...181
Pathfinder Program: Teacher Referral APPENDIX 2 ...183
Pathfinder Mentor Application and Consent Form APPENDIX 3 ...185
Pathfinder Mentor Congratulations APENDIX 4 ...187
Parent Consent Form APPENDIX 5 ...192
Pathfinder Mentor Experience Survey APPENDIX 6 ...195
Sophomore Pathfinder Mentor Experience Survey APPENDIX 7 ...200
Pathfinder Lesson Plan: Gossip
APPENDIX 9 ...207 Pathfinder Lesson Plan: Diversity
APPENDIX 10 ...210 Pathfinder Lesson Plan: Honesty
APPENDIX 11 ...213 Pathfinder Lesson Plan: Conflict Management
APPENDIX 12 ...216 Pathfinder Lesson Plan: Respect
APPENDIX 13 ...219 Psychological Sense of School Membership Scale
APPENDIX 14 ...222 The School Connection Scale
APPENDIX 15 ...224 Advisory Program Survey
LIST OF FIGURES
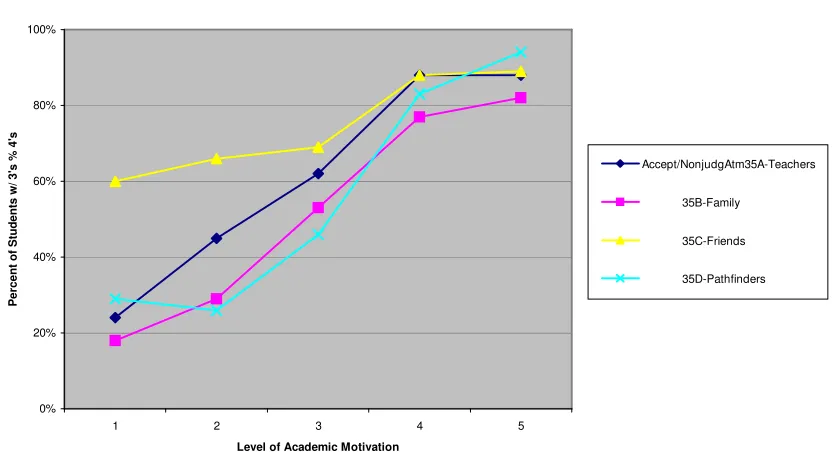
Figure 1. Level of Academic Motivation ...80
Figure 2. Sense of Belonging ...83
Figure 3. Northwest High Pride ...86
Figure 4. Desire to Remain ...88
Figure 5. Belief in Nonjudgemental Atmosphere ...91
Figure 6. Desire to Graduate from NHS ...94
Figure 7. Motivation to be a Good Student ...97
Figure 8. Belief I Can Be Myself ...99
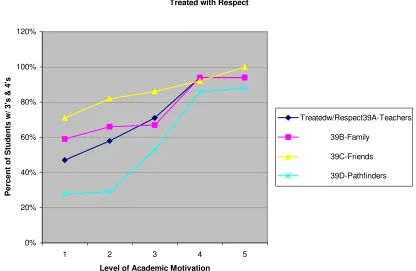
Figure 9. Treated with Respect ...102
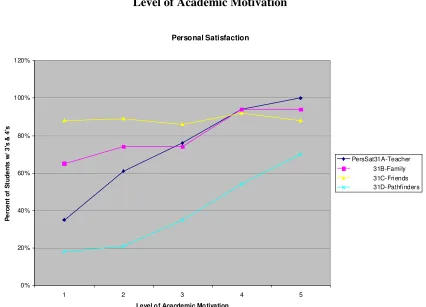
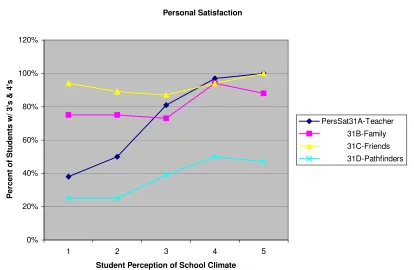
Figure 10. Personal Satisfaction ...106
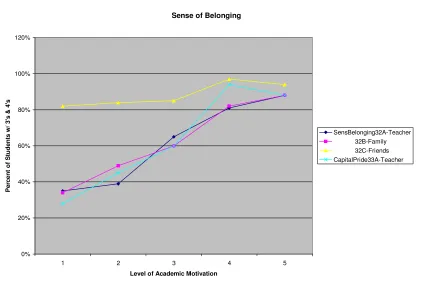
Figure 11. Sense of Belonging ...109
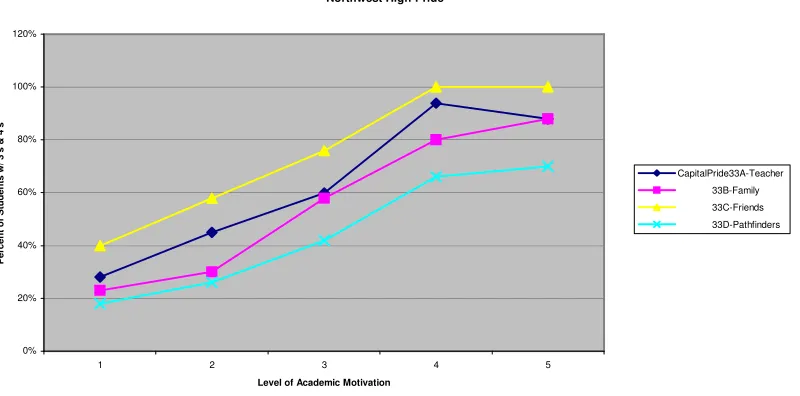
Figure 12. Northwest High Pride ...112
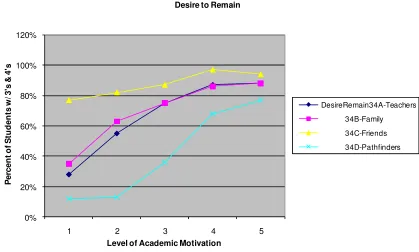
Figure 13. Desire to Remain at NHS ...115
Figure 14. Accepting and Nonjudgmental Atmosphere ...118
Figure 15. Northwest High Graduate ...121
Figure 16. Good Student Motivation ...124
Figure 17. I Can Be Myself ...127
CHAPTER ONE: INTRODUCTION
progress in graduation rates from 2002 to 2010. After eight years, white youth graduation rates remained at 78%, and African-American and Latino graduation rates varied slightly at 54% and 56% respectively.
The dropout problem is so severe in some parts of the country that their schools have been labeled “dropout factories”. Balfanz, Bridgeland, Moore, and Fox (2010) define “dropout factory” schools as those in which the senior class is made up of 60% or fewer of the students who entered as freshman. These schools produce half of the
nation’s dropouts annually. Although Balfanz et al. (2010) report a 13% decline in dropout factory schools from 2002 to 2008, there are still 1.700 dropout factory schools in our nation. The number of dropout factories varies by geographic region, with the South having as many as three times more dropout factories than any other region.
According to NCES (2009), the average 2007-2008 graduation rate in the Pacific Northwest, the region in which this study takes place (Alaska, Washington, Oregon, Idaho, and Montana), was 74.7%. In the Northwest, whites have a graduation rate of 80%. However, the graduation rates for some ethnic groups are much lower:
Hispanics=64%, Blacks=59% and American Indians=64%.
following percentages of dropouts for the state of Idaho during school year 2006-2007: Whites=2.28%, Blacks=2.45%. Hispanics=5.16%, and Native Americans=3.89%.
The school I researched, Northwest High School, is located in the Northwest School District. The district serves 25, 000 students and has 3,900 employees, 1,700 of whom are certified. The Idaho State Department of Education, ISDE, reports the following dropout percentages for the Northwest School District during the 2007-2007 school year: Whites=2.43%. Blacks=3.33%, Hispanics=7.57%, and Native
Americans=4.26%. However, in a report commissioned by the United Way of Treasure Valley, the dropout rate for 10 schools districts in the valley from 2004 to 2008 was reported at 11.4% (Gallant, 2010). The district I studied, Northwest school district had a four-year cumulative dropout rate of 10.7%.
Dropping out has serious consequences, both for the individual and society at large. Harlow (2003) reports that 75% of state prison inmates dropped out of high school and Catterall (1985) reports that dropouts are 3.5 times more likely to be incarcerated than graduates. According to Barton (2005), the earning power of dropouts has been in steady decline over the last thirty years. According to Amos (2008), dropouts are less likely to have health insurance, receive less medical care, and have worse health
compared to 9.4% of high school graduates and 4.7% of college graduates. Amos (2008) also found that, over the course of a lifetime, a single dropout costs the nation about $260,000.
A number of factors contribute to the likelihood a student may drop out. Researchers have identified factors ranging from socioeconomic conditions, school practices, and individual student characteristics as contributing to the probability
students’ dropout. Land and Letger (2002) found the following variables put students at-risk: being culturally diverse and living in poverty, having limited English proficiency, having parents with less than a high school education, and living with a single parent. Hammond, Linton, Smink, and Drew (2007) reviewed 44 studies to identify the risk factors associated with dropping out and identified which factors contributed to the likelihood of students discontinuing their education. The factors they identified are: students who have a learning disability or emotional disturbance, have a high number of work hours, belong to a high-risk peer group, engage in high-risk social behavior, are socially active outside of school, are over-age for grade, have low educational
expectations, lack effort, do not participate in extracurricular activities, are aggressive, live in poverty, have parents with low educational attainment, have a large number of siblings, are not living with both natural parents, have siblings who have dropped out, and live in families that do not converse about school.
students, aged 16 to 24, who had dropped out of high school. They found that only 41% of these dropouts felt they had someone in school to talk to about personal problems. Altenbaugh, Engel, and Martin (1995) interviewed 100 students who dropped out of high school and were surprised at the importance of caring.
What appeared eloquent in earlier and later interview transcripts was the importance of caring, or more to the point, we observed a lack thereof. As one student declared: “Nobody gave a damn”. Here it should be noted that lack of caring was not attributed to the school environment and school personnel alone. Apparently, “nobody gave a damn” about these students outside the school – at home, in the neighborhood – as well as in school (p. 156).
Despite almost 30 years of educational reform, the dropout rate has changed very little. However, as my review of the literature will demonstrate, mentoring has been found to be an effective strategy in preventing dropouts. Assuming dropping out is at least partially a reflection of school alienation; we need to know what constitutes mentoring and how to use it as a vehicle to let students know they are cared for and about. Casey and Shore (2002) provide a working definition for our purposes, describing mentoring as simply “a learning partnership between two or more persons who wish to share and develop a mutual interest.” (p. 12)
studies of mentoring are based on a one- to-one relationship between an adult and an at-risk youth in a community setting. This study is based on a peer mentoring model utilizing group mentoring in a school setting. Most studies of mentoring are based on results after one to three years, whereas this study is measuring potential change across a nine-month period. This study is also needed in that most studies of the effects of mentoring assess its’ value based on matches spending between one to four hours
together every week. This study assesses the value of mentoring based on 45-55 minutes together each month. Furthermore, the study is needed because it focuses on a previously unresearched mentoring program, Pathfinders from Varsity Gold Leadership.
According to the Pathfinder Coordinator Handbbook (2006),
VG Leadership exists to give students the tools and resources to be successful. That’s it, plain and simple. We believe that when we communicate to young people that they are valued and significant, and combine that with intentional efforts to reflect that message, then curiosity is stirred, defenses are lowered, and openness is enhanced. The pursuit of this goal has led VG Leadership to the place where students spend the majority of their time- your school. VG Leadership began creating and offering programs to help schools invest in and build up lives of their students and to benefit from a system that is tried and true.
Leadership to design and polish a program that assists schools in the challenge to effectively connect students to their schools. (p. 7)
Varsity Gold declared bankruptcy on March 4, 2009. As of that date, VG Leadership and the Pathfinder program ceased to exist.
Research Questions
The specific research questions addressed by this study are:
1. To what extent does implementation of a sophomore mentoring program influence sophomore students’ perception over a period of one school year regarding school satisfaction, sense of belonging, academic achievement, and desire to graduate from high school?
2. If sophomore students’ perception, over a period of one school year, of school satisfaction, sense of belonging, motivation to be a good student, and desire to graduate does change, how does the mentoring program’s influence compare to other spheres of influence?
Limitations
It will not be possible to control for all the variables that influence the participants. Therefore, the study is limited by the following:
1. psychological factors such as intrinsic motivation and emotional factors of the participants;
3. environmental factors such as temperature, humidity, weather, and time of day.
Delimitations
The ability to generalize the results of this study is limited by:
1. Students were included from one school in the Northwest and the findings are limited to those students only.
2. Only certain subgroups of the student population were studied and generalizations should not be made to other subgroups or populations. 3. The results of this study are based on a specific mentoring program and
CHAPTER TWO: REVIEW OF LITERATURE
Mentoring Defined
Although the length, nature, frequency, and purpose of the relationship may vary, the concept of mentors and mentoring can be found in the literature from many fields. Such diverse interests as art and music, business, community advocacy programs, education and science have invested in the concept of mentoring. In the field of
education; mentors have been used to support beginning administrators and teachers, first year graduate students, college freshmen, gifted and talented students, regular students entering a transition phase, at-risk students, and special needs students.
As previously mentioned, Homer’s Odyssey is often credited with the origin of the term mentor (Edlind & Haensly, 1985; Casey & Shore, 2002), in which Ulysses left his son, Telemachus, to the care and guidance of his wise friend, Mentor, during his 10 year journey. According to Freedman (1993), examples of mentoring in the United States date as far back to the late 1900’s when the Friendly Visiting Campaign enlisted
individual with less experience manifested through advisement, sponsorship, or friendship.
O’Neil (1981) broadened the definition of mentoring to include a mutually beneficial relationship between the mentor and mentee. In 1990, the federal government reauthorized the Juvenile Justice Delinquency Prevention Act (JJDPA) of 1972, which defines mentoring as a one-to-one relationship that provides guidance to at-risk youth (JJDPA, Part G). As amended in 1992, this act established a new mentoring program to combat the increase in juvenile crime. The goals of this program, The Juvenile Mentoring Program (JUMP), were reducing delinquency and gang participation, improving
academic performance, and reducing school dropout rates.
Several years later, the California Mentor Resource (1996) provided the following definition of mentoring:
Mentoring is a one-to-one caring, supportive relationship or partnership between a mentor and a mentee based on trust. This relationship focuses on the needs of the individuals and encourages them to develop to their fullest potential based on their own vision of the future. (p. 3)
Indeed, mentoring is often defined as a sustained relationship between a young person and an adult in which the adult provides the young person with support, guidance, and assistance. The very foundation of mentoring is the idea that if caring, concerned adults are available to young people, youth will be more likely to become successful adults themselves. (pp. 1-2)
In referring to school-based mentoring programs, Alkin and Ellet (2004) describe them as “a one-to-one teacher-student relationship occurring during regular school hours, using specific mentoring behaviors for the purposes of improving student academic success, increasing attendance, and improving the quality of student-child relationships.” (p. 24)
Several sources offer broader definitions of mentoring which are applicable to this project. Clinton (2002) states “mentoring is a relationship between two individuals of different ages that is formed to support the younger person through some aspect of development over a period of time.” (p. 1) As mentioned in Chapter One, Casey and Shore (2002) provide a working definition for our purposes, describing mentoring as simply “a learning partnership between two or more persons who wish to share and develop a mutual interest.” (p. 12)
more than three million children in fifty states. MENTOR promotes research, raises money, obtains grants, and tracks outcomes through its’ online database. MENTOR maintains the National Mentoring Institute, a clearinghouse of information and products about mentoring. MENTOR recognizes the value and importance of trust in a mentoring relationship. They believe mentors are good listeners and caring people who help young people recognize their assets. They also contend “mentors are not foster parents,
therapists, parole officers, or cool peers.” (p. 1) According to Boyle (2006), Michael Garringer, of the Northwest Regional Education Laboratory, states it even more emphatically:
If a program is going to call itself a mentoring program, then mentoring better be the primary service they offer and their matches better be developmentally focused. You can work on grades, getting into college, staying off drugs and out of gangs…But if the relationship itself isn’t the primary focus of your agency’s work, then stop talking about yourself as a mentoring program. You’re doing something else using adults to help youth (and God bless ya), but it ain’t mentoring. (p. 4)
The U.S. Department of Education Mentoring Program’s Guide to Initial Training of Volunteers, Youth, and Parents: Preparing Participants for Mentoring (Cannata,
According to that source, (peer) mentoring is not “evaluative, hierarchical, judgmental, prescriptive, or a quick fix.” (p. 1).
Mentoring Programs: Purpose and Focus
Miller (2002) defined several types of mentoring in his book, Mentoring Students and Young People that are relevant to this study.
Cross-age mentoring is when mentors are drawn from a different age group to mentees.
Group mentoring or small-group mentoring is when the mentor is matched with two or more students (usually up to a maximum of between four and six).
Peer mentoring literally means mentoring by equals, but usually refers to people with the same status, i.e. teacher-teacher or student-student pairings.
Peer Group mentoring is a form of natural mentoring when groups of friends explore an issue together, often involving risk behavior.
Site-based mentoring is when the location of the meetings is within the educational institution, rather than community-based mentoring.
Structured mentoring or planned mentoring or intentional mentoring is when a third party organizes the mentoring relationship in contrast with natural mentoring.
School-led mentoring is where the school sets goals, targets, and processes that pairs are expected to follow.
Team mentoring refers to the situation when two or more people mentor a young person.
Transition mentoring describes mentoring programs that target young people during times of transition, e.g. transfer from primary to secondary school, from secondary school to college, or from school or university to employment. (pp. 270-273)
The Need for Mentoring
Mentoring has been directed toward a variety of youth, including: gifted and talented students, special needs students, at-risk students, and regular students in a transition phase. According to MENTOR’s publication The National Agenda for Action: How to Close America’s Mentoring Gap (Boisi, Saban, Schwartz, & Manza, 2006), 3 million young people benefit from mentoring. That organization indicates that’s a six-fold increase in the number of mentors from the early 1990’s to now. However,
General Colin L. Powell, founding chairperson of America’s Promise Alliance recognizes 15 million at-risk youth in need of mentoring, who they categorize at risk of dropping out of high school. According to that source, “That’s not a problem, that’s a crisis.” (p. 1) The Every Child, Every Promise: Turning Failure Into Action (2006) report indicates one-third of teens and 20% of younger children, approximately 8.5 million young people, lack quality relationships with their parents or other caring adults. Over 40% of youth ages 8-21 say they want more people in their lives to whom they can turn to for help. This study contends only 8% of young people ages 6 to 17 have a formal mentor. In failing to provide the children of our nation with the “Five Promises: caring adults, safe and constructive use of time, healthy start and healthy development, effective education for marketable skills and lifelong learning, and opportunities to make a
difference through helping others” (p. 3), they contend “ It is not our children who are failing, it is we who are failing them.” (p. 7)
The need for mentors is very acute among at-risk male students, specifically those of Hispanic and African-American ethnicity. Females are more likely to volunteer as mentors than males (Rhodes, 2002). Thus, there is a tremendous shortage of male mentors. This is particularly true for males of ethnic minorities, whose dropout rates far exceed those of whites.
relationships.” (p. 1) She and her staff developed a character development program called Teach One to Lead One (T1L1). T1L1 has been implemented in 20 states, as well as Cape Town, Africa. It has been adapted to target students on probation through the Juvenile Court system, as well.
MENTOR created the National Agenda for Action: How to Close America’s Mentoring Gap (Boisi et. al., 2006) to bring attention to bear on this issue. They have developed a series of 21 action steps they hope to introduce to community leaders in every sector. MENTOR has joined forces with the Corporation for National and
Community Service to co-facilitate a Mentoring Working Group whose goal is to recruit an additional 3 million mentoring relationships by 2010.
Even the Super Bowl is a venue for the promotion of mentoring. CBS, the NFL, and Big Brothers Big Sisters created a 15 second public service announcement to air on February 4th, 2007 during Super Bowl LCI. It featured Indianapolis Coach Tony Dungy and Chicago Bears Coach Lovie Smith, whose teams opposed each other in the game. However, their heartfelt message was powerful for Dungy, who considers Smith as his mentor and the two talk every week. Hopefully, this message struck home to some of the roughly 90 million viewers tuning in to the Super Bowl.
2007, when she urged 1,000,000 more volunteers to become mentors. Winfrey (Oprah’s Call to Action, 2008) donated 1 million dollars to undergird its’ mission.
The Federal Government has also responded to the need with strong support of mentoring. Congress allocated $100 million in funding to benefit mentoring
organizations in 2008. This appropriations bill delivered $50 million for the Mentoring Children of Prisoners program and restored another $50 million to the Department of Education’s mentoring fund. In Proclamation 8212, (Woolley & Peters, 2007) President George W. Bush proclaimed January 2008 as National Mentoring Month. He stated,
To raise awareness of the challenges facing our youth and encourage adults to connect with young people through family, school, and community, First Lady Laura Bush is leading the Helping America’s Youth initiative. Through the USA Freedom Corps, we are connecting individuals with volunteer opportunities, including mentors who work with young people in schools and community organizations. By encouraging Americans to mentor, we are doing our part to see that more of America’s children grow into strong, confident, and successful adults. (p. 1)
Mentoring Research
over a year, because it is the most traditional type of mentoring. However, mentoring has branched out to include other types of mentoring, as well. Recent research has also been conducted on school-based (rather than community-based) programs, on group (rather than individual) relationships, and on peer (rather than adult-youth) pairings.
Individual Pairings Using Adults in Community Settings
Morrow and Styles (1995) studied 82 matched pairs, supervised by eight agencies, in the BBBS program over a 9 month period. They researched pairs that had been meeting at least 4 months and not more than 18 months. The LB’s and LS’s were aged from 10-15 years of age, with a mean of 12. They found the matches naturally sorted themselves into two categories: prescriptive versus (vs.) developmental. While prescriptive relationships focused on transforming the youth’s values, attitudes, or behaviors through adult-directed activities, the developmental relationships focused on youth enjoyment and negotiated activities in which youth had a voice. They found while 50/54 developmental matches were considered successful, 20/28 of the prescriptive matches were either problematic or terminated. They also learned that successful matches led to perceived improvements in scholastic competence and fewer unexcused absences from school.
A study by Rhodes, Grossman, and Resch (2000) used longitudinal data from the Tierney and Grossman (2000) study of BBBS. It focused on the role improvements in perception of parental relationships played in the value that adolescents placed on school. They found “mentoring led to improvements in five of the six hypothesized mediator and outcome variables” (p. 1666). It led to improvement in parental relationships, school value, perceived school competence, grades, and attendance. They concluded mentoring can have a positive influence on adolescents’ cognitive and behavioral domains regarding school.
school students involved in the program in the fall of 1993. The students recruited to this program were middle-achieving students (mostly B’s and C’s, no D’s or F’s) who met the federal guidelines for free and reduced lunch. The mentors averaged 45 years old,
predominately white, and did not have children living at home. Mentors committed to being involved with their mentees for five years, contacting them as often as once a week to as rarely as once a month. The experimental group was matched to a control by
G.P.A., gender, and ethnicity. The main objective of the program was college enrollment. The SAS program provided mentoring, academic assistance, college application and financial aid help, a summer program, cultural enrichment, and six thousand dollars in financial aid to each student. Johnson (1997) found the SAS program had a significant positive impact on G.P.A. for 10th and 11th, but not for 12th, grade students. She also found SAS participants were significantly more likely to engage in college-preparation activities, and almost 3 times more likely to attend college. Her data did not reveal SAS participation had a significant impact on students’ self-esteem. She found that mentors who contacted or saw their mentees at least once a week, who knew the student’s family, and who had a good quality relationship with their mentee were significantly more likely to have higher G.P.A.’s in 10th and 11th grade, and to enroll in college.
population: 32% Caucasian, 24% African American, 37% Latino, 3% Asian, and 3% as “other.” They were assessed on several measures of well-being using a pre and post-test design: mothers and teachers completed the Child Behavior Checklist, and youth
completed the Hopelessness Scale for Children, the Piers-Harris Self-Concept Scale, and the Self-Report Delinquency Scale. After 6 months of mentoring, there were significant changes on four of the seven measures in the in intervention group. Intervention group members reported significantly fewer acts of self-reported delinquency, mothers reported significantly decreased internalizing behaviors, teachers reported significantly decreased externalizing behaviors at school, and problem behaviors at school were lower by one standard deviation. Levels of hopelessness and self-esteem were not significantly impacted.
Individual Mentoring Using Primarily Adults in School-Based Settings A study by King, Vidourek, Davis, and McClellan (2002) assessed the
effectiveness of the Healthy Kids Mentoring Program, a program that matched 28 at-risk 4th grade students with mentors across a 5 month period. Students were pre and post-tested for the program using a 55-item survey to measure their self-esteem; their school, peer, family connectedness; and their involvement in risky behavior. Students chosen for Healthy Kids met at least one of the following conditions; had self-esteem scores at least one standard deviation below the group mean, had engaged in two or more risky
classes in the first quarter of 1999. Mentors varied in age. They met on school grounds twice a week for 1-1/2 hours each session. During each session, mentors devoted some time to the four components of the program: self-esteem enhancement, relationship building, goal setting, and academic assistance. Results indicated significant
improvement in self-esteem, and connectedness to school, family, and peers. They were also significantly less likely to have engaged in bullying or fighting with a peer.
Participants were significantly less likely to have felt depressed and significantly more likely to talk to an adult if they had a problem. Seventy-one percent of students in Healthy Kids improved academic achievement by at least one letter grade from first to fourth quarter of 1999.
more social activities and communicated more closely with their mentee’s family.
Herrera et.al. (2000) found school-based mentors are more likely to represent a wider age span and be more ethnically diverse than community-based mentors. School-based mentors are more likely to be supervised and spend less time with their mentees. While more community-based mentors (45%) reported feeling “very close” to their mentees than their school-based counterparts (32%), over 90% of both sets reported feeling “close” to their mentees. The authors also identified eight factors that are important components of both types of programs: social activities, academic support, amount of time spent together, shared decision-making, adequate pre-match training, adequate post-match training and support, quality of the post-match, and age of the mentee. Interestingly, ethnic similarity and same gender was found to be less a factor than shared interests. Also, mentors reported feeling closer to youth in elementary school than those in middle or high school.
about half had children and three quarters were white. Most (70%) spent ½ to 1 hour a week with their mentees, with the rest spending 1 to 2 hours a week with their mentee. Half of the races were cross-race, with 11% cross-gender. Herrera (2004) compared results from matches meeting 6 months or less, 6 to 9 months, and over 9 months. She found significant improvement in ability to make friends and in social skills in matches who met 9 months or longer. She found slight improvements in the number of discipline referrals and the degree of “school liking” in the matches lasting over 9 months. She found little evidence that SBM improves attendance or academic achievement. Disconcertingly, Herrera (2004) found matches meeting 6 months or less worsened in ability to make friends, social skills, classroom behavior, and academic achievement. Portwood, Ayers, Kinnison, Waris, and Wise (2005) evaluated YouthFriends, a SBM program serving 170 students in 3 states across 5 school districts, and pairing them with a caring adult for approximately an hour a week over a period of at least eight months. These students were compared to a matched control group. In the experimental group, 62% were in elementary school, 22% in middle school, and 13% in high school, while 52% were female and 48% were male. Of those students who reported ethnicity, 79% were white, 14% were African American, and 2% were Indian. Portwood et al. (2005) assessed YouthFriends in respect to their values, attitudes, and/or beliefs on eight areas: substance abuse, substance use, school attitude, school performance, school
questionnaire from 13 sources to evaluate their outcome measures. They found
YouthFriends students scores significantly higher than their matched controls on sense of school membership. However, no significant differences were detected in the other measured variables. Among the experimental group, further analysis revealed statistically significant improvements among those students designated at-risk, when compared to those not at-risk, in all areas except self-concept.
Herrera, Grossman, Kauh, Feldman, McMaken, and Jucovy, (2007) estimated BBSS was serving about 126,000 students nationwide in SBM programs. They undertook a study of 10 agencies in 10 different states, involving more than 70 schools in grades 4 through 9, and 1,139 students (half of whom were assigned to a control group). The youth were surveyed at 3 points: fall 2004, spring 2005, and winter 2005. Mentors were
assignments turned in, and discipline referrals. Youth reported feeling more supported and cared for, more confident about school, and skipping less. Herrera et al. (2007) did not find any improvement in substance use, misconduct outside of school, self-esteem, or relationships with others. They also found improvements in the first year were hard to sustain at 15 months, with the exceptions of being less likely to skip school, more confident they would attend college, and maintaining a caring relationship with a non-parental adult.
Lampley and Johnson (2010) evaluated a mentoring program called LISTEN (Linking Individual Students To Educational Needs) involving 54 students in a middle school chosen based on meeting one or more of three criteria: failing one or more school years, obtaining 10 or more discipline referrals in a year, or having 10 or more unexcused absences in a year. They ranged from 11 to 15 years of age and 64% were male. No ethnicity was reported. The mentors were teachers, counselors, administrators, librarians, custodians, cafeteria workers, teaching assistants, and librarians. They met with their mentees twice a week, for an unspecified amount of time. Data was collected every six weeks on attendance rates, disciplines referrals, and G.P.A.’s. A significant improvement was found for all 3 measures: 94% of the students improved their grades, 94% had fewer discipline referrals, and 96% improved their attendance.
Society. She brought together 3 agencies to solve their individual problems: a feeder school area experiencing higher than normal dropout rates, a long waiting list with few volunteers for the BBBS program, and few community collaboration opportunities for students in an undergraduate social work program. High school juniors and seniors were given an opportunity to register for a credit bearing course to mentor elementary students from the targeted dropout zone, while undergraduate students were given the chance to register for an independent study class in which they would train the high school mentors and evaluate the program’s effectiveness. No information on gender or ethnicity was provided. The Big Buddies were trained at their high schools every day for three weeks before they were matched, then Mondays, Wednesdays, and Fridays thereafter. They met with their Little Buddies at the elementary school Tuesday and Thursdays. The training sessions had 4 parts: warm-up, training topic, trouble-shooting, and closure. The
mentoring sessions had 4 parts, as well: relationship building, tutoring, reinforcement activity, and discussion. The evaluation used a pre and post-test design. The Little Buddies were evaluated on 3 instruments designed to measure self-esteem, school attitude, and classroom behavior. The Big Buddies were evaluated on 2 instruments designed to measure self-esteem, and other-directedness. They did not find a statistically significant improvement in any area. However, concluding interviews with the Big Buddies revealed they all reported increased interest in volunteer work.
63% were male and 36% were female. Among the control group, 50% were of each gender. They were all Caucasian. The mentors were recruited by announcements and the majority (61%) were sophomores or juniors. Ninety-four percent were Caucasian. Mentors and mentees self-selected each other after a six-hour orientation, with 90% of mentees receiving their first or second choice. Mentoring was conducted for two hours twice a week, at the middle school. Each session included an icebreaker, a connectedness activity, a snack, and a group game. Both sets of youth were rated by instruments
designed to measure at-risk status, connectedness, self-esteem, and social and school competence. This study found significant gains in parental and school connectedness after six months of mentoring. Karcher (2005) found attendance was a significant influence on mentee’s social skills and self-esteem.
length and quality to those with adults. However, high school Bigs were less consistent than adults in attending meetings with their mentors. Although Littles matched with adult mentors performed better than their non-mentored peer in 12 of the 31 areas assessed, those matched with high school Bigs only improved in the area of social acceptance. They also found high school Bigs who had higher-quality training lasting at least two hours reported closer relationships with their Littles and were more likely to have longer relationships with their Littles.
Karcher (2009) compared changes in connectedness, attachment, and self-esteem, using three instruments designed for these purposes, between mentors from the previous study and a matched control group. Using a pre and post-test design, Karcher (2009) found that youth who participated in the cross-age mentoring program (CAMP) reported greater gains in school connectedness and self-esteem than a control group of their peers. In contrast, he found no difference in family-related measures between the two groups.
Group Mentoring in Primarily School-Based Settings
school students) and the Be-A-Friend program of BBBS (which assigned paid staff to mentor small groups of students). The researchers visited each program, interviewed program and school staff, conducted in-depth interviews with 52 mentees and 19
mentors, and did a focus group with an additional 12 mentees. The groups ranged in size from 2 to 32 members, with an average of 10 mentees in a group. They met in a variety of settings, most commonly in schools, for an average of 21 hours a month. They found group mentoring attracts more low-income, more women and African-American, older and less well educated, and more retirees than individual mentoring programs. They found group mentoring focused on more youth from ethnic and racial minority groups, particularly African-American. Herrera et al. (2002) noted the central goal of group mentoring was to focus on improving social skills and strengthening peer relationships, rather than fostering a close personal relationship between mentors and mentees. Unlike community based programs in which parents are the primary referral source, group mentoring participants are frequently referred by their teachers and recruited by their peers. Although only twenty-one percent of youth and mentors reported feeling “very close”, more than half (57%) of the mentees reported feeling ‘somewhat close” to their mentors. The vast majority of youth did not indicate a preference for one-to-one
revealed perceived improvements in social skills, improved relationships with others, and improved academic performance among mentored youth.
Meloro (2005) studied a large semi-urban high school on the east coast that implemented a high school advisory program in the Fall of 2004. The school had 1580 students, 123 teachers, and a dropout rate of 21%. The goal of the advisory program was to provide a nurturing environment in which students could cultivate meaningful
relationships with teachers and peers. Teachers served as mentors on an average ratio of 1 to 12. They used a co-mentoring model: two teachers in every advisory period. The advisory period met for 7 minutes a day, and for 33 minutes once every two weeks. A curriculum notebook, with relevant classroom materials, was developed with a theme for each month of the school year. The students provided demographic information and were surveyed on several instruments designed to measure sense of school belonging:
Goodenow’s (1993) Psychological Sense of School Membership Scale (PSSMS), and Brown, Leigh, and Barton’s (2000) School Connection Scale. Meloro (2005) also surveyed their perception of the advisory program using a survey she developed: Advisory Program Survey. These scales are described in more detail in chapter 3. Teachers also provided demographic information and were assessed on their
considered it as a waste of time, sometimes. Fifty-nine percent of students never or rarely enjoying the advisory, and 75% considered it a waste of time, sometimes. Meloro (2005) found females enjoyed the advisory program more than males, and ethnic majority
students had a higher sense of school belonging. Student perception of the mentor-mentee relationship and the opportunity to share their opinions were consistently strong
predictors of school belonging. Skill-building and community activities were most highly associated with positive attitudes toward the advisory program.
Spanier (2006) investigated a program called the Transition Project in which 23 twelve-grade students, called Peer Leaders, mentored all 101 9th grade students of an eastern high school. They were compared to a control group from the previous 9th grade class who received a much less structured peer mentoring program. The Transition Project is a peer mentoring program developed by the Princeton Center for Leadership training. Faculty nominated seniors based on their ability to work with others, diversity of interests, self-confidence, and being a positive role model. The mentors received 2 days of training initially and met with faculty advisors once a week for 40 minutes throughout the year. Two co-mentors conducted nine monthly sessions, one a month, from
September to May of 2005-2006 on a series of topics including one activity day, two family events, and five outreach activities which were coping with stress,
However, they did find a significant difference in sense of school belonging and in program satisfaction when the experimental group was compared to the control group.
Who Needs Mentoring
Mentoring is frequently directed to youth who are categorized as being “at-risk.” Slavin and Madden (1989) described a student at-risk as one who is in danger of failing to complete his education with an adequate level of skills. According to Hepburn & White (1990), “The term at-risk is…particularly applied to young people whose prospects for becoming productive members of society look dim” (p. 5). Boyd (1993) states,
Family background, personal characteristics of the child, the school context and the social behavior of children interact to create conditions that place children at risk of failing to achieve their academic potential, dropping out of school, and/or having limits placed on their ability to function as productive adults in society. (p. 3)
Several researchers categorize children as being at-risk according to the number, type and frequency of risk factors they are exposed to. Risk factors (Bogenschneider, 1996; Dryfoos, 1990; Small & Memmo, 2004) are individual or environmental hazards that are positively correlated with the occurrence of a problem behavior or negative developmental outcome.
youth already participating in formal mentoring relationships. The 2002 Census indicated there were 35.2 million young people in the U.S. between the ages of 10 and 18. Next, they contacted Joy Dryfoos, author of Adolescents at Risk (1990), who identified a series of factors that put youth at-risk of failing to become successful adults. She categorized youth by their risk behaviors into 4 groups:
Very high risk (10 percent of young people) – young people with multiple problem behaviors who commit serious offenses, drop out of school, use heavy drugs and have sex without contraception, etc.
High risk (15 percent) – youth who participate in two or three problem behaviors but at a slightly lower frequency and with less deleterious consequences;
Moderate risk (25 percent) – youth who tend to experiment in committing minor delinquent offenses, using substances occasionally but not hard drugs, have sexual intercourse with contraception, etc.; and
Low risk (50 percent) – young people who do not commit any serious delinquent acts, do not abuse substances, and are not yet sexually active. (p. 1)
Finally, MENTOR used information from their poll, Mentoring in America 2005: A Snapshot of the Current State of Mentoring to calculate the number of youth in formal mentoring relationships. That figure subtracted by the number of youth in need of mentors produced the number of 14.6 million.
groups: background characteristics, student behavior, school practices, and contextual variables.
Background Characteristics
Background characteristics refer to the factors related to a student’s personal background or family dynamics that contribute to increasing their risk. Tompkins and Deloney (1995) include the following variables as background characteristics which may contribute to a student being at-risk: low socioeconomic status (poverty), minority group status, limited English proficiency, single head of household, low educational attainment of parents, mobility, gender, and psychosocial factors.
According to Proctor and Delaker (2003) in the U.S. Census Bureau Report: Poverty in the United States: 2002, poverty increased from 11.7% in 2001 to 12.1% in 2002. That translates to 34.6 million people below the poverty threshold in 2002, a number 1.7 million higher than in 2001. The number of children in poverty increased to 12.1 million in 2002 from 11.7 million in 2001. The poverty rates for Whites and Asians in 2002 range between 10.0 to 10.3%. That percentage is markedly different than the poverty rates for Blacks (23.9%) and Hispanics (21.8%).
Berends, Lucas, Sullivan, and Briggs (RAND, 2005) found “improved socioeconomic conditions among blacks and Latinos correspond strongly to decreases in the
mathematics test score gaps – both between blacks and whites and between Latinos and whites” (p. 1). A U.S. Department of Education Report “Promising Results, Continuing Challenges” (1999) confirms the RAND findings. They compared student’s math and reading achievement between high-poverty and low-poverty schools. Their findings were math achievement in high-poverty schools was more than two grade levels below that in low-poverty schools. Reading achievement in high-poverty schools was between three to four grade levels below that in low-poverty schools, confirming the link between poverty and academic achievement. They also reported differential expectations between high and low poverty schools, stating an A student in a high-poverty school would be a C student in a low-poverty school.
Ethnicity is often cited as a factor contributing to student’s at-risk status.
Aptitude Test (SAT) scores for the years 1996 through 2003 for black and white students. The gap between black and white students on the SAT averages about 100 points, one standard deviation, in both verbal and mathematical areas.
Limited English proficiency is also a risk factor. Klein, Bugarin, Beltranena, and McArthur (2004) indicate there were no significant changes from 1979 to 1999 in English language ability among language minorities. They state “33% of language minorities spoke English with difficulty, compared with 34% in 1979.” (p. 2) Short and Fitzsimmons (2007) report, “Over 6 million American students are at risk of failure because they read and comprehend below – often considerably below – the basic levels needed for success in high school, postsecondary education, and the workforce.” (p. 5) Fry (2007) comments data from NEAP reveals English Language Learners (ELL) were considerably behind white students in their math and reading skills in 2005. According to Fry (2007),
The 2005 assessment indicated that 46% of ELL students nationwide achieved at the below basic level in math in grade 4. In reading, 73% of ELL fourth graders were below basic. Among white fourth-graders nationally, 11% were at the below basic level in math and 25% were below basic in reading. (p. 4)
Another risk factor is being raised in a single parent household. Nord (1998) states, “Half of students get mostly A’s and enjoy school, according to their parents, when their fathers are highly involved in their schools, compared to about one-third of students when their fathers have low levels of involvement.” (p. 2) According to
McLanahan and Sandefur (1994), children whose parents live apart are twice as likely to drop out of high school as those in two-parent homes. Furthermore, they report children whose parents live apart are one and a half times more likely to be idle as adults, and twice as likely to become single parents themselves. Shedlin (2004) indicates children do better in school when their fathers are involved in their education, regardless of whether they live with their children or not.
Low levels of educational attainment of parents, particularly that of mothers, are also a risk factor. Pallus (1989) explains, “Highly educated mothers provide children with educational resources that less-educated mothers cannot; their children do better in school and stay there longer than do the children of mothers who have not completed high school.” (p. 3) Nord (1998) analyzed data from the 1996 National Household Education Survey (NHES) and found,
highly involved fathers, while 41 percent whose fathers have graduate or professional school experience have highly involved fathers. (p. 4)
NAEP Trend in Academic Progress (Campbell, Hombo, & Mazzeo, 2000)
reports, “Across all ages and subject areas, students who report higher parental education levels tended to have higher assessment scores, on average.” (p. 46)
Mobility also effects graduation rate. Simpson and Fowler (1994) associate mobility with grade retention. A study by Haveman and Wolfe (1994) concluded mobility reduced the odds of graduating from high school. Swanson and Schneider (1999) found changing schools between grades 8 and 10 increased the chances that student would leave school before the end of 10th grade, compared to non-mobile students. Tucker, Marx, and Long (1998) found that even one residential move had a negative impact on school performance. Rumberger and Larson (1998), using data from the NHES, found that student mobility between grades 1 – 8 increased the odds of dropping out of high school, even after controlling for factors such as eighth grade achievement.
Gender may also influence student success. Grigg, Daane, Jin, & Campbell (2003) reported finding on the NAEP, females consistently outperformed their male counterparts on reading (2003) and writing (2002) at the 4th, 8th, and 12th grade levels. Although males outperform females in mathematics, the gap between the genders is narrowing. Kaufman, Alt, and Chapman (2000) found that female white and Hispanic students were more likely to complete high school. They also found females are more likely to take college-preparatory classes. Greene and Winters (2006) report female students (72%) graduate at a higher rate than male students (65%).
Student Behaviors
Tompkins and Delaney (1995) classified behavioral risk factors as participation in school; passive disengagement: inattentiveness, absenteeism and truancy; active
disengagement: misbehavior, delinquency, and criminal behavior: substance abuse, low achievement, work, and fertility-related behavior.
Participation in school is frequently described as “school engagement.” Finn (1993) presents a model of school engagement in which he refers to “status risk factors” and “behavioral risk factors.” (p. 1) According to Finn (1993), “Status risk factors are demographic and historical characteristics…that are difficult or impossible to alter” (p.1) However, he states,
Behavioral risk factors are a set of behaviors that, if not manifested by a
arriving on time, paying attention to a teacher, and completing assigned work. These behaviors continue to be important throughout the grades….The full set of behaviors may be referred to as “participation” in school. A youngster is at risk for school failure if he or she does not sustain participation in school….In contrast to status risk factors, participation in school may be more easily modified… (p. 1) Finn (1993) proposes four levels of engagement. Level one engagement requires students to be attentive, prepared, and responsive. Level two engagement requires students to take the initiative in seeking help, beginning dialogue with the teacher, and going beyond the basic requirements of the course. Level three engagement includes the students’ participation in extracurricular, social, and athletic events. Level four
engagement involves participation in governance.
Passive disengagement in school is a risk factor that includes inattentiveness, absenteeism, and truancy (Finn, 1993). Students who drop out of high school cite boredom, irrelevance, lack of motivation, and lack of a challenging and engaging curriculum as reasons to leave (Bridgeland; Dululio; & Morison; 2006). According to Bridgeland et al. (2006), disengagement from school is a process. He found that students who dropped out felt progressively alienated from school. “Students described a pattern of refusing to wake up, missing school, skipping class, and taking three-hour lunches – and each absence made them less willing to go back” (p. 8).
Deficit/Hyperactivity Disorder (AD/HD) indicate signs and symptoms of inattention may include failure to pay close attention to details, making careless mistakes, trouble
sustaining attention, difficulty following through, problems with organization, frequently losing needed items, easily distracted, and often forgetful. In assessing AD/HD:
Inattentive Type, a widely-used behavior rating scale (Conners, 2000) characterize inattention as inability to concentrate, lacking perseverance, easily distracted, easily frustrated and having a short attention span with impulsive, aimless activity. The Diagnostic and Statistical Manual of Mental Disorders: Fourth Edition (DSM-IV-R), published in 2000, describes three types of ADHD, one of which is Predominantly Inattentive Type. This subtype is used if six or more symptoms of inattention, but fewer than six symptoms of hyperactivity-impulsivity, have been present for 6 months or longer. These symptoms are:
Inattention
a) often fails to give close attention to details or makes careless mistakes in school work, work, or other activities
b) often has difficulty sustaining attention in tasks or play activities c) often does not seem to listen when spoken to directly
d) often does not follow through on instructions and fails to finish schoolwork, chores, or duties in the workplace (not due to oppositional behavior or failure to understand directions)
f) often avoids, dislikes, or is reluctant to engage in tasks that require sustained mental effort (such as schoolwork or homework)
g) often loses things necessary for tasks or activities (e.g., toys, school assignments, pencils, books, or tools)
h) is often easily distracted by extraneous stimuli i) is often forgetful in daily activities
Absenteeism and truancy are also characteristics of disengagement that are
predictive of the likelihood of dropping out. A study by Balfanz and Herzog (2005) found that among the Philadelphia sixth graders they assessed, half with the following three criteria eventually left school: attended school less than 80 percent of the time, received a poor final grade from their teachers in behavioral conduct, and were failing either math or English. A follow-up study (Neild & Balfanz, 2006) of eighth graders found poor
attendance and failing grade(s) in a core subject to be strong predictors of drop out. They state:
Of those 8th graders who attended school less than 80 percent of the time, 78 percent became high school dropouts. Of those 8th graders who failed
mathematics and/or English, 77 percent dropped out of high school. Importantly, gender, race, age, and test scores did not have the strong predictive power of attendance and course failure (p. 42).
Truancy is also indicative of subsequent dropout. Kaufmann, Bradbury and Owings (1992) found students who skipped class once a week or more were nearly six times more likely to drop out than students who never cut class. Bridgeland et al. (2006) report:
Students described a pattern of refusing to wake up, missing school, skipping class, and taking three hour lunches- and each absence made them less willing to go back…In our survey, 59 to 65 percent of respondents missed class often the year they dropped out and 33 to 45 percent missed class often the year before they dropped out. Consistent with national data, absenteeism is the most common indicator of overall student engagement and a significant predictor of dropping out. (p. 8)
Bridgeland et al. (2006) also found 38 percent of the interviewed dropouts reported having too much freedom and not enough rules. “Nearly two–fifths or their respondents cited this as a factor in their decision to drop out of high school.” (p. 8)
“unsatisfactory” in sixth grade had only a 25 percent chance of making to 12th grade on time.
Delinquency and criminal behavior also contribute to the probability of student dropout. An increase in juvenile delinquency and criminal behavior mirror an increase in the nation’s dropout rate. Snyder and Finnegan (1996) report gun homicides by juveniles have tripled since 1983 and the number of murdered juveniles increased 47% from 1980 to 1994. Snyder (1997) also reports juvenile arrests increased approximately 170% from 1984 to 1993. Voelkl, Welte, and Wieczorek (1999) examined the relationship between education and delinquency. They found skipping classes was related to higher rates of delinquent behavior (both minor and serious crimes) for all students. They also found African American, but not White, students with low grades or who had dropped out of school were associated with higher degrees of delinquency. They conclude, “Thus, for African American, but not for White adolescents, the decision to drop out of school was connected with involvement in delinquent activity.” (p. 83)
The American Youth Policy Forum (2006) reports seventy-five percent of state prison inmates are dropouts and that dropouts are more than 3 times as likely to be incarcerated than high school graduates. Since high school graduates are less likely to commit crimes than non-graduates, they estimate a one percent increase in the graduation rate would save the United States $1.4 billion dollars annually in reduced costs associated with crime.
substance abuse among their greatest concerns as a major factor affecting drop out probability. A similar study by Bull, Montgomery, and McIntosh (1993) examined the perceptions of 1, 300 school administrators and 441 school psychologists regarding the causes of school dropout. Using a 5-point Likert scale, they reported that substance abuse was perceived as the third most likely reason students drop out of high school.
Townsend, Fisher, and King (2007) undertook a systematic review of forty-six peer-reviewed articles published between 1990 and 2006 to examine the relationship between dropping out of high school and substance abuse. They found
Across all the cross-sectional studies reporting on their sample’s use of tobacco (cigarette smoking), dropouts were more likely to report current cigarette smoking than were in-school students …regardless of ethnicity …or high school
graduates…. They were also more likely to do so at an earlier age and to be heavy smokers…. In-school students identified as being at risk for dropping out of school were also more likely to be to smoke cigarettes than were low-risk students… and more likely to be heavy cigarette smokers than normally performing in-school students…(p. 309).
Although these authors found a more tenuous relationship between other drug use and high school dropout, they discovered high school dropouts were more likely to use cigarettes and marijuana at higher rates than in-school students or graduates. They conclude
the longitudinal studies largely support the unique effect of cigarette and marijuana use on dropping out of school. However, the relationship between alcohol and other drug use and high school dropout is a complex one that may benefit from further research ( p. 312).
Low achievement and grade retention appear to be two of the most significant predictors of later drop out. As early as 1993, Roderick (1993) found low grades in elementary school were predictive of high school dropout. Alexander, Entwistle, and Horsey (1997) found the most reliable predictor of dropout is whether a student repeated a grade in elementary or middle school. They found 64 percent of students who repeated a grade in elementary school and 63 percent who repeated a grade in middle school dropped out before graduating. Alexander, Entwistle and Kabbani (2001) found academic difficulty is one of the strongest predictors of drop out, whether assessed by grades, test scores, or course failure. Neild and Balfantz (2006) found of those 8th graders who failed math and/or English, 77 percent dropped out of high school. They also concluded more than half of Philadelphia’s dropouts were not promoted past 9th or 10th grade, yet were 17 years or older when they dropped out, indicating they had already had invested
considerable time attempting to graduate. Allensworth and Easton (2005) concluded failing to be promoted to 10th grade, coupled with more than one F in core academic subjects, were factors that were 85 percent successful in determining students who would not graduate on time or would drop out.
interviewed indicated school failure was among the top five reasons students left school prior to graduation. They report:
Thirty two percent of respondents were required to repeat a grade before dropping out and 29 percent expressed significant doubts that they could meet they could have met their high school’s requirements for graduation, even if they had put forth the necessary effort (p. 7).
A student’s decision and/or need to work appears to influence the likelihood of graduation. Barro and Kolstad (1987) concluded working more than 22 hours a week nearly doubled the likelihood a student would drop out of school. Goldschmidt and Wang (1999) concurred part-time work (> 20 hours a week) was a significant predictor of dropout. They concluded early work experience, particularly for middle school students, was particularly detrimental. They also determined employment was negatively
associated with graduation, regardless of socioeconomic status. Of those students who had dropped out of high school and were interviewed in The Silent Epidemic (Bridgeland et al., 2006), 32% indicated they left to get a job.
School Practices
Tompkins and Deloney (1995) indicate school practices influence dropout
probability. Examples include specific teacher variables, student retention, course failure and poor grades, suspension and expulsion, and ability grouping. Goldschmidt and Wang (1999) researched how schools affect dropout behavior and concluded, “School factors can account for approximately two thirds of the differences in mean dropout rates, but they do a poor job of mediating specific student risk factors.” (p. 715)
The educational debate over which school variables affect student achievement has gone on for many years. In Equality of Educational Opportunity, widely known as The Coleman Report (Coleman, Campbell, Hobson, McPartland, Mood, Weinfeld & York, 1966) concluded, “Schools bring little influence to bear upon a child’s achievement that is independent of his background and general social context” (p. 325). However, subsequent research has contradicted Coleman’s (1966) finding. School attributes like teacher gender and race (Ehrenberg, Goldhaber, & Brewer, 1995; Goldhaber, Brewer, & Anderson, 1999; Hanushek, Kain, & Rivkin, 2002), teacher education and experience (Cavalluzzo, 2004; Darling-Hammond, 2000; Goldhaber, Brewer, & Anderson, 1999; Greenwald, Hedges, & Laine, 1996; Hanushek, 1997; Haycock, 2002; Walsh, 2001), teacher knowledge and enthusiasm for the subject (Monk & King-Rice, 1994; Brewer & Goldhaber, 1996), teacher salary (Kingdon & Teal, 2002), and class size (Nye,
2002; Hanushek, Kain, & Rivkin, 2002; Wright, Horn, & Sanders, 1997). In fact, Darling-Hammond (2000) reported teacher-quality variables accounted for 67 to 87 percent of the total variance in student achievement. Hanushek et al. (2002) found that students assigned to highly effective teachers for three consecutive years performed 50 percentile points higher than comparable students assigned to least effective teachers for the same period of time. They concluded that teacher effectiveness is more influential than race, socioeconomic status, parental education, or any other factor in determining achievement. A study by Sanders and Rivers (1996) found that average student gains over one year in Tennessee were only 14% with an ineffective teacher compared to 53% with an effective teacher. A study of the Boston Public Schools restructuring project (Boston Public Schools, 1998) found that the top third of teachers produced as much as six times the learning growth as the bottom third of the teachers. Three studies conducted in Tennessee (Sanders & River, 1996; Sanders & Horn, 1998) and Texas (Jordan,
Mendro, & Weeasinghe, 1997) suggest teachers can be effective with students at all levels of achievement and teacher impact can persist long after a student has left their classroom.
policies) that alienate students or encourage them to leave school prior to graduating. The Dignity in Schools Campaign (Dignity in Schools, 2006) states “Pushout happens when youth are removed (or remove themselves) from a regular school setting as a result of policies and practices that discourage them from remaining in classrooms and on track to receive a regular diploma” (p. 1).
Grade retention is considered a potential pushout factor for some researchers. Alexander, Entwistle, and Horsey (1997) found grade retention in elementary or middle school to be the most powerful predictor of high school dropout. Herlihy (2007) found ninth grade to be a critical year in that more students are held back in ninth grade than in any other year and a disproportionate number of those are more likely to drop out. A study by Haney (2000) found since the passage of the Texas Assessment of Academic Skills (TAAS), the minimum competency test adopted by the state of Texas, only 50% of the states’ minority students have been promoted from 9th to 10th grade. Grade retention rates are nearly twice as high for Black and Hispanic students as for White students, according to Haney (2000). He claims, “A convergence of evidence indicates that during the 1990’s, slightly less than 70% of students actually graduated from high school” (p. 2).
enforcement policies in the 1980’s” (p. 2). As early as 1986, Ekstrom et al. (1986) found school suspension was a moderately strong predictor of a student dropping out. Ekstrom et al. (1986) reported greater than 30% of the sophomores they studied who dropped out of school had been suspended, a rate three times higher than those that remained in school. Darling-Hammond (2002) reports zero tolerance policies mandating automatic suspension impact dropout rates. Miller et al. (2005) accuses zero tolerance policies as resulting in a kind of “double jeopardy” in which students are punished jointly by the legal and school systems, resulting in consequences that may make it difficult for a student to remain in school.
Sullivan (2007) conducted interviews and focus groups with students, parents, teachers, community advocates and educational researchers in New York City and Los Angeles. She writes