279
DEVELOPMENT AND VALIDATION OF UV - SPECTROSCOPIC
METHOD FOR DETERMINATION OF CAPECITABINE IN BULK
AND FORMULATION
*D Jothieswari
1, B Chandraobulreddy
1, G Swarna Latha
1, I Sowkar Baig
1,
K Bhaskar Reddy
1and K Dhanalakshmi
21Sri Venkateswara College of Pharmacy, Chittoor, Andhra Pradesh - 517001, India. 2
KLR Pharmacy College, Palvoncha, Khammam Dt, Telungana, India.
ABSTRACT
Capecitabine is used as an anti-cancer drug. The aim of the present study is to develop a new analytical method for the estimation of Capecitabine in bulk and in tablet dosage form. Spectroscopic method has been developed for the quantification of Capecitabine in bulk and in the formulation. This method is simple, cost effective, accurate and precise. In this method, Capecitabine showed maximum absorbance at 295 nm in methanol followed by double distilled water, which was selected as solvent for our analysis based on its stability. Beer’s law obeyed in the concentration range of 5-25 mcg/ml. The limit of detection (LOD) and limit of quantification (LOQ) was found to be 0.26941 and 0.81639 mcg/ml respectively. This method is validated as per ICH guidelines. The method was found to be simple, accurate, precise and rapid.
Keywords: UV-Spectroscopic method, Capecitabine, Precise.
INTRODUCTION
Capecitabine is chemically Pentyl[1-(3,4- dihydroxy-5-methyl-tetrahydrofuran-2-yl)-5-fluoro-2-oxo-1H-pyrimidin-4-yl] amino methanoate[1]. Its Molecular formula is C15H22FN3O6 and possessing a molecular
weight of 359.35. It is Soluble in aqueous solvents and insoluble in organic solvents. Capecitabine is used as an anti-cancer drug .The structural formula of Capecitabine is given below.
Chemical structure of Capecitabine
Analytical methods are required to characterize drug substances and drug products composition during all phases of pharmaceutical development in the recent era. Standard analytical procedure for newer drugs or formulation may not be available in pharmacopoeia. Only
few method are available like UV [2,3], Visible [4,5] and RP-HPLC [6] methods. Hence, it is essential to develop newer analytical methods, which are accurate, precise, and specific, linear, simple and rapid. From the extensive literature survey, it was revealed that there were a very few methods reported for pharmaceutical dosage forms. Therefore, here an attempt was made to develop simple, cost effective and accurate method.
MATERIALS AND METHOD Materials
Drug Sample (Raw material)
Capecitabine was obtained as a gift sample from Hetero Healthcare Ltd., Hyderabad, India.
Formulation used
Xeloda® [7] (Hetero Healthcare Ltd., Hyderabad) - containing 500 mg of Capecitabine. The formulation was procured from the local market.
Corresponding Author: - D Jothieswari Email: [email protected]
International Journal of
Medicinal Chemistry & Analysis
www.ijmca.com
e ISSN 2249 - 7587
280
Chemicals and solvents usedMethanol was purchased from loba chemic Pvt. Ltd.107, Wodehouse Rood, Mumbai 400005. India.
Double distilled water was purchased from Aravind labs, Tirupathi.
Instruments used
Different instruments used to carry out the present work, 1. Shimadzu AUX- 220 Digital balance
2. Analytical Spectroplus 2060 3. ELICO pH meter ( Model LI-120) 4. Micropipette
5. Bruker FT-IR
6. Melting point apparatus
Specifications (Terms) of instruments
a) Shimadzu AUX- 220 Digital balance (Shimadzu Instruction Manual)
b) Double Beam UV- Visible Spectrophotometer
(Analytical Plus) - Model;SPECTRO 2060 PLUS, Cuvetts: 1 cm quartz cells.
Method: In the present work an attempt was made to develop and validate simple, precise and accurate method for the estimation of Capecitabine in pure form and in tablet dosage form by UV spectrophotometry.
Preparation of standard drug solutions: 100 mg of Capecitabine raw material was accurately weighed and transferred into the 10 ml volumetric flask and dissolved in minimum quantity of methanol and made up to 10 ml with methanol. The solution was observed to contain 10000g/ml. Dilute 1 ml of this solution in to 100 ml with double distilled water. The solution was observed to contain 100 g/ml.
Preparation of Calibration curve: In this method, the aliquots of stock solution of Capecitabine (0.5 – 2.5 ml of 100 g/ml) were transferred into 10 ml volumetric flask and made up to the mark with double distilled water. The absorbance of different concentration solutions was measured at 295nm against double distilled water as blank. The samples were found to be linear with the concentration range of 5 – 25 g/ml. The calibration curve was plotted using concentration against absorbance. The curve obtained was linear with the concentration range of 5 - 25 g/ml.
Procedure for assay of pharmaceutical formulations:
Twenty tablets of formulation (Xeloda® - containing 500 mg of Capecitabine) was accurately weighed to find out the average weight and powdered. Powdered tablets equivalent to 100 mg of Capecitabine was transferred into a 10 ml volumetric flask, added methanol to dissolve and made up to the volume. Then the solution was sonicated for 10 minutes. After sonication the
solution was centrifuged at 100 rpm for 10 minutes. The solution was filtered through Whatmann filter paper No.41. From the clear solution, 1 ml of the solution was transferred into a 100 ml standard flask and made up to the mark with double distilled water to produce 100 g/ml concentration. Dilute 1.5 ml of this solution in to 10 ml with double distilled water to produce 15 g/ml. The absorbance measurements were made six times for the formulation at 295 nm. The amount of Capecitabine present in formulation was determined by using slope and intercept values from calibration graph.
Validation of the developed method [8]
Precision: Precision was determined by intra-day and inter-day studies. Precision of the method was evaluated by carrying out the assay and analyzing corresponding responses 3 times on the same day and on different days for the sample solution. The percentage relative standard deviation (% RSD) was calculated.
Accuracy (Recovery studies): Accuracy studies were performed at three different levels (20%, 40% and 60%) and the samples were analyzed in triplicate by the proposed method. Known amount of standard CAP at 20%, 40% and 60% added to the pre-determined tablet sample.
LOD and LOQ: The linearity study was carried out for six times. The LOD and LOQ were calculated by using the average of slope and standard deviation of intercept.
RESULTS
A simple, precise and accurate method was developed for the estimation of Capecitabine in pure form and in its tablet dosage form. The method employed for analysis of Capecitabine was
UV spectrophotometric method
281
wavelength maxima was found to be 295nm. The absorbance of the solution was measured at the selected wavelength in different time intervals. It was observed that Capecitabine in double distilled water was stable for 1 hour. Hence this wavelength was selected for analysis. Different aliquot of Capecitabine in double distilled was prepared in the concentration range of 5-25
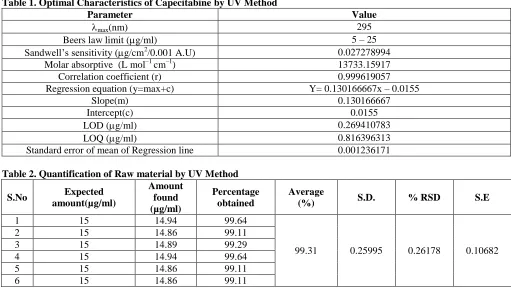
g/ml. The absorbance of solution was measured at 295 nm. The calibration curve was plotted using concentration against absorbance. The procedure was repeated 6 times. The optimal parameters like correlation co-efficient, slope, intercept, sandell’s sensitivity, molar absorptivity, LOD and LOQ were calculated. These are shown in the table-1. The correlation co-efficient value for the calibration curve was found to be 0.9996 it indicates that the concentration of Capecitabine has good linearity. The calibration graph is shown in figure 3.
Quantification of raw material by UV method
Capecitabine (pure drug) solution was prepared in methanol and further diluted with double distilled water (15 g/ml) for six times. The absorbance of these solutions was measured at 295 nm and the amount of each solution was calculated by using slope and intercept values from calibration curve. The amount of Capecitabine was found to be 99.31% ± 0.25997. This
indicates that the proposed method can be applied for the analysis of tablets and shown in table 2.
Quantification of formulation – Xeloda® by UV method Tablet formulation (Xeloda® - Hetero health care, Hyderabad) containing 500 mg of Capecitabine was selected for analysis. Twenty tablets were weighed accurately and the average weight was found. The nominal concentration of Capecitabine (15 g/ml) was prepared for six times. The absorbance of solution was measured at 295 nm and the amount of each test solution was calculated. The percentage label claim of Capecitabine present in tablets was found to be 99.88% ± 0.31738. The amount found of drug in formulation in good agreement with the label claim and the percentage relative standard deviation (%RSD) value was found to be 0.31776. It indicates that the method has good precision. The results of formulation analysis were shown in table 3.
Further the precision of method was confirmed by intraday and inter day analysis. The analysis of formulation was carried out for three times in the same day and one time in the three consecutive days. The %RSD value was found to be 0.29240 and 0.40305 for intraday and inter day analysis of Capecitabine respectively. The analysis results were reported in table 4 and the precision was confirmed.
Table 1. Optimal Characteristics of Capecitabine by UV Method
Parameter Value
max(nm) 295
Beers law limit (g/ml) 5 – 25
Sandwell’s sensitivity (g/cm2/0.001 A.U) 0.027278994 Molar absorptive (L mol–1 cm–1) 13733.15917
Correlation coefficient (r) 0.999619057
Regression equation (y=max+c) Y= 0.130166667x – 0.0155
Slope(m) 0.130166667
Intercept(c) 0.0155
LOD (g/ml) 0.269410783
LOQ (g/ml) 0.816396313
Standard error of mean of Regression line 0.001236171
Table 2. Quantification of Raw material by UV Method
S.No Expected
amount(µg/ml)
Amount found (µg/ml)
Percentage obtained
Average
(%) S.D. % RSD S.E
1 15 14.94 99.64
99.31 0.25995 0.26178 0.10682
2 15 14.86 99.11
3 15 14.89 99.29
4 15 14.94 99.64
5 15 14.86 99.11
282
Table 3. Quantification of Formulation –Xeloda® by UV Method*Mean of six observations
Table 4. Intraday and Inter day analysis of Formulation - Xeloda® by UV Method
S.No Labelled
Amount (mg/tab)
Amount Obtained *
S.D* % RSD*
Intra day Inter day Intra day Inter day Intra day Inter day
1 500 498.95 501.85
1.45989 2.01361 0.29240 0.40305
2 500 500.85 498.95
3 500 497.98 497.98
Mean 499.27 499.59
* Mean of Three observations.
Table 5. Recovery Analysis of Formulation - Xeloda®by UV Method
S.No
Amount Present (g/ml)
Amount Added (g/ml)
Amount Found* (g/ml)
Amount Recovered*
(g/ml)
Percentage Recovery*
(%) S.D
% RSD
S.E
1. 15 3 17.97 2.97 99
0.23094 0.23296 0.13334
2. 15 6 20.945 5.94 99
3. 15 9 23.946
8.946 99.4
Mean 99.13
* Mean of Three Observations.
Figure 1. IR spectrum of Capecitabine S.No Labelled amount
(mg/Tab)
Amount found (mg)*
Percentage obtained* (%)
Average*
(%) S.D. %RSD S.E
1 2 3 4 5 6
500 500 500 500 500 500
498.95 500.88 497.98 501.85 498.95 497.98
99.79 100.16
99.59 100.37
99.79 99.59
283
Figure 2. UV Spectrum of Capecitabine in methanolfollowed by Double distilled water
Figure 3. Calibration curve of Capecitabine in methanol followed by Double distilled water
The accuracy of the method was performed by recovery studies. For the pre analysed formulation, a known quantity of Capecitabine raw material solution was added at different levels viz., 20%, 40% and 60%. The absorbance of the solutions was measured and the percentage recovery was calculated. The percentage recovery was found to be in the range of 99 – 99.4%. The amount of the drug recovered from the formulation was very close to the expected value and the % RSD value also very low (0.23296). This indicates that this method was very accurate. The recovery data is shown in table 5. All the above parameters combined with the simplicity and ease of operation ensures that the application of proposed method in the assay of Capecitabine in bulk and tablet dosage forms. Hence the UV spectroscopy method may be applied for the estimation of Capecitabine in bulk and in tablet formulation.
CONCLUSION
A simple, rapid and accurate analytical method was developed for the determination of Capecitabine in bulk and in tablet formulation by using UV Specrtophotometry. The method was shown that excellent sensitivity, reproducibility, accuracy and repeatability, which is evidenced by the low percentage relative standard deviation. The results obtained in recovery studies were indicating that there is no interference from the excipients used in the formulation. Hence it is suggested that the proposed UV spectrophotometric method may be effectively applied for the routine analysis of Capecitabine in bulk and in tablet formulation.
ACKNOWLEDGMENTS
The authors are grateful to management, Sri Venkateswara College of Pharmacy, Chittoor providing facilities to carry out this work. Also thank to Hetero Healthcare Ltd., Hyderabad providing the gift sample.
REFERENCES
1. Dooley M, Goa KL. Capecitabine. Drugs, 58(1), 1999, 6976.
2. Medikondu Kishor et al. Spectrophotometric determination of Capecitabine in Pharmaceutical Formulations.
International Journal of Chemical and Analytical Science, 2010, 1(10), 238-241.
3. Naveen kumar M et al. Validated UV spectrophotometric method for quantitative analysis of capecitabine in pharmaceutical dosage form. Journal of Chemical and Pharmaceutical Sciences, 6(4), 2013, 231-233.
4. Kumbhar SC et al. UV - Spectrophotometric Method development for Capecitabine in Eudragit and Chitosan based Microspheres and its Validation. Indian J. Pharm. Biol. Res, 1 (3), 2013.
5. Venkata Raju Y et al. Development of Validated Stability Indicating RP-HPLC Method for the estimation of Capecitabine in Pure and Pharmaceutical Formulations. International Journal of Research in Pharmaceutical and Biomedical Sciences, 2 (1), 2011.
6. Narendra Devanaboyina, Development and Validation of new RP-HPLC method for analysis of Capecitabine in pharmaceutical dosage form. IJSIT, 2(1), 2013.
7. Product monograph: Xeloda® (Capecitabine). Hoffmann La Roche, February 15th, 2011.