Application of routine calibration of real water
supply network with adjustment of demand
roughness parameters driven by applied pressure
real network of Brazil
Fernando das Graças Braga da Silva
1, Thaisa Dias Goulart
2, Regina M.
Barros
31 2 3Federal University of Itajubá, Brazil
[email protected], [email protected], [email protected]
Abstract
The calibration of water distribution networks is one way to perform such procedures in hydraulic models, but several are the difficulties encountered in calibrating a real network. This work proposes the improvement of modules of the calibration method proposed by Silva (2003), where using the genetic algorithm (GA) search tool, the author calibrates a real water distribution network of a Brazilian city, adjusting parameters mainly from roughness and coefficient of leakage. The enhancement of GA is the introduction of a new decision variable, the nodal demand, which assigns demand values to nodes according to the pressure-driven demand model of Tucciarelli, Criminisi and Termini (1999). The tests of the GAs implemented are tested for this real water distribution network presented by Silva (2003). The effect of the improvement on the calibration results was significant for the network, but the need for more in-depth studies, which are of course required for the application of new algorithms in real-scale networks.
Keywords: water distribution network Structure, Genetic Algorithms, calibration
1.
Introduction
According to Walski (1986), from a simplistic point of view, the calibration can be divided into two stages: (1) a comparison of the pressures and flows predicted in the hydraulic simulation model with the pressures and flows observed with the system working within the operating conditions; (2)
Engineering
EPiC Series in Engineering
Volume 3, 2018, Pages 504–511 HIC 2018. 13th International Conference on Hydroinformatics
adjustment of input data in the hydraulic model in order to increase the consistency of expected and observed results.
Some recent calibration studies of water distribution networks such as Silva (2003) Borges et al. (2008), Ganem et al. (2012), Salvino et al. (2012), Nasirian, Maghrebi and Yazdani (2013), Silva et al. (2013) and Rocha (2013), Goulart (2015) and Santos (2016).
Another aspect also studied are hydraulic pressure-driven simulation models (MSHDP), adopting different relations between demand and the respective service pressures. The following authors are noteworthy in this line of research: Fujiwara and Li (1998) and , Tucciarelli, Criminisi and Termini
(1999). Tucciarelli,
Criminisi and Termini (1999), applied the demand model in the calibration process of a water distribution network, proposing a model of pressure x sinusoidal demand.
2.
Material and methods
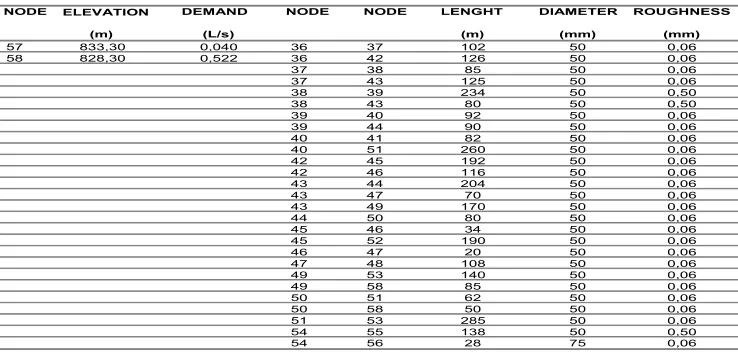
For a study was selected a real network of the interior of the state of São Paulo Brazil composed of 58 nodes and 83 stretches. The Table 1 shows the network data, including nodes, expected demand, diameter and roughness.
NODE ELEVATION DEMAND NODE NODE LENGTH DIAMETER ROUGHNESS
(m) (L/s) (m) (mm) (mm)
1 843,00 0,027 1 2 30 50 0,06
2 841,20 0,079 2 3 65 50 0,06
3 836,50 0,092 2 7 106 50 0,06
4 831,90 0,074 2 8 106 50 0,06
5 855,60 0,027 3 9 92 50 0,06
6 854,50 0,048 3 24 292 50 0,06
7 853,10 0,048 3 57 30 50 0,06
8 853,70 0,122 4 11 96 50 0,06
9 850,10 0,122 4 12 150 50 0,06
10 847,00 0,095 4 57 44 50 0,06
11 845,40 0,177 5 6 30 50 0,06
12 828,00 0,082 6 7 22 50 0,06
13 855,80 0,021 6 13 68 50 0,06
14 845,30 0,153 7 23 198 50 0,06
15 826,10 0,098 8 9 56 50 0,06
16 854,50 0,039 8 23 198 50 0,06
17 845,90 0,164 9 24 200 50 0,06
18 829,50 0,179 10 11 34 50 0,06
19 856,40 0,083 11 12 122 50 0,06
20 853,80 0,066 11 14 74 50 0,06
21 853,80 0,042 13 16 64 50 0,06
22 854,00 0,025 13 19 166 50 0,06
23 851,30 0,116 14 15 156 50 0,06
24 848,20 0,146 14 17 68 50 0,06
25 846,20 0,141 16 21 70 50 0,06
26 836,00 0,247 16 22 20 50 0,06
27 829,70 0,095 17 18 214 50 0,06
28 856,00 0,000 17 25 60 50 0,06
29 854,70 0,016 18 27 244 50 0,06
30 849,60 0,059 19 20 90 50 0,06
31 842,20 0,062 19 21 90 100 0,06
32 842,20 0,077 19 28 122 100 0,06
33 835,60 0,206 19 54 110 50 0,06
34 830,10 0,104 21 22 54 50 0,06
35 825,70 0,037 21 23 60 50 0,06
36 840,10 0,088 21 55 84 50 0,50
37 836,20 0,095 23 24 66 50 0,06
38 837,30 0,131 24 25 70 50 0,06
39 831,00 0,202 25 26 222 50 0,06
40 824,50 0,123 25 31 82 50 0,06
41 823,00 0,065 26 27 225 50 0,06
42 823,30 0,029 27 35 90 50 0,06
43 830,60 0,084 28 29 28 150 0,06
44 828,00 0,114 28 56 22 150 0,06
45 820,00 0,179 29 32 325 75 0,50
46 821,20 0,208 29 36 172 50 0,06
47 824,20 0,208 30 36 68 50 0,06
48 821,60 0,216 31 33 228 50 0,06
49 825,40 0,297 31 38 78 50 0,06
50 824,10 0,138 31 55 195 50 0,50
51 816,20 0,138 32 38 88 75 0,06
52 815,00 0,050 33 34 144 50 0,06
53 818,70 0,118 33 39 70 50 0,06
54 855,90 0,066 34 35 142 50 0,06
55 849,60 0,104 34 41 56 50 0,06
56 855,50 -6,386 35 41 170 50 0,06
Application of Routine Calibration of Real Water Supply ... F. Das Gra¸cas Braga Da Silva et al.
Table 1: Information real network study (continuation)( Silva, 2003 and Goulart, 2015)
After the introduction of the Tucciarelli, Criminisi and Termini (1999) pressure-driven mathematical model, another operator called TUCCIARELLI was developed, so the flowchart was altered as shown in Figure 1.
In general outlines of description, the GENERATOR routine the program performs different paths after the first generation. In the first generation are used rugosidades and demands generated by the program. But from the second generation onwards, despite the initial generation of rugosities and demands passing through the TUCCIARELLI operator, the demand changes according to the pressure criteria of the demand-driven demand model of Tucciarelli, Criminisi and Termini (1999). nodal pressure values obtained in the previous generation to which it is occurring.
After reading the data in the cycle following GENERATOR operator where randomly, also for both models implemented with the nodal demand, are generated an initial solution of roughness and an initial solution demands.
In SELECTION, the process of choosing the best solutions was done by the tournament method.
This evaluation is based on the pressure values obtained for the nodes and flow values at the entrance of the system. These values are the result of calculations with hydraulic each individual roughness and population in question demands for three patterns of use: maximum consumption (pattern 1), the average consumption (2 standard) and minimal consumption (Standard 3).
The hydraulic calculations of the problem are made possible by a sub-operator, called HYDRAULIC, where the friction losses (universal formula) and other parameters of interest are calculated. With the pressure and flow values resulting from each roughness and demand population, there is a value for the objective function, which compares the pressure and flow values observed in the field with the calculated pressure and flow values. The best solutions (roughness and demands), those that maximize the value of the objective function, are selected to exchange the genetic codes giving rise to new individuals, that is, new solutions to the problem.
NODE DEMAND NODE NODE LENGHT DIAMETER ROUGHNESS
(m) (L/s) (m) (mm) (mm)
57 833,30 0,040 36 37 102 50 0,06
58 828,30 0,522 36 42 126 50 0,06
37 38 85 50 0,06
37 43 125 50 0,06
38 39 234 50 0,50
38 43 80 50 0,50
39 40 92 50 0,06
39 44 90 50 0,06
40 41 82 50 0,06
40 51 260 50 0,06
42 45 192 50 0,06
42 46 116 50 0,06
43 44 204 50 0,06
43 47 70 50 0,06
43 49 170 50 0,06
44 50 80 50 0,06
45 46 34 50 0,06
45 52 190 50 0,06
46 47 20 50 0,06
47 48 108 50 0,06
49 53 140 50 0,06
49 58 85 50 0,06
50 51 62 50 0,06
50 58 50 50 0,06
51 53 285 50 0,06
54 55 138 50 0,50
54 56 28 75 0,06
ELEVATION
Application of Routine Calibration of Real Water Supply ... F. Das Gra¸cas Braga Da Silva et al.
The inverse problem of parameter determination by minimizing deviations between observed values and simulated pressure and flow values was expressed and maintained the same as that proposed by Silva (2003).
Figure 1: Flow diagram of GA implemented with operator TUCCIARELLI (Goulart, 2015)
3.
Results
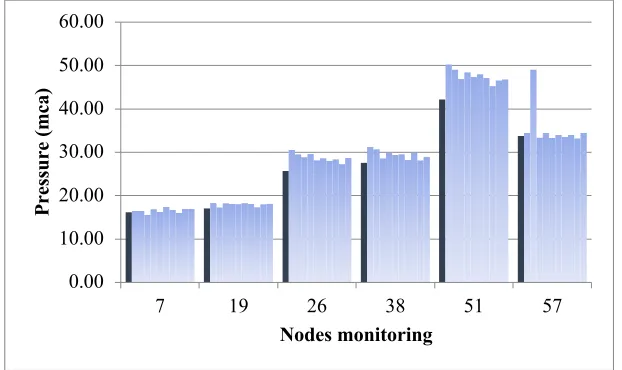
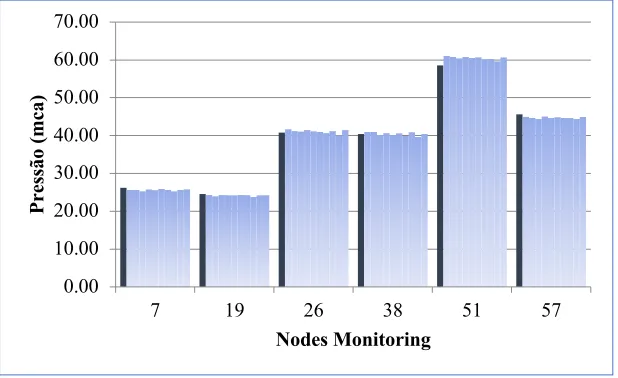
The figures 1,2 and 3 allows the comparison between the observed and simulated pressures for the three consumption patterns and for the distinct random populations resulting from the AG implemented with pressure directed demand. In general, the results between the observed values and the simulated values show a low difference between the values, in which the best results are related to the minimum consumption condition (standard 1).
Application of Routine Calibration of Real Water Supply ... F. Das Gra¸cas Braga Da Silva et al.
The first standard represents lower, the standard 3 lower pressures and the 2 intermediate pressures standard.
The pressure values are shown in the ordinates. In the abscissa the nodes analyzed. The black bars represent the values measured from the work of Silva (2003) and the blue bars the values simulated from the flowchart of genetic algorithms and demand driven by pressure.
It is observed that the pattern of higher pressure presents the best adjustments of measured and simulated values.
Figure 1: Simulated and observed pressures for all random populations, for the model implemented with pressure driven demand - consumption pattern 1
Figure 2: Simulated and observed pressures for all random populations, for the model implemented with pressure driven demand - consumption pattern 2
0.00 5.00 10.00 15.00 20.00 25.00 30.00 35.00 40.00
7 19 26 38 51 57
Pr
es
sur
e
(m
ca
)
Nodes monitoring
0.00 10.00 20.00 30.00 40.00 50.00 60.00
7 19 26 38 51 57
Pr
es
sur
e
(m
ca
)
Nodes monitoring
Application of Routine Calibration of Real Water Supply ... F. Das Gra¸cas Braga Da Silva et al.
Figure 3 - Simulated and observed pressures for all random populations, for the model implemented with pressure driven demand - consumption pattern 3
4.
Conclusions
The present work deals with a study of the improvement of computational GA for the calibration of water distribution networks. Based on the work of Silva (2003) that calibrated the roughness of the stretches and leakage parameters, the nodal flow variation based on the Tucciarelli, Criminisi and Termini (1999) model was considered, with demand driven as a decision variable of AG. The application of the GA was performed for a real network studied by Silva (2003), located in a Brazilian city consisting of 58 nodes and 83 stretches. With the results of this application the following conclusions can be verified:
-Values measured in the field were very close to the values calculated by the algorithm; - The adjustment of roughness, leakage and pressure driven parameters made the adjustment very
realistic.
Acknowledgments
The paper authors thanks FAPEMIG - Foundation for Research Support of Minas Gerais for the support in particular to the PPM Project - Researcher of Minas Gerais, in particular to PPM 00755-16 and the Brazilian Ministry of Science and Technology for the REDECOPE FINEP Project. Ref. 0983/10 -"Development of Efficient Technologies for Hydroenergetic Management in Water Supply Systems"
0.00 10.00 20.00 30.00 40.00 50.00 60.00 70.00
7 19 26 38 51 57
Pr
es
sã
o
(m
ca
)
Nodes Monitoring
Application of Routine Calibration of Real Water Supply ... F. Das Gra¸cas Braga Da Silva et al.
References
[1] Borges, V. M. N.A .; Filho, K. Z .; Souza, V. C .; Santos, P.C .; Detilio, M.A .; Mello, L. A. Hydraulic modeling of adductor systems for real-time operation. in: Ibero-American seminar on supply and drainage systems - serea, viii., Lisboa. anais ... Technical Superior Institute - Engineering College of the Technical University of Lisboa, 2008. p. 11. 1 cd-rom, 2008
[2] Fujiwara, O .; LI, J. Reliability Analysis Of Water Distribution Networks In Consideration Of Equity, Redistribution, And Pressure-Dependent Demand. Water Resources Research, V.34, N. 7, P. 18436-1850, Jul.1998.
[3]Gamen, L. O .; Martinez, C. B .; Viana, E. M. F. And Nascimento, J. F. Calibration Of A Model Of Water Supply System Using Epanet. . In: IBERO-AMERICAN SEMINAR ON SUPPLY AND DRAINAGE SYSTEMS - SEREA, XI., 2012, Coimbra. ANAIS ... Department Of Civil Engineering Of The University Of Coimbra - Coimbra, Jun. 2012. P. 10. 1 CD-ROM
[4]Goulart, T.D.C (2015) Improvement Studies Of Calibration Model Employing Genetic Algorithm And Application In Water Distribution Network Of Cambui (MG). Dissertation (Master In Environment And Water Resources) - Federal University Of Itajubá. Advisor: Fernando Das Graças Braga Da Silva. [5]. Nasirian, A .; Maghrebi, M. F .; Yazdani, S. Leakage Detection In Water Distribution Network Based On A New Heuristic Genetic Algorithm Model. Journal Of Water Resource And Protection, N. 5, P. 294-303, Dez./Jan. 2013.
[6]Rocha, V.A. G. M .; Araújo, J. K .; Castro, M.A. H .; Costa, M. G .; Costa, L, H, M. Comparison Between RNA, AG And Migha In The Determination Of Roughness Through Calibration Of Hydraulic Networks. Brazilian Journal Of Water Resources, RBRH, V.18, N. 1, P. 125-134, Jan./Mar. 2013. Available At: <Http://www.Abrh.Org.Br/Sgcv3/Index.Php?PUB=1&ID=97&SUMARIO=1495>. Accessed On: 03 Sep. 2014.
[7] Salvino, M. M .; Gomes, H. P .; Carvalho, P. S. O .; Rocha, N. B. S. Iterative Model Of Calibration Of Water Supply Networks With A View To Rehabilitation. In: IBERO-AMERICAN SEMINAR ON SUPPLY AND DRAINAGE SYSTEMS - SEREA, XI., 2012, Coimbra. ANAIS ... Department Of Civil Engineering Of The University Of Coimbra - Coimbra, 2012. P. 15. 1 CD-ROM
[8]Santos, J. (2016) Study Of Calibration Model For Adjustment Of Roughness, Demand And Leak Parameters For Water And Energy Efficiency In Water Supply Networks. Case Study In São Lourenço - MG. Dissertation (Master In Energy Engineering) - Federal University Of Itajubá
[9] Silva, F. G. B. Studies Of Calibration Of Water Distribution Networks Through Genetic Algorithms. 2003. 234 F. Thesis (Doctorate In Hydraulics And Sanitation) - School Of Engineering Of São Carlos, University Of São Paulo, São Carlos, SP.
[10]Silva, F. G. B .; Barros, R. M .; Lamoglia, H.A .; Ribeiro, D. L. C. Initial Calibration Studies Of Water Distribution System - São Lourenço - MG, Brazil. In: WORLD ENVIRONMENTAL AND WATER RESOURCES CONGRESS 2013: SHOWCASING THE FUTURE, 2013, Cincinnati, Ohio,
Application of Routine Calibration of Real Water Supply ... F. Das Gra¸cas Braga Da Silva et al.
USA. Anais ... Journal Of Water Resources Planning And Management (ASCE) - Cincinnati, Ohio, USA, 2013. P. 7.1 CD-ROM
[11]. Tucciarelli, T; Criminisi, A.; Termini, D. Leak analysis in pipeline systems by means of optimal valve regulation. Journal of Hydraulic Engineering, v.125, n. 3, p. 277-285, mar. 1999. Disponível
em:<http://ascelibrary.org/doi/abs/10.1061/%28ASCE%290733-9429%281999%29125%3A3%28277%29>. Acesso em: 10 nov. 2014.
[12]Walski, T. M. Case study: pipe network model calibration issues. Journal of Water Resources Planning and Management, ASCE, v.112, n. 2, p. 238-249, abr. 1986.
, 1999, pp. 281–304.
Application of Routine Calibration of Real Water Supply ... F. Das Gra¸cas Braga Da Silva et al.