Volume 2, Issue 2, 2015
157 Available online at www.ijiere.com
International Journal of Innovative and Emerging
Research in Engineering
e-ISSN: 2394 - 3343 e-ISSN: 2394 - 5494
Two Phase Flow Analysis for Vertical Pipe
Suraj P. Nagabhushana
1, Prakash Thorat
1, Gaurav Thombre
1, Sanjay Rukhande
21. Students of Department of Mechanical Engineering, FCRIT, Vashi, Navi Mumbai 2.Assistant Professor, Department of Mechanical Engineering, FCRIT, Vashi, Navi Mumbai
Email: 1 [email protected], 2 [email protected]
ABSTRACT:
Multiphase flow, the simultaneous flow of more than one phase, occurs in various facets of engineering. In the operation of fluid energy conversion systems, such as boilers and nuclear reactors, two-phase flow occurs by design or can occurs in an accident situation (LOCA). In order to design a system or to prevent such systems from accident, analysis of two-phase flow is very important. In this paper identification of the flow regimes in the vertical section of an emergency condenser channel having diameter 0.0452m and length 13.4196m using map developed on works of Taitel and Dukler and Ishii and Hewitt and Roberts map. The vertical section of the channel was divided into two nodes having length of 0.21m. The input data provided by NPCIL was analyzed to determine flow regimes. A code was developed based on the conditions established by the maps aforementioned and the regimes were indentified. The output was plotted in the form of graphs. The regimes obtained from the code were corroborated using internationally accepted standard Relap5 code output.
Keywords: Emergency condenser channel; Regimes; Relap5; Hewitt and Roberts map.
I. INTRODUCTION
In the operation of fluid energy conversion systems, such as boilers and nuclear reactors, two-phase flow (liquid and gas) phenomenon occurs by design or can happen in an accident situation. Presently, almost all the fluid energy conversion systems use water or water and steam as working fluid. Consequently, the ability to accurately predict the regime in a steam-water flow is important in the design of such systems.
In single-phase flow, flow geometry is always known and velocity distribution, pressure distribution etc. are easy to determine either experimentally or theoretically. Whereas in two-phase flow conditions, geometry of the inter-phases is not a defined property, but is rather a part of the solution of the flow field. Flow distributions take on some commonly observed flow structures, which are defined as two-phase flow regime or pattern that have particular identifying characteristics. Identifying these regimes is of paramount importance to calculate pressure drops or to predict dry out point. It can also be used for safety analysis.
Various maps were studied to help identify flow regimes. Hewitt and Roberts[1], Taitel and Dukler[3], Mundhane et. al.[3], Baker[3] and flow regime map based on works of Taitel and Dukler and Ishii[2] for vertical and horizontal channels. Hewitt and Roberts map was chosen for vertical pipes. The map of Hewitt and Roberts was developed for air-water mixture at close to atmospheric pressure, and for steam–water mixtures at 35-70 bars in small diameter (1-3cm) vertical tubes. The pressure in the experimental data ranged from 6.169 bar to 45.027 bar and the hydraulic diameter of the pipe is 4.52 cm[4].
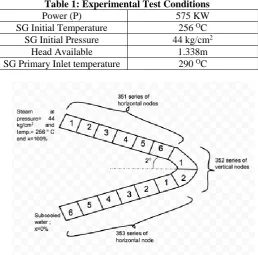
158 The experimental test conditions are shown in table I
Table 1: Experimental Test Conditions
Power (P) 575 KW
SG Initial Temperature 256 OC SG Initial Pressure 44 kg/cm2
Head Available 1.338m
SG Primary Inlet temperature 290 OC
Fig 1. Emergency Condenser Channel
III. METHODOLOGY
The input provided consisted of pressure, mass flux, area of channel, hydraulic diameter, fluid temperature and void fraction values from time t = 0 sec to t = 23000 sec at time step of 10 for node 352-01 and 352-02. The Figure 2,3,4 and 5 shows the graphical representation of the input data.
Fig 2. Mass Flow rate vs time (input parameter for node 352-01)
Volume 2, Issue 2, 2015
159 Fig 4. Temperature of fluid vs time (input parameter
for node 352-01)
Fig 5. Void Fraction vs time (input parameter for node 352-01)
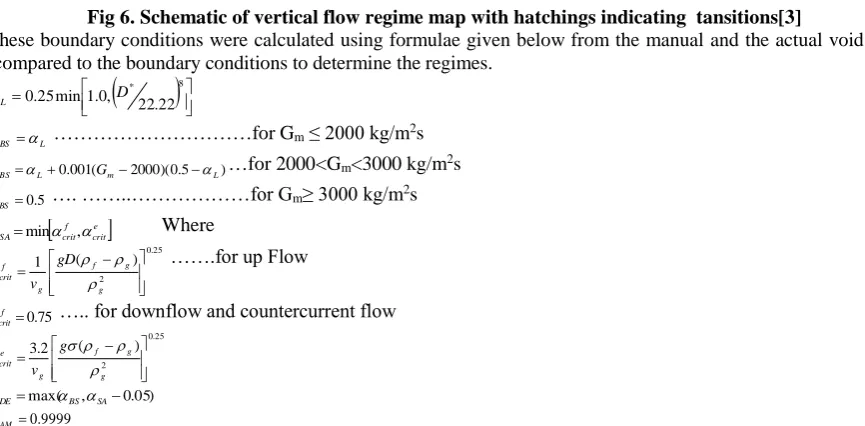
In order to calculate parameters necessary for finding flow regimes, steam properties at different temperature and pressures are required. A program was written to calculate steam properties at various pressures [5]. To determine regimes using map developed on the works of Taitel and Dukler and Ishii, boundary condition for the regimes were calculated and the program was written to obtain flow regime. Fig. 6 below shows the boundaries that segregate different regimes.
Fig 6. Schematic of vertical flow regime map with hatchings indicating tansitions[3]
These boundary conditions were calculated using formulae given below from the manual and the actual void fraction was compared to the boundary conditions to determine the regimes.
* 8
22 . 22 , 0 . 1 min 25 . 0 D L L BS
………for Gm ≤ 2000 kg/m2s
) 5 . 0 )( 2000 ( 001 .
0 m L
L
BS G
…for 2000<Gm<3000 kg/m2s
5 . 0
BS
…. ……..………for Gm≥ 3000 kg/m2s
e
crit f crit
SA
min , Where
25 . 0 2 ) ( 1 g g f g f crit gD v
…….for up Flow
75 . 0 f crit
….. for downflow and countercurrent flow
25 . 0 2 ) ( 2 . 3 g g f g e crit g v ) 05 . 0 , max(
BS SA
DE
9999 . 0 AM
160 Fig 7. Hewitt and Roberts flow regime map[18]
2
131 . 0 454 . 0 376 .
2 x x
y ………...…equation for C1
2
3817 . 0 59 . 2 6746 .
2 x x
y ………..equation for C2
2
334 . 2 253 . 17 895 .
27 x x
y ……....equation for C3
2
4928 . 1 278 . 13 648 .
29 x x
y ……….equation for C4
Where
x
log(
li
l2)
The value of y was obtained from the above equation and was compared with
log(
vi
v2)
to determine the regime.IV.NOMENCLATURE
Symbol Name Units
Void fraction -
l
Density of liquid Kg/m3
v
Density of vapor Kg/m3
m
G Mass flux Kg/m2s
v
i Superficial velocity
of vapor
m/s
l
i Superficial velocity
of water
m/s
D Diameter of pipe m
Vg Velocity of gas m/s
Vl Velocity of liquid m/s
V. RESULT AND DISCUSSION
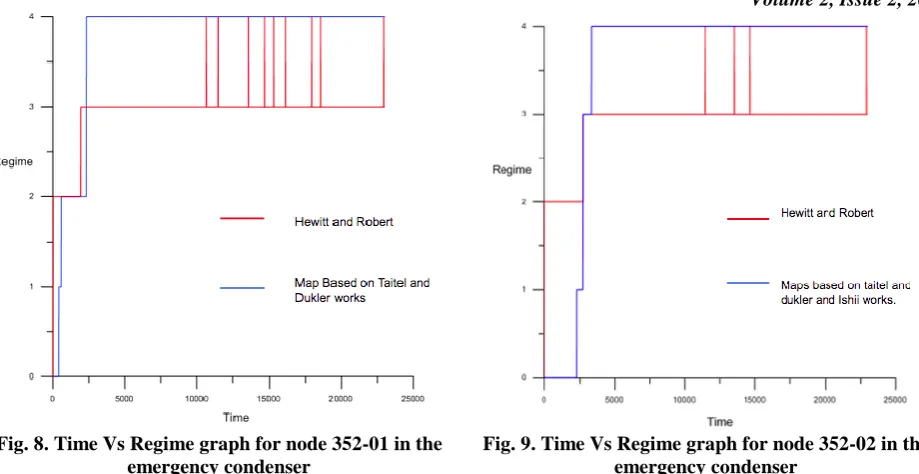
The results obtained were plotted in the form of graph with time on x-axis and regime on y-axis. The regimes were designated numbers to help plot graph.
0 – Sub-cooled flow 1 – Bubbly flow 2 – Slug flow
3 – Slug-annular transition flow 4 – Annular mist flow
5 – Mist pre CHF (MPR) flow
Volume 2, Issue 2, 2015
161 Fig. 8. Time Vs Regime graph for node 352-01 in the
emergency condenser
Fig. 9. Time Vs Regime graph for node 352-02 in the emergency condenser
Fig. 8 shows output of node 352-01 and fig. 9 shows output of node 352-02. The blue lines indicate the output based on the map shown in fig. 7 and the red lines indicate the output based on the map shown in fig. 6. The output from the program developed using the map shown in fig. 6 (blue lines) shows that the flow is in annular mist regime for major portion of time which is in accordance with the RELAP5 output as shown in fig. 8 and fig. 9. But it reaches regime 4 at about 3000th second. It can be seen from fig. 8 and fig. 9 that the Hewitt and Roberts map predicts major region of the flow to be in slug-annular transition, while the code written based on the map developed from works of Taitel and Dukler and Ishii, gives the output as regime 4. However, it does go to regime 4 at certain instances showing that the values are very close to the boundary of regime 3 and 4.
VI.CONCLUSION
Map developed on the works of Taitel and Dukler and Ishii tends to give better results than Hewitt and Roberts map in terms of regime identification. Hewitt and Roberts map gives satisfactory results as slug-annular transition and annular-mist regimes are very close. The map of Hewitt and Roberts was obtained for air-water mixture at close to atmospheric pressure, and for steam–water mixtures at 35-70 bars in small diameter (1-3cm) vertical tubes. The operating condition ranged from 6.169 bar to 45.027 bar and the diameter of the pipe is 4.52 cm that are slightly different from the condition based on which the map was developed. This gives rise to errors.
The boundaries that separate the regimes in the map are designated by lines. This means that there is a sharp change of regime when the values go beyond any boundary. This does not happen in practice. The change of regimes occurs over a range of values and is not sudden in nature. Hence, values around the boundaries that separate the regimes cannot be accurately classified into any regime. As seen in Fig. 8 and Fig. 9 the regimes (red line) oscillates between 4 and 3 which shows that the values lie around the boundary separating regime 3 and 4 which.
The error in the result is due to approximation of values while calculating them. Two-phase flow parameters are very sensitive in nature and even changes in decimal values can produce changes.
However, the results produced by both the codes are satisfactory in nature. Since the map developed on the works of Taitel and Dukler and Ishii works on void fraction, it can be applied to a wider range of applications; however, implementation of this map is complicated. Hewitt and Roberts map works on momentum fluxes that are easy to calculate but are limited to the operating condition based on which the map was developed.
ACKNOWLEDGMENT
We would like to thank Mr. Mukesh Singhal (NPCIL) and Mr. SK Yadav (NPCIL) for providing us with an opportunity to work with them and for providing experimental data and for validating our code. We would also like to thank Mr. Sanjay Rukhande for guiding us well throughout the project.
REFERENCES
[1] G.W. Hewitt, “Two-Phase Flow Patterns and Their Relaptionship to Two-Phase Heat Transfer,” Heat Transfer And Fluid Flow Service Harwell and National Engineering Laboratory, England, Vol 1, 1997.
[2] “Relap Code manual” (provided by NPCIL)
[3] Wolverine Inc., Engineering Thermal Innovations, “ Engineering data book III,” chapter 12. [4] “PDHRS experimental set-up manual” (provided by NPCIL)
162 [15]N.B. Vargaftik, B.N. Volkov, and L.D. Voljik, “ International Tables of the Surface Tension of Water,” Moscow
Aviation Institute, Moscow, U.S.S.R.
[16]M.M.Awad, “ Two-Phase Flow”, Chapter 11, InTech.
[17]Madhavi V Sardeshpande and Vivek V Ranade, “ Two-phase flow boiling in smalll channels: A brief review,” Industrial Flow Modelling Group, Chemical Engineering and Process Development Division, National Chemical Laboratory, Pune.
![Fig 7. Hewitt and Roberts flow regime map[18]………...…equation for C1](https://thumb-us.123doks.com/thumbv2/123dok_us/8873622.1815526/4.595.217.389.55.225/fig-hewitt-roberts-flow-regime-map-equation-c.webp)