Mechanical properties and Durability Properties of Concrete with
Partial Replacement of Cement by Hypo Sludge
Hepzibah A
1, Ranjith Kumar M G
21,2
M.E Student, Department of Civil Engineering, Ambal Professional Group of Institutions, Coimbatore
---***---Abstract –
The global consciousness of creating a lesspolluted world and the best utilization of waste is gaining momentum. Many efforts are taken to reduce the production of CO2 that plays a major role in the environmental pollution. There are lots of environmental impacts of cement in our ecology. Cement industry creating environmental problem by emission of CO2 during manufacturing of cement. The environmental problem increase day today due to exponential demand of Portland cement. Today researchers are more focusing towards the environmental issues globally. On other side some industries like paper industries, steel industries leaving the waste material into the environmental directly or it can use for landfill. One solution to this crisis lies in recycling waste into useful products to replace the natural/ commercial products which will reduce the economic and environmental problem of waste disposal and also the reduce the depletion of natural resources. The best practical way of recycling these wastes is to use in civil engineering constructions. In this project eco friendly cement may be obtained by certain low cost waste material. Such waste material like hypo sludge is produced from paper industry. In this project, hypo sludge is used in M30 grade of concrete by replacing cement 10%,15%,20%,25% and 30% by weight and compare with conventional M30 grade of concrete. Due to high alkalinity of concrete it has always been susceptible to acid attack. This study represents the strength and durability properties of hypo sludge concrete.
Key words: Durability , mechanical properties, hypo
sludge, M30, supplementary cementitious material.
1. INTRODUCTION
Eco friendly concrete is a concept of thoughtful environs into concrete considering every aspect from raw materials manufacture over mixture design to structural design, construction, and service life. Eco friendly concrete is very cheap to produce because waste products are used as a partial substitute for cement, charges for the disposal of waste are avoided, energy consumption in production is lower and the durability also good in condition. Due to green awareness the world is increasingly turning to researching properties of industrial wastes .Locally available, salvaged, re-furnished or re-manufactured, Reusable or recyclable materials are used in this concrete. One of the main causes of deterioration in concrete structures is the
chemicals that may be found in nature. Calcium, sodium, magnesium and ammonium sulphates are in increasing order of hazard harmful to concrete as they react with hydrated cement paste leading to expansion, cracking, spalling and loss of strength. About 300 kg of sludge is produced for each tone of recycled paper and over 300 million tonnes of wastes per annum is produced from industrial wastes. The quantity of sludge varies from mill to mill. The amount of sludge generated by a recycled paper mill is greatly dependent on the type of furnish being used and end product is used as an alternative material for the concrete and it is considered as a supplementary cementitious material. The objectives are to mix these materials traditionally to make concrete that is easy to transport, place, compact, finish and to give a strong and durable product. The main reason to take hypo sludge as a replacement material for cement is to it contains carbon dioxide as well as equal % of OPC chemical composition and silicate are also present in these hypo sludge, its increase the setting time and strength of concrete. So it helps to reduce the environmental pollution.
2. LITERATURE REVIEW
2.1 Advancement in physical properties of hypo
Sludge concrete
Sludge based concrete shows better performance in strength properties compared to conventional concrete 2. To determine compressive strength and flexural strength, various replacements of sludge in cement has done. After 28 days curing, the maximum compressive strength and flexural strength with 30% replacement are 33.69% and 13.09% more than conventional concrete 3. It was found that sludge based concrete when immersed in Acid solutions has better properties with 10% replacement of concrete.
2.2 Structural Performance of concrete by
Partial Replacement of Cement with Paper
Waste
concrete increases in 10% replacement and with 20% is equivalent but decreasing in 30%.
2.3 Ingenious Use of Hypo Sludge in M25
Concrete
The density of cube blocks decrease with the use of hypo sludge and about 26.1% weight is reduced in comparison with normal brick by the use of 20% paper waste sludge and 20% POFA and the bricks with adequate strength characteristics can be developed by incorporating 20% hypo sludge and 20% POFA which have potential to serve as masonry unit elements. The modulus of elasticity decreases with increased percentage of hypo sludge but the extent of decrease is less with thermal industry waste or with pozzolanic addition. Also the modulus of elasticity for cylinder increases with 10% hypo sludge replacement.
3. MATERIALS
3.1 CEMENT
[image:2.595.307.566.324.409.2]Cement is a binder, it is a substance which sets and hardens independently, and can bind other materials together. The most important use of cement is the production of mortar and concrete- the bonding of natural or artificial aggregates to form a strong building material which is durable in the face of normal environment effects. The Ordinary Portland cement (Grade 53)conforming by IS:8112-1989.
Table 1-properties of cement
S.no Properties of cement Result
1. Grade of cement 53
2. Consistency 33%
3. Specific gravity 3.15
4. Compressive strength 48.45N/mm2
5. Initial setting time 30 min 6. Final setting time 600 min
3.2 Fine Aggregate
[image:2.595.30.288.471.615.2]Fine aggregate is naturally occurring granular material composed of finely divided rock and mineral particles. The most common constituent of sand is silicon dioxide, usually in the form of quartz. Fine aggregate is used in the particle in the range termed as sand grain. Aggregates most of which passes through 4.75mm IS sieve is used. It was conformed by analysing various tests and it is Zone I as per IS 383:1970.
Table 2-Properties of fine aggregate
S.no Properties Result
1. Fineness modulus 4.67% 2. Specific gravity 2.6 3. Water absorption 1.0%
4. Gradation Zone I
3.3 Coarse Aggregate
[image:2.595.309.567.548.716.2]Aggregates are the most mined mineral in the world. The aggregates serves as a reinforcement to add strength to the overall composite material. Coarse aggregates of size 20mm is sieved and used.
Table 3-properties of coarse aggregate
S.no Properties Result
1. Fineness modulus 13.7% 2. Specific gravity 2.8 3. Water absorption 0.5%
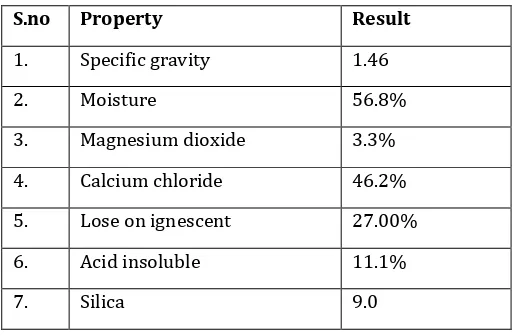
3.4 Hypo Sludge
Hypo sludge is the waste which is collected from paper industry. Hypo sludge contains calcium and calcium chloride and minimum amount of silica. Hypo sludge behaves like cement because of high content of CaO and CaCl2 and considerable presence of SiO2 and MgO. This
silica and magnesium improve the strength and setting of concrete.
Table 4- properties of hypo sludge
S.no Property Result
1. Specific gravity 1.46
2. Moisture 56.8%
3. Magnesium dioxide 3.3% 4. Calcium chloride 46.2% 5. Lose on ignescent 27.00% 6. Acid insoluble 11.1%
Fig 1- Hypo Sludge
Table 5-Comparison of cement and hypo sludge
S.n
o Constituent Cement (%) Hypo (%) sludge
1. Lime 62 46.2
2. Silica 22 9
3. Alumina 5 3.6
4. Magnesium 1 3.3
5. Calcium sulphate 4 4.05 6. Loss on ignition 2.82 38.26
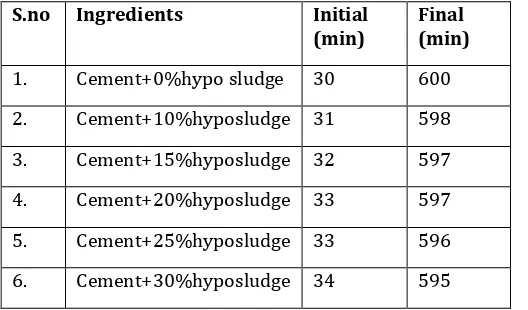
Table 6:Setting time for cement and hypo sludge
S.no Ingredients Initial
(min) Final (min)
1. Cement+0%hypo sludge 30 600 2. Cement+10%hyposludge 31 598 3. Cement+15%hyposludge 32 597 4. Cement+20%hyposludge 33 597 5. Cement+25%hyposludge 33 596 6. Cement+30%hyposludge 34 595
3.5 Water
Water is an important ingredient of concrete as it is actually participates in the chemical reaction with cement. So it helps to from the strength giving cement gel, the quantity and quality of water is required to be looked carefully. Water cement ratio is used as 0.45
4. Mix Proportions
The concrete mix of M30 grade was designed as per IS 10262:2009 and it was used as to prepare the samples.
Table 7-Mix proportions
MIX CEMENT(k g/m3)
HYPO SLUDGE
(kg/m3)
F.A
(kg/m3)
C.A
(kg/m3)
WATER
(kg/m3)
0% 425 0 684 1152 191
10% 382 42.5 667 1123 191
15% 361 63.75 660 1112 191
20% 340 85 650 1096 191
25% 318 106 643 1084 191
30% 297 128 634 1086 191
5. Test on Fresh concrete
5.1 Slump cone
[image:3.595.30.294.434.589.2]The concrete slump test is used for the measurement of a property of fresh concrete. The test is an empirical test that measures the workability of fresh concrete. More specifically, it measures consistency between batches. The test is popular due to the simple procedures. The slump cone result is a measure of the behaviour of a compacted inverted concrete under the action of gravity.
Table 8- Slump results
% of replacement Slump cone value (mm)
0% 75
10% 76
15% 76
20% 78
25% 78
30% 78
5.2 Compaction factor
Compacting factor of fresh concrete is done to determine the workability of fresh concrete by compacting factor test as per IS:1199-1959. The degree of workability of concrete depends on the values of test results of compacting factor test.
Table 9-Compacting factor results
% replacement Compaction factor
0% 0.91
15% 0.90
20% 0.88
25% 0.88
30% 0.87
6. Mechanical properties of concrete
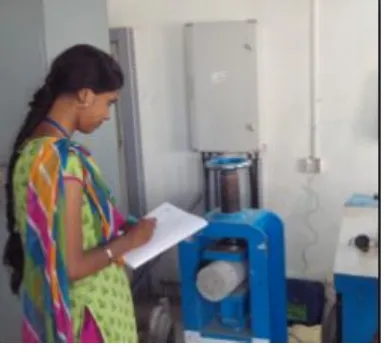
6.1 Compressive strength of concrete
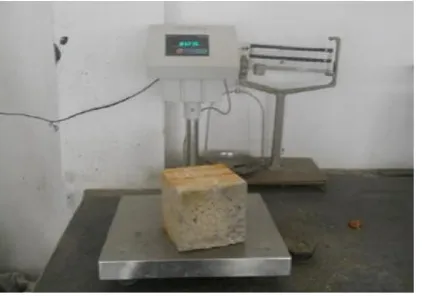
[image:4.595.332.541.108.227.2]The compressive strength of concrete is one of the most important and useful properties of concrete. It is generally determined by testing cubes of size 150 x 150 x 150 mm that was done in the lab. In this test, the cubes are subjected to compressive force in a compression testing machine and the ultimate load at which the failure occurs is noted. Then the compressive stress is ultimate load by area exposed to load and stress value is obtained in N/mm2.
[image:4.595.55.299.343.490.2]Fig 2-Testing of cube
Table 10-Compressive strength of concrete
Type of
specimen 7 days(N/mm
2) 28 days
(N/mm2)
Conventional 23.3 35.5
10%
replacement 24 36.9
15% 25.6 38.5
20% 20.3 30.7
25% 19.2 28.6
30% 18.5 27.8
0 5 10 15 20 25 30 35 40 45
0% 10% 15% 20% 25% 30%
7 days 28 dasy
Chart1- Compressive strength at 7 and 28 days
6.2 Split tensile Strength of concrete
Splitting tensile strength test on concrete cylinder is a method to determine the tensile strength of concrete. The tensile strength of concrete is one of the basic and important properties which greatly affect the extent and size of cracking in structures. This test is carried out in a cylindrical specimen of 150 mm diameter and 300 mm length. The cylindrical specimen is placed horizontally between the loading surface of a compression-testing machine and the load is applied until failure of cylinder occurs along the vertical diameter. The split tensile strength is given by the formula 2P/ (ΠDL) and the stress value is obtained in N/mm2.
Fig 3-Testing of cylinder
Table 11-Split tensile strength
Type of
specimen 7 days (N/mm
2) 28
days(N/mm2)
Conventional 2 2.44
10% 1.48 2.44
15% 2.29 3.7
[image:4.595.34.556.376.797.2] [image:4.595.342.534.438.617.2]25% 1.43 2.1
30% 1 1.49
0 0.5 1 1.5 2 2.5 3 3.5 4
0% 10% 15% 20% 25% 30%
East West
Chart2 -split tensile strength at 7 days and 28 days
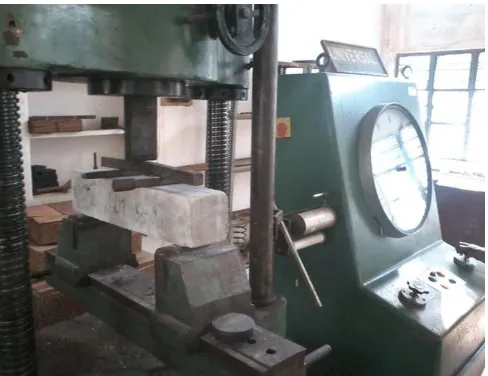
6.3 Flexural Strength of concrete
It is generally determined by testing prisms of size 500mm x100mm x 100mm that was done in the lab. In this test, the prisms are subjected by applying the load of 1.8kN (180kg/min). Flexural test is intended to give the flexural strength of concrete in tension. . The modulus of rupture is determined by testing prisms with four point loading in N/mm2. For 100mm specimens, the load shall
[image:5.595.44.281.78.307.2]be increased until the specimen fails and the maximum load applied to the test shall be recorded. The appearance of the fracture faces concrete and any unique features in the type of failure shall be noted.
[image:5.595.37.281.495.683.2]Fig 4 Testing of prism
Table 12-Flexural strength
Type of
specimen (N/mm28 days 2) days(N/mm90 2)
Conventional 4.83 5.36
10% 4.59 4.62
15% 4.32 4.48
20% 3.84 4.02
25% 3.42 3.65
30% 2.85 2.98
0 1 2 3 4 5 6
0% 10% 15% 20% 25% 30%
28 days 90 days
Chart 3-Flexural strength at 28 days and 90
days
7. Durability Properties of Concrete
The durability properties determine the chemical actions on concrete. The durability of concrete depends largely on the movement of water and gas enters and moves through it. The permeability of concrete is directly related to the porosity.
7.1 Alkaline Attack
The alkali attack test was conducted for the concrete cube of size 150x150x150mm size. Concrete specimen is immersed in water and it should be cured for 28 days. After 28 days of curing, the specimens were weighed (W1) and the specimen immersed with 5% sodium
hydroxide by weight of water for acid test for 90 days. The pH was maintained throughout the period of 90 days. After 90 days, the specimen is taken out and it should be weighed as (W2). Then the compressive
strength of cube specimen should be noted at W1 and W2
Fig 5-alkali attack test
Table 13-% of mass losses in NaOH
S.no % replace ment
Weight of cubes cured in 28 days
Weight of cubes after acid
exposure at 90 days
%loss of weight
at 90
days
1. 0% 8.54 8.13 4.80
2. 10% 8.93 8.69 3.80
3. 15% 8.64 8.36 3.14
4. 20% 8.76 8.50 2.96
5. 25% 8.58 8.37 2.44
6. 30% 8.34 8.22 1.39
7.6 7.8 8 8.2 8.4 8.6 8.8 9
28 days 90 days
0% 10% 15% 20% 25% 30%
[image:6.595.42.547.37.800.2]Chart 4- weight loss at alkaline attack
Table 14-% losses of compressive strength NaOH
S.no %
replace ment
Strength of cubes at 28 days
Strength of cubes after
acid exposure at 90 days
%loss of strength at 90 days
1. 0% 37.2 31.4 15.5
2. 10% 36.4 31.1 15.8
3. 15% 35.8 30.2 16.6
4. 20% 34.9 28.2 19.2
5. 25% 32.8 26.8 19.3
6. 30% 30.4 23.8 21.7
0 10 20 30 40
0% 10% 15% 20% 25% 30%
28 days 90 days
Chart 5- strength loss of cubes in alkaline attack
7.2 Acid attack
The acid attack test was conducted for the concrete cube of size 150x150x150mm size. Concrete specimen is immersed in water and it should be cured for 28 days. After 28 days of curing, the specimens were weighed (W1) and the specimen immersed with 5%
[image:6.595.334.545.437.585.2]sulphuric acid and 5% hydrochloric acid by weight of water for acid test for 90 days. The pH was maintained throughout the period of 90 days. After 90 days, the specimen is taken out and it should be weighed as (W2).
Fig 6- Acid Attack
Table 15-% of mass losses in H2SO4
S.no %
replace ment
Weight of cubes cured in
28 days
Weight of cubes after
acid exposure at 90 days
%loss of weight
at 90 days
1. 0% 8.48 8.03 5.30
2. 10% 8.42 8.04 4.5
3. 15% 8.62 8.3 3.72
[image:6.595.63.262.448.576.2]5. 25% 8.24 8.03 2.54
6. 30% 8.17 8.07 1.22
7.6 7.8 8 8.2 8.4 8.6 8.8
28 days 90 days
0% 10% 15% 20% 25% 30%
[image:7.595.60.565.50.723.2]Chart 6-weight loss in H
2SO
4Table 16-% losses of compressive strength at 5%H2SO4
S.no % replace ment
Strength of cubes
at 28
days
Strength of cubes after acid
exposure at 90 days
%loss of strength
at 90
days
1. 0% 38 32.6 14.2
2. 10% 38.3 32.2 15.9
3. 15% 37.5 31.4 16.2
4. 20% 36.7 30.2 17.8
5. 25% 35.2 28.2 20.5
6. 30% 33.2 24.8 25.3
0 5 10 15 20 25 30 35 40 45
0% 10% 15% 20% 25% 30%
28 days 90 days
Chart 7-strength loss of cubes in H
2SO
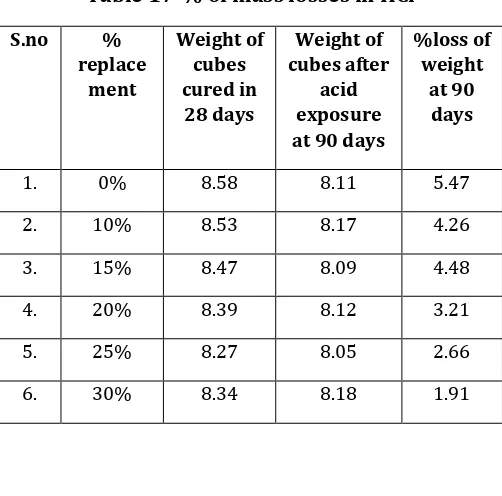
4Table 17-% of mass losses in HCl
S.no %
replace ment
Weight of cubes cured in
28 days
Weight of cubes after
acid exposure at 90 days
%loss of weight
at 90 days
1. 0% 8.58 8.11 5.47
2. 10% 8.53 8.17 4.26
3. 15% 8.47 8.09 4.48
4. 20% 8.39 8.12 3.21
5. 25% 8.27 8.05 2.66
6. 30% 8.34 8.18 1.91
7.7 7.8 7.9 8 8.1 8.2 8.3 8.4 8.5 8.6 8.7
28 days 90 days
0% 10% 15% 20% 25% 30%
Chart 8-weight loss in HCl
Table 18-% losses of compressive strength at
5%HCl
S.no %
replace ment
Strength of cubes at 28
days
Strength of cubes after
acid exposure at 90 days
%loss of strength at 90 days
1. 0% 38.2 32.4 15.2
2. 10% 37.9 32.1 15.3
3. 15% 37.4 31.3 16.3
4. 20% 36.9 30.7 16.8
5. 25% 35.8 29.6 17.3
[image:7.595.312.563.104.352.2]0 5 10 15 20 25 30 35 40 45
0% 10% 15% 20% 25% 30%
28 days 90 days
Chart 9-strength loss of cubes in HCl
7.3 Sulphate Attack
The sulphate attack test was conducted for the concrete cube of size 150x150x150mm size. Concrete specimen is immersed in water and it should be cured for 28 days. After 28 days of curing, the specimens were weighed (W1) and the specimen immersed with 5% disodium
[image:8.595.308.563.111.610.2]sulphate by weight of water for acid test for 90 days. The pH was maintained throughout the period of 90 days. After 90 days, the specimen is taken out and it should be weighed as (W2).
Table 19-% of mass losses in Na2SO4
S.no %
replace ment
Weight of cubes cured in
28 days
Weight of cubes after
acid exposure at 90 days
%loss of weight
at 90 days
1. 0% 8.96 8.69 3.01
2. 10% 8.87 8.63 2.71
3. 15% 8.75 8.52 2.63
4. 20% 8.53 8.33 2.34
5. 25% 8.5 8.28 2.59
6. 30% 8.57 8.37 2.33
7.8 8 8.2 8.4 8.6 8.8 9 9.2
28 days 90 days
0% 10% 15% 20% 25% 30%
[image:8.595.64.262.111.233.2]Chart 10-weight loss in sulphate attack
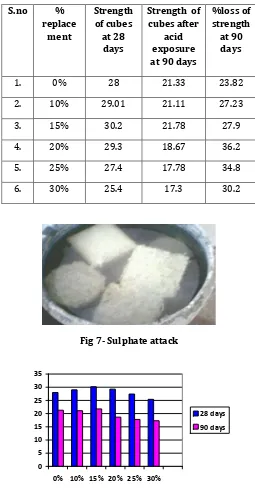
Table 20-% losses of compressive strength
S.no %
replace ment
Strength of cubes at 28
days
Strength of cubes after
acid exposure at 90 days
%loss of strength at 90 days
1. 0% 28 21.33 23.82
2. 10% 29.01 21.11 27.23
3. 15% 30.2 21.78 27.9
4. 20% 29.3 18.67 36.2
5. 25% 27.4 17.78 34.8
6. 30% 25.4 17.3 30.2
Fig 7- Sulphate attack
0 5 10 15 20 25 30 35
0% 10% 15% 20% 25% 30%
28 days 90 days
Chart 11-strength loss of cubes
7.4 Water Absorption
The 100 mm dia and 50 mm height cylinder after casting were immersed in water for 90 days curing. Then the specimen were taken and kept in oven dried for 24 hours at the temperature 110 ֯C until mass became constant and again weighed. This weight is considered as dry weight and it noted as W1 of the cylinder. After
taking W1, the cylinder should be kept in hot water for
3.5 hours at 85 ֯C. This weight is considered as W2 and is
[image:8.595.28.289.430.731.2]Water absorption = (W1-W2/W1) x100
Table 21-Water Absorption
% replacem
ent
Dry weight(W1)
Wet weight(W2
% water absorpti
on
0% 958.76 962.76 0.41
10% 940.17 950.32 1.07 15% 884.67 898.33 1.54 20% 863.67 888.33 2.86
25% 566 900.50 3.94
30% 870.23 910.54 4.32
0 1 2 3 4 5
0% 10% 15% 20% 25% 30%
90days
Chart 12- Water absorption
Fig 8-Setup of oven
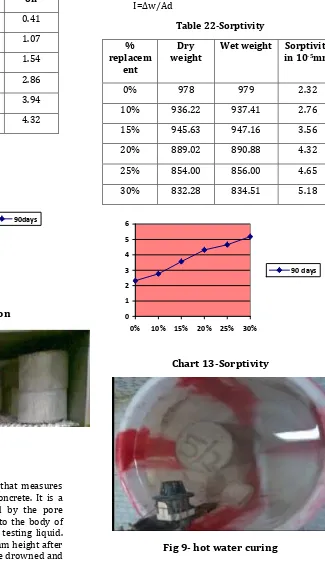
7.5 Sorptivity
The sorptivity of concrete is a quantity that measures the unsaturated flow of fluids into the concrete. It is a measure of the capillary forces exerted by the pore structure causing liquids to be drawn into the body of the material. Water is considered as the testing liquid. The cylinders of size 100mm dia and 50mm height after drying in oven at temperature 110 ֯C were drowned and the water level is not more than 5mm above the base of specimen and flow from the surface is prevented by sealing it properly with non- absorbent coating surface.
water on the specimen wiped out with a tissue and the weighing operation should complete within 30 minutes. S = I/t1/2
[image:9.595.217.542.166.728.2]Where, t= elapsed time in minutes I=∆w/Ad
Table 22-Sorptivity
% replacem
ent
Dry
weight Wet weight Sorptivity in 10-5mm
0% 978 979 2.32
10% 936.22 937.41 2.76 15% 945.63 947.16 3.56 20% 889.02 890.88 4.32 25% 854.00 856.00 4.65 30% 832.28 834.51 5.18
0 1 2 3 4 5 6
0% 10% 15% 20% 25% 30%
90 days
Chart 13-Sorptivity
Fig 9- hot water curing
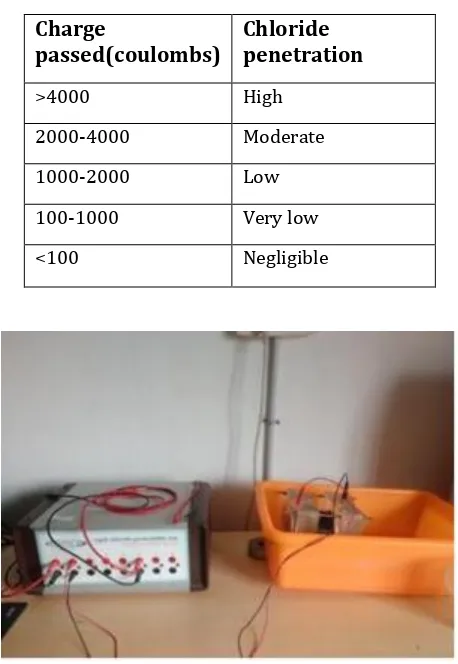
7.6 Rapid chloride Penetration Test
purposes. The LED display represents the voltage value across the concrete specimen. The specimen which is 50mm thick slices and 100mm dia cylinders and the process take during 6 hours at 30 min interval. The electric current passes through the concrete specimens. This cell consists of two chambers. NaCl solution concentration is filled in one chamber and in another chamber NaOH solution is taken. The chloride ions were forced to migrate through the centrally placed vacuum saturated concrete specimen under an impressed DC voltage of 60 Volts. It is more permeable when it has higher coulombs and it is less permeable when it has lower coulombs.
Q=900(Io+ I30+ I60+ I90 +………I300+ I330+ I360)
Where, Q= charge passed in coulombs
I0 =initial current when voltage is applied.
[image:10.595.306.567.112.292.2]It =current at t min after voltage is applied.
Table 23 Recommended values from ASTM C1202
Charge
passed(coulombs)
Chloride
penetration
>4000 High
2000-4000 Moderate
1000-2000 Low
100-1000 Very low <100 Negligible
Fig 10 Setup for rapid chloride penetration test
Table 24 chloride penetration test results
% replacement Chloride permeability(28 days)
Coulombs Remarks
0% 1018 Low
10% 1046 Low
15% 1076 Low
20% 1173 Low
25% 1218 Low
30% 1274 Low
8. CONCLUSION
8.1Mechanical properties:
Testing of cubes in compression testing machine with capacity of 1000 kN. The compressive strength of concrete increases as the curing period for M30 grade concrete and the
replacement of hypo sludge is done from 0%,10%,15%,20%,25% and 30%. The maximum compressive strength for 7 days and 28 days is achieved for 15% replacement of cement and starts decreasing in strength from 20% to 30%.
The maximum spilt tensile strength for 7 days and 28 days is achieved for 15% replacement of cement and starts decreasing in strength from 20% to 30%.
Flexural strength of the concrete increases till 15% replacement of hypo sludge in cement for 28 days and 90 days and starts decreasing in strength from 20% and 30%
8.2 Durability properties
Acid Attack
After 90 days, the percentage mass loss for hypo sludge is 5.30% and 5.47% in 5% sulphuric acid and hydrochloric acid for conventional concrete, in 10% replacement it is 4.5% and 4.26% and it continues decreases on other replacements.
[image:10.595.43.272.334.666.2]Alkaline Attack
Continuous decreases in compressive strength of hypo sludge cement concrete specimens prepared with 0% to 30% replacement by hypo sludge when cured by 5 % NaOH contain solution is 15.5 % to 21.7%
Sulphate Attack
It is identified that the maximum percentage reduction in compressive strength due to sulphates of M30 grade concrete is 27.9% with 15% replacement of hypo sludge and the minimum reduction takes in 10% replacement
Water Absorption
The water absorption of hypo sludge concrete shows lower water absorption than the conventional concrete.
For 90 days, 10% replacement with hypo sludge increases is found to be 1.07% for M30 an it shows a increasing trend on other replacements.
Sorptivity
The sorptivity of hypo sludge concrete shows lower sorptivity than the conventional concrete.
For 90 days, 10% replacement with hypo sludge increases is found to be 2.76% for M30 an it shows a increasing trend on other replacements.
Rapid chloride penetration test
Concrete with hypo sludge shows lesser chloride ion penetrability than the conventional sand concrete, which shows that lesser penetration with hypo sludge concrete.
Hence, it can be concluded that hypo sludge concrete is good enough to satisfy the requirements for compressive strength, split tensile strength, flexural strength and sorptivity. But it has failed to satisfy the durability requirements. The hypo sludge can be innovative supplementary cementitious material.
9. REFERENCES
Gambir.M.L. “Concrete Technology “Tata McGraw Hill Company, New Delhi.
Indian Standard code of Practice for plain and reinforced concrete.IS 456:2000, fourth revision, Bureau of Indian Standard, New Delhi.
Indian Standard recommended guidelines for concrete mix design, IS 10262-2009, Bureau of Indian Standards, New Delhi.
Indian Standard Specification for course aggregate and Fine aggregate from natural sources for concrete, IS 383:1970, Bureau of Indian Standards, New Delhi.
Indian Standard Specification For 53 grade ordinary Portland cement, IS 12269:1987, Bureau of Indian Standards ,New Delhi.
Structural performance of concrete in partial replacement of paper waste, Ram panth, Suresh pantil.”(IJETE), volume 1 , Issue 7, August 2014, ISSN 2348-8050.
Study of concrete involving use of waste paper sludge ash as partial replacement of cement. Sajad Ahmad,Rafiq Ahmad .(ISOR).Vol 3,Issue 11,November 2013
Structural performance and durability of concrete by partial replacement of hypo sludge Hari Krishnan, vidyasagar lal.
(ISJOR)Vol4, Issue no 12 ,ISSN:2319-6890,Dec 2015
Experimental investigation of partial replacement by industrial waste. Bala murgan, karthickraja ,IJERA ,ISSN :2248-9622,Vol 4,Issue 4,April 2014.
Flexural Strength of Beams by Partial Replacement of Cement With Fly ash and Hypo sludge in Concrete.Jayraj vinodsinhsolanki,Jayeshkumar Pitroda,
IJESIT,Vol 2,Issue1,January 2013.
Durability Aspects of standard concrete,
Vijaya sekhar Reddy, Ramana Reddy,
(IJSCER),Vol 2, ISSN 2319-6009.
ASTM C-1585, Standard test method for measurement of rate of absorption of water, American Society for Testing and Materials.
ASTM C-1202, Standard test method for electrical induction of concrete ability to resist chloride ion penetration, American Society for Testing and Materials.