Image Segmentation Using Random Walker and SOM Algorithm
Dr.Sreeja Mole S.S.
Professor, Department of ECE, CJITS, Janagon, India. Email: [email protected]
Article Received: 27 May 2018 Article Accepted: 30 August 2018 Article Published: 07 October 2018
1. INTRODUCTION
Image segmentation is an important process in object recognition, image fusion and registration, curve detection. It
divides an image into a series of non-overlapping regions in feature space. Currently, there have existed some
image segmentation approaches including histogram thresholding and clustering based methods. Histogram
thresholding is a group of simple techniques and applied to face recognition, gesture and hand-written digit
recognition[1]. Many clustering based approaches are based on statistical learning theory and the frequently used
ones involve vector quantization, mixed models, Markov random fields, region based methods, information
entropy based methods and Bayesian nets. Self-Organization Mapping (SOM) is kind of clustering approach and
encode original data with a compressing way and have been applied to image segmentation [2-3]. Spectral
clustering is a hot research point recently and behaves well in grouping of irregular distributed data [4-6]. However,
it has the computational complexity of O(n2) and is not suitable to many image segmentation problems. In order to
utilize the advantages of both spectral clustering and SOM, we propose a new multiscale spectral clustering
approach based on SOM model. It implements two processes: the encoding process by SOM and clustering
prototypes by multistage spectral clustering. The time complexity of ours is approximately O(mn), m is the number
of prototypes, which is far less than square complexity.
This paper is organized as follows. Section 2 introduces some basic notations of SOM. In Section 3 we discuss the
spectral clustering and point out its drawbacks. Section 4 presents our algorithm and gives a performance analysis.
Section 5 presents the comparison on image segmentation and Conclusion is present in section 6.
A B S T R A C T
This paper presents an extension of the random walker segmentation to images with uncertain gray values. Such gray-value uncertainty may result from noise or other imaging artifacts or more general from measurement errors in the image acquisition process. The purpose is to quantify the influence of the gray-value uncertainty onto the result when using random walker segmentation. In random walker segmentation, a weighted graph is built from the image, where the edge weights depend on the image gradient between the pixels. For given seed regions, the probability is evaluated for a random walk on this graph starting at a pixel to end in one of the seed regions. Spectral clustering receives wide attention in recent years since its efficiency in image segmentation and irregular data clustering. However, the applications of it in large scale data processing, such as web data categorization and image segmentation, are greatly restricted because of its O(n3) computational complexity. To address this problem, we propose a new effective scheme to greatly decrease the complexity while keep the clustering quality. The scheme adopts the Self- Organization Map (SOM) to encode the original data and then groups the obtained prototypes using multi scale spectral clustering proposed by us. We analyze and compare the performance of our approach with NJW and find that ours has less time consumption. Furthermore, we carry out an experiment on color image segmentation and results show that our approach behaves better than K-means algorithm.
2. RANDOM WALKER ALGORITHM
The random walker algorithmis an algorithm for image segmentation. In the first description of the algorithm, [1]
a user interactively labels a small number of pixels with known labels (called seeds), e.g., "object" and
"background". The unlabeled pixels are each imagined to release a random walker, and the probability is computed
that each pixel's random walker first arrives at a seed bearing each label, i.e., if a user places K seeds, each with a
different label, then it is necessary to compute, for each pixel, the probability that a random walker leaving the pixel
will first arrive at each seed. This computation may be determined analytically by solving a system of linear
equations. After computing these probabilities for each pixel, the pixel is assigned to the label for which it is most
likely to send a random walker. The image is modeled as a graph, in which each pixel corresponds to a node which
is connected to neighboring pixels by edges, and the edges are weighted to reflect the similarity between the pixels.
Therefore, the random walk occurs on the weighted graph (see Doyle and Snell for an introduction to random walks
on graphs [2]). Although the initial algorithm was formulated as an interactive method for image segmentation, it
has been extended to be a fully automatic algorithm, given a data fidelity term (e.g., intensity prior) [3]. The
Random Walker Segmentation output is shown in Figure 1.
Fig1.Random Walker Segmentation
3. SPECTRAL CLUSTERING
In recent years, spectral clustering has become a state-of-art technique in clustering analysis and image
segmentation. It constructs an undirect graph whose vertexes are vectors and edges are the elements of the affinity
matrix of vertexes. Some famous approaches have been proposed by using the eigenvectors of Laplace matrix of
affinity matrices during past decade years. Perona and Freeman tried using the first eigenvector to cluster data but
failed in non-diagonal block affinity matrices. Shi and Malik argued to use first two smallest eigenvectors to solve
this problem and proposed the famous Normalized Cut (NCUT) approach for image segmentation [7]. Other
algorithms such as Scott and Longuet-Higgins algorithm (SLH), Costeira and Kanade algorithm have shown the
similar principle as above two algorithms. Recently, more attentions give the multi scale and random views of
degree is defined by the Euclidean distance of vertexes with local scattering information of data. Meila and Shi
have suggested to probe into spectral clustering from the random walks aspect[8]. The O(n3) complexity of spectral
clustering makes it difficulty in large application problems such as segmentation of high resolution images. Some
approaches have been proposed to improve the time efficiency. The most famous one is the spectral grouping using
Nyström method. This method in fact decreases sample capacity by sampling, thus may induce to two obvious
drawbacks. One is that all sampled vectors belong to same class. This may frequently happen when the distribution
of classes is unbalanced. Another is that vectors are misclassified due to misclassified sampled vectors, which takes
place in low SNR images.
3.1 SOM BASED MULTISCALE SPECTRAL CLUSTERING ALGORITHM
A. Local Variance Defined by K-Nearest Neighborhood
The local scattering degree of data varies with the neighborhoods of prototypes. Then it is necessary to consider the
scattering information in the distance between two vectors or prototypes. To do this, we use the vectors in the
K-Nearest Neighborhoods (KNN) of prototypes to estimate the local variance.
B. SOM Algorithm
This part presents a new multi scale spectral clustering algorithm based on SOM algorithm. It is divided into three
parts: First part is to encode all vectors using SOM; second is to compute the local variances of prototypes; third is
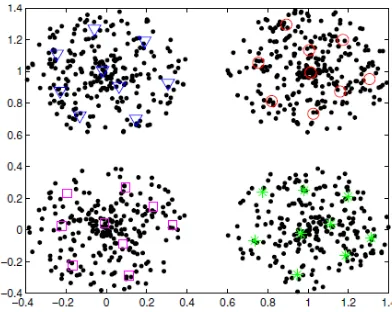
to label all prototypes by multi scale spectral clustering is shown in Figure 2.
Fig 2: The clustering results of 36 prototypes by spectral clustering
C. Complexity Analysis
The computational complexity of SOM based spectral clustering algorithm is analyzed and it can be divided into
three parts. The number of prototypes is pre-specified as m in SOM algorithm. The complexity in encoding stage is
O(mn) since we need compute the distance between vectors and prototypes. The complexity to compute the
variance is O(mnklogk). The complexity of spectral clustering is O(m2).Thus the complexity of our algorithm is
O(mn+mnklogk+m2). In common, we have k<<m and m<<n when n is a large number, at this case
D. Performance Analysis on Gaussian Distributed Data
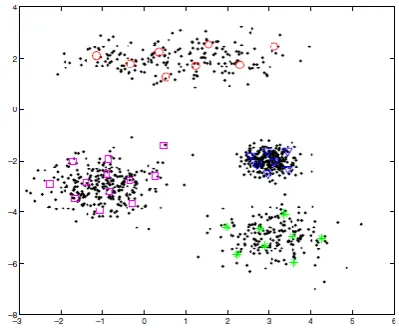
This part analyzes the computational efficiency of our algorithm by using several synthesized Gaussian distributed
data sets that involve 500, 800, 1000, 2000, 3000, 4000, 5000, 10000 vectors, respectively. Fig.3 presents the
distribution of test data and a clustering result of our algorithm. Fig.4 gives the time consumption comparison
between our algorithm and NJW[6]. In top subgraph, the neighborhood sizes in our algorithm change while the
number of prototypes is fixed. We find that the time consumption of ours with respect to neighborhoods with
different sizes is almost consistent. In bottom subgraph, the number of prototypes changes and the neighborhood
size is fixed. The time consumption increases with the growing number of prototypes. From these two subgraphs
our algorithm behaves better in computational efficiency than NJW algorithm.
Fig 3. The clustering result by our algorithm with 36 prototypes and k=10.
Figure 4 (a) and (b). Time Consumption of NJW and Proposed approach
The Figure 4(a) and 4(b) compares the time consumption of NJW and proposed algorithm. In top subgraph, the
number of prototypes is fixed and the neighborhood sizes change. Bottom subgraph shows the time consumption
with fixed neighborhood size and changing number of prototypes.
4. EXPERIMENTAL RESULTS ON IMAGE SEGMENTATION
Here experiment on color image segmentation have done in this paper. Color image segmentation is a process to
partition an image into a group of non-overlapping regions and is the preprocessing step for many applications such
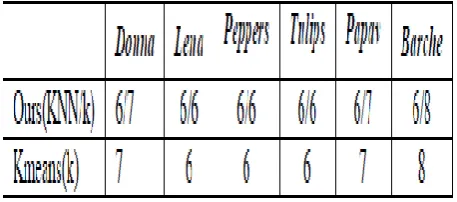
as object recognition, video analysis. Six color images were randomly selected for test and comparison and each
image contained 256×256 pixels. The initial parameters for every image were listed in Table I. In our algorithm, we
initialize 64 prototypes to represent the vectors in feature space. Fig.5, how the original images and the segmented
results by our approach and K-means algorithm. From these segmentation results we can find that our algorithm
can efficiently identify the object bound and present more clear details. The common spectral clustering has the
computational complexity of O(n2) in space and time. For a 256×256 image, it will produce a matrix with 216 rows
and 216 columns that easily makes memory overflow.
FIG 5.THE SEGMENTATION RESULTS ON STANDARD COLOR IMAGES
5. CONCLUSIONS
In order to improve the time efficiency of spectral clustering, this paper proposes a new clustering scheme based
SOM learning. SOM is used to encode the input vectors and decreases the data capacity for spectral clustering.
Analytical and experimental results have shown that our approach can efficiently reduce the computational
complexity. On the other hand, there is still a problem need to be settled, that is, how to determine the number of
prototypes for data sets with different capacity. Unsuitable number of prototypes may bring wrong clustering
REFERENCES
[1] R. C. Gonzalez, R. E. Woods and S. L. Eddins, Digital Image Processing Using MATLAB, 2nd ed, Prentice
Hall, New Jersey, 2010.
[2] T. Kohonen, Self-Organizing Maps, Springer-Verlag, New York, 1997
[3] M. M. Campos and G. A. Carpenter, S-TREE: self-organizing trees for data clustering and online vector
quantization, Neural Networks, vol.14, 2001, pp.505-525
[4] L. Zelnik-Manor and P. Perona, Self-Tuning Spectral Clustering, Advances in Neural Information Processing
Systems, 2004, pp.1601- 1608
[5] Sreeja Mole S S Athira V S, Anand J Dhas, “Brain Tumor Detection and Segmentation in MR images Using
GLCM and AdaBoost Classifier, International Journal of Scientific Research in Science, Engineering and
Technology Vol 1,pp.142-146, 2015.
[6] A. Y. Ng and M. I. Jordan and Y. Weiss, On spectral clustering: analysis and an algorithm, Neural Information
Processing Systems(NIPS),14, 2002
[7] J. Shi and J. Malik, Normalized cuts and image segmentation, IEEE_J_PAMI, 22(8), 2000, pp.888-905.
[8] M. Meila and Jianbo Shi, Learning segmentation by random walks, Neural Information Processing
Systems(NIPS),14, 2002
[9] Sreeja Mole, S.S., Rajeev V R, “FCM Algorithm for Medical Image Segmentation Using