
DOI
10.17219/acem/68901
Copyright
© 2018 by Wroclaw Medical University This is an article distributed under the terms of the Creative Commons Attribution Non-Commercial License (http://creativecommons.org/licenses/by-nc-nd/4.0/)
Address for correspondence
Elżbieta Lachert E-mail: [email protected]
Funding sources
None declared
Conflict of interest
None declared
Acknowledgements
The authors would like to thank Ms Krystyna Dudziak for her contribution and assistance.
Received on October 18, 2016 Reviewed on November 15, 2017 Accepted on February 9, 2017
Abstract
Background. The quality of platelet concentrates (PCs) is affected by preparation, storage, the type of con-tainer, and pathogen reduction technology (PRT). The Mirasol
®
Pathogen Reduction Technology (PRT) system (Terumo BCT Inc., Lakewood, USA), which uses riboflavin and ultraviolet (UV) light, has recently been proven effective against bacteria, viruses, parasites, and leukocytes.Objectives. The aim of the study was to evaluate the effect of the Mirasol
®
PRT system, based on riboflavin and UV light exposure, on the most common in vitro platelet quality parameters of PCs prepared from whole blood-derived buffy coats.Material and methods. The study included 15 trials (n = 15). For each trial, 2 PCs were used: 1 for treatment with the Mirasol
®
PRT system (M) and 1 for a control (C). In the M group, PCs were illuminated. In the C group, saline solution was added. PCs from groups M and C were stored at 20–24°C, with agitation. Samples were collected on days 1, 3 and 5 to determine platelet concentration, total platelet count/unit, mean platelet volume (MPV), power of hydrogen (pH), glucose and beta-thromboglobulin concentration (BTG), hypotonic shock response (HSR), aggregation, CD42b and CD62P expression, pCO2, and pO2.Results.No significant differences in HSR or CD42b expression were observed between groups M and C. All pH values were stable during the whole storage period (7.1–7.5). On storage day 1, CD62P expression in group C was significantly higher than in group M. In the Mirasol
®
group, significantly higher glucose consumption was noted on storage days 3 and 5. On day 5, a 2–3-fold increase in BTG was observed in both groups as compared to day 1; on day 5, BTG concentration was 32% higher in group M than in group C. On all storage days, pCO2 was comparable in groups M and C; lower pO2 values were reported for group M. Conclusions. In vitro results demonstrated that pH, HSR, aggregation, CD42b antigen expression, and MPV and platelet count parameters were comparable in groups M and C.Key words: pathogen, platelets, inactivation
Quality control of riboflavin-treated platelet concentrates
using Mirasol® PRT system: Polish experience
Elżbieta Lachert
1,A–D, Jolanta Kubis
1,A–D, Jolanta Antoniewicz-Papis
1,A–D, Aleksandra Rosiek
1,C, Jolanta Woźniak
1,B,C,
Dariusz Piotrowski
2,B, Zofia Przybylska
2,B, Agata Mikołowska
1,A–D, Susanne Marschner
3,E,F, Magdalena Łętowska
1 E,F1 Institute of Hematology and Transfusion Medicine, Warszawa, Poland 2 Regional Blood Transfusion Center, Warszawa, Poland
3 Terumo BCT Biotechnologies, Lakewood, USA
A – research concept and design; B – collection and/or assembly of data; C – data analysis and interpretation; D – writing the article; E – critical revision of the article; F – final approval of the article
Introduction
Blood and blood components have never been as safe as they are nowadays. Significant improvements have been made to safety through restricted donor selection, closed system preparation, implementation of higher sensitivity serological and molecular biology tests, and the exclusive use of quarantine plasma. Additionally, the implementa-tion of the Quality Assurance (QA) system has greatly contributed to the higher quality of blood components.1
Regardless of those preventive measures, blood compo-nents are still not safe enough. We must constantly be pre-pared for new and emerging pathogens, pathogens for which no tests are yet available or for which tests are not routine-ly used. Such was the case in the 1970s, when thousands of hemophilia patients were infected with hepatitis C virus (HCV) when they were administered coagulation factor concentrates which were not subjected to inactivation.2
There is also another factor that needs to be considered as an additional risk of disease transmission, namely, migra-tion. As a result of migration, diseases like malaria, Chagas disease, or West Nile virus, which are characteristic of one geographical region, may also appear in other geographical locations. The original sources of these pathogens are Af-rica, Mediterranean countries and occasionally Europe, but in the period of 1999–2003, these viruses spread to the terri-tory of the United States and Canada, where the transfusion transmissible infection (TTI) risk for West Nile virus, for ex-ample, was calculated at 1.46–12.33 per 10,000 donations and resulted in the immediate implementation of screening tests (polymerase chain reaction – PCR) for single donations in all American blood banks.3,4
Not only viruses are a potential threat to blood safety. Statistical data regarding post-transfusion adverse reac-tions demonstrates a high risk of bacterial contamina-tion for platelet concentrates (PCs) that are mostly stored at room temperature, which favors bacterial proliferation. Bacteria-related adverse reactions following PC transfu-sions have been estimated at 1/2000 transfutransfu-sions.5
This explains why pathogen inactivation methods which were previously in use only for plasma fractionation are now becoming increasingly popular for inactivation in cellular blood components. Inactivation methods promise addition-al protection both from addition-already known infectious agents and those yet unrecognized but which may pose a threat to safe
blood supply. One such method is the Mirasol® Pathogen
Reduction Technology (PRT) system (Terumo BCT Inc., Lakewood, USA) for pathogen inactivation in plasma and platelet concentrates. The system offers a nucleic acid-targeted pathogen reduction technique based on ultravio-let (UV) light and riboflavin. Riboflavin molecules form complexes with the nucleic acid of the pathogen. Exposure to UV light activates riboflavin causing a chemical altera-tion in the funcaltera-tional groups of the nucleic acid (primary guanine bases), rendering the pathogen unable to replicate. Although riboflavin is most effective for lipid-enveloped
viruses, reports in the literature also describe reductions for the non-enveloped parvovirus B19, as well as for some bacteria and protozoa. Multicenter trials by Cardo et al. have shown the riboflavin method to be effective
for kill-ing Leishmania and other emerging plasma and platelet
pathogens (5–7 log reduction).6,7 Numerous studies have also confirmed this method to be effective for white blood cell inactivation. Clinical trials have proved the safety
of Mirasol® PRT system-treated blood components and
lack of neoantigen formation.8–11
Nowadays, the Mirasol® PRT system is in routine use
in many European countries. In Poland, the system has been used since 2009 for pathogen inactivation in plasma, but in some regional blood transfusion centers also for PCs. In our country, more than 90% of pooled PCs for clinical use are buffy coat-derived, which explains why this type of PCs were dedicated for pathogen reduction technology.
Objectives
The objective of our study was to evaluate the quality parameters of buffy coat-derived PCs inactivated with the Mirasol® PRT system and stored for 5 days. The inac-tivation effect of the Mirasol® PRT system on in vitro cell quality in PCs was evaluated and the results were com-pared to quality parameters of untreated control platelets.
Material and methods
The experiments (n = 15) were performed with pairs of identical buffy coat-derived PCs. PC preparation was done according to current Polish blood transfusion ser-vice regulations.1 The study included 15 pooled PCs ob-tained from buffy coats (150 buffy coats, 30 plasma units) by the use of whole blood centrifugation and separa-tion of red blood cells and plasma. The procedure was performed in the Regional Blood Transfusion Center in Warszawa using the ATREUS system (Terumo BCT Inc., Lakewood, USA). Before pooling, the bags with buffy coats (65 mL each) were left without agitation for 18 h.
For each experiment, 2 PCs were used: 1 for treatment with the Mirasol® PRT system (M) and 1 for a control (C).
Platelet concentrate preparation
In sterile conditions (TSCD; Terumo BCT, Lakewood, USA), 10 units of ABO-compatible buffy coats and 2 units of plasma were pooled in 1000 mL bags (JMS, Hiroshima, Japan), mixed and transferred into 600 mL bags, then centrifuged at 2240 g/min for 4.5 min at 22°C (J-6 M/E; Beckman, Porton, UK) in order to obtain PCs. The PC parameters (volume, platelet concentration and total
plate-let count/unit) met the Mirasol® PRT system incoming
pooled into 1 collective 1000 mL bag, mixed and left for 1 h without agitation. Each PC unit was then divided into 2 ali-quots – one was transferred into the Mirasol® PRT system illumination bag (M) and the other was transferred into a control bag (C).
All PC units were stored at 20–24°C, with agitation.
Equipment handling
and inactivation process
Prior to each illumination process, the PCs were identified by donation number and batch scanning. Riboflavin solu-tion (500 µM) was added to the PC for PRT treatment (M) at a volume of 35 mL, while the same volume (35 mL) of sa-line solution (0.9% NaCl; Ravimed, Łajski, Poland) was added to the PC control group (C). After removing air, the Mira-sol® illumination bags were inactivated for approx. 6 min (illuminator; 6.2 J/mL). All PCs were placed on a horizontal flatbed shaker at 20–24°C at 30 cycles/min (Helmer; Frese-nius Kabi, Lake Zurich, USA).
Storage and sampling
Twenty-four h after buffy coat preparation and illumina-tion, the first 20 mL study samples were collected in sterile conditions (TSCD; Terumo BCT) from both PC groups (M and C). Consecutive samples were collected on storage days 3 and 5. All riboflavin-treated PC bags were stored at no risk of exposure to light. PCs were not subjected to filtration as this is not a routine procedure in the Polish blood transfusion service.
Evaluation of in vitro platelet concentrates
quality on 1
st, 3
rdand 5
thday of storage
– Platelet concentration and mean platelet volume (MPV) were immediately tested on a hematological analyzer (Beckman Coulter ACD diff, High Wycombe, USA).
– Power of hydrogen (pH), pO2 and pCO2
concentra-tion measurements were performed within 15 min of sample collection in aseptic conditions on a self-calibrated blood gas analyzer (Rapidlab®1260; Bayer HealthCare, Leverkusen, Germany).
– Hypotonic shock response (HSR) was determined us-ing a 2-channel Lambda 12 spectrophotometer (Perkin Elmer, Waltham, USA) at a wavelength of 620 nm. – The aggregation ability of cells in adenosine
diphos-phate (ADP) (Chrono-Lume®Reagents, Havertown,
USA) was studied with a Chrono-Log aggregometer (Chrono-Log Corporation, Havertown, USA) using the turbidimetric method of light transmission which differentiates between PPP (platelet poor plasma) and PRP (platelet rich plasma) samples.
– Cytofluometric analysis was used to study antigen ex-pression on the platelet surfaces. After plasma wash-ing and paraformalehyde fixwash-ing, the platelets were
incubated with monoclonal antibodies directed against CD42b and CD62P antigens (Beckman Coulter Co, Vil-lepinte, France). We used monoclonal IgG1 class anti-bodies labeled with fluorescein isothiocyanate (FITC). Class IgG1 anti-murine antibodies were used as a nega-tive control. Readings were performed on a Cytoron Ab-solute flow cytofluorometer (Ortho Diagnostics, New Jersey, USA); the labeled cell distribution and fluores-cence intensity were observed as well.
– Glucose concentration was determined in Cobas In-tegra 400 Plus Roche biochemical analyzer (Roche Diagnostics Ltd., Rotkreuz, Switzerland).
– Beta-thromboglobulin (BTG) was determined with ELISA (Asserachrom β-TG kit, Asnières, France).
Statistical analysis
All reported values were calculated with a statistical software program STATISTICA (Tibco, Palo Alto, USA). The results are presented as mean and standard deviation (SD). The p-value for paired results was calculated with ANOVA, and p < 0.05 was considered significant.
Results
Study results are presented in Table 1 and in Fig. 1–6. Statistical significance was determined by comparing the results for PRT-treated PCs (M) and untreated PCs (C) on storage days 1, 3 and 5. The average PC volume after treatment and after collection of study samples was 227 mL in both the M and C groups (min volume: 183 mL; max volume: 327 mL). On storage days 3 and 5, 20 mL of PCs was collected in both PC groups (C, M). The volume decreased to 206 mL on day 3, and to 184 mL on day 5 of storage. For both study groups (C, M), the differences in volume prepared on each storage day were not statisti-cally significant.
In both the C and M groups, the platelet (PLT) concen-tration in PCs decreased slightly with storage time, from
1316 ±208 × 103/μL to 1275 ±212 × 103/μL in group M
PCs, and from 1338 ±209 × 103/μL to 1288 ±182 × 103/μL in control PCs (C). Statistical significance was observed for Mirasol®-treated PCs (M) and control PCs on storage days 1 (p < 0.005) and 3 (p < 0.05).
On storage day 1, the average platelet count/unit was 3.0 ±0.5 × 10¹¹ in both study groups, and on storage day 5 it was 2.3 ±0.5 × 10¹¹ in M and 2.4 ±0.4 × 10¹¹ in C. Platelet loss was mostly due to study sample collection. No statis-tical significance was found between the studied groups on individual storage days.
Table 1. Effect of Mirasol® PRT system on the quality of PCs
Parameters
Day 1 Day 3 Day 5
control (C) Mirasolsystem (M)® PRT p-value control (C) Mirasolsystem (M)® PRT p-value control (C) Mirasolsystem (M)® PRT p-value
Volume [mL] 227 ±32 227 ±31 >0.05 206 ±31 206 ±31 >0.05 184 ±31 184 ±31 >0.05 PLT concentration
[×103/µL] 1338 ±209 1316 ±208 <0.005* 1293 ±173 1280 ±188 <0.05* 1288 ±182 1275 ±212 >0.05 Total PLTs
[×1011/unit] 3.0 ±0.5 3.0 ±0.5 >0.05 2.7 ±0.4 2.6 ±0.4 >0.05 2.4 ±0.4 2.3 ±0.5 >0.05 MPV [fL] 7.6 ±0.9 7.5 ±0.8 <0.005* 7.5 ±0.1 7.0 ±0.4 <0.05* 7.0 ±0.5 7.2 ±0.5 <0.0005* pH 7.1 ±0.1 7.1 ±0.1 >0.05 7.5 ±0.1 7.4 ±0.1 <0.0005* 7.4 ±0.1 7.2 ±0.1 <0.0005* Glucose [mg/dL] 231.6 ±12.2 228.5 ±12.7 >0.05 206.1 ±14.8 190.9 ±16.6 <0.0005* 181.0 ±18.5 143.5 ±27.7 <0.0005*
PLT – platelet; MPV – mean platelet volume; pH – power of hydrogen; * statistical significance.
A
D
P-in
duc
ed
p
la
te
le
t a
gre
ga
ti
on
% 60
50
40
30
20
10
0
Day 1 Day 3 Day 5
H
SR %
100
80
60
40
20
0
Day 1 Day 3 Day 5
Fig. 1. Effect of Mirasol® PRT system on the quality of PCs – HSR [%]
– Mirasol®;– control.
CD
42
b %
120
100
80
60
40
20
0
Day 1 Day 3 Day 5
Fig. 2. Effect of Mirasol® PRT system on the quality of PCs – CD42b [%]
– Mirasol®;– control.
CD
62
%
20
10
0
Day 1 Day 3 Day 5
Fig. 3. Effect of Mirasol® PRT system on the quality of PCs – CD62 [%]
– Mirasol®;– control;↔– statistical significance.
Fig. 4. Effect of Mirasol® PRT system on the quality of PCs – ADP-induced platelet aggregation [%]
– Mirasol®;– control.
The pH values in both groups increased slightly by stor-age day 3, and decreased by day 5 to 7.4 for C and to 7.2 for M. It is worth noting that the pH value in all stud-ied PCs was very stable and ranged from 7.1 to 7.5 during the whole storage period. Statistical significance was ob-served when inactivated PCs were compared with control PCs on storage days 3 and 5 (p < 0.0005 and p < 0.0005, respectively).
We observed a 16% decrease of glucose concentration in PRT-treated PCs from day 1 to day 3 of storage and
an 11% decrease in the control group. Glucose consumption increased on storage day 5 (25% for M and 12% for C group as compared to storage day 3). Statistical significance was found for storage days 3 and 5 (p < 0.0005 and p < 0.0005, respectively).
Antigen expression on the surface of the platelets is one of the most sensitive platelet activation tests. The aver-age CD42b expression in both study groups was observed at 80–90% and did not change significantly throughout storage. A slight decrease in the CD42b expression was observed on storage day 3 and it returned to the value of day 1 by storage day 5 (Fig. 2).
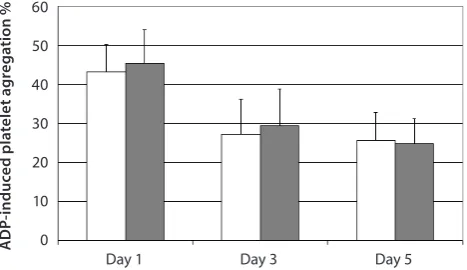
The CD62P antigen expression was slightly lower for group M as compared to group C on storage days 1 and 3. On storage day 5, the CD62P antigen expression in group M was slightly higher compared to group C. Statistical sig-nificance was found only for storage day 1 (p < 0.05) (Fig. 3). The average ADP aggregation was observed at 43.3% for group M and at 45.4% for group C on storage day 1. By storage day 3, the aggregation value in group M dropped by 37% and in group C by 35%. On storage day 5, aggrega-tion capability further decreased in both groups, to 25.6% in M and to 24.9% in C group. No statistical significance was observed (Fig. 4).
The concentration of beta-thromboglobulin, a protein found in the alpha granularity, increased with PC stor-age time and platelet activation. A 3-fold increase of BTG was observed in group M and more than a 2-fold increase in group C over 5 days of storage. Statistical significance was observed on storage day 5 (p < 0.05) (Fig. 5).
The pCO2 value decreased with storage in both PC
groups. Statistical significance was observed on storage day 3 (p < 0.0005). The pO2 values were significantly lower in inactivated PCs than in control PCs (p < 0.05, p < 0.0005 and p < 0.005 on respective days 1, 3 and 5) (Fig. 6).
Discussion
Transfusions of platelet concentrates are becoming more and more common for the prevention of bleeding. The ul-timate aim of every blood transfusion service is therefore to prepare safe PCs of high therapeutic quality to induce he-mostasis in the recipient’s circulatory system. The methods of PC preparation in routine use are apheresis (from a single donor) or the conventional method from whole blood (from buffy coats or platelet rich plasma). Pooled buffy coats carry a higher risk of pathogen transmission as compared to PCs obtained from a single donor.12 This is one of the reasons why we used PCs from buffy coats to evaluate the efficacy of PCs inactivated in the Mirasol® PRT system; the other reason is that this method of PC preparation is more com-mon in Poland than the method of obtaining PCs from PRP. The aim of the study was to evaluate the effect of PRT based on riboflavin and UV light exposure on PC func-tional characteristics. During collection, preparation and storage, PCs are subjected to procedures such as centrifu-gation, resuspension and agitation, which are responsible for platelet activation.13 The platelet functional char-acteristics are then impaired and platelet survival time in the recipient’s circulatory system may also be reduced.
The Mirasol® PRT system may impose additional stress
on the platelets.
The study aim was to evaluate the most common in vitro
parameters of PRT-treated PCs.13 One of the parameters
that determines PC quality is the pH value. It is worth not-ing that PC storage bags, which facilitate free gas exchange, may cause PC alkalization (especially when platelet count is low) through excessive CO2 diffusion from the plasma. Alkalization or low pH (<6.2) may correlate with low post-transfusion platelet viability.14,15
No additional effect of PRT treatment on the PC platelet count was determined. The platelet count decreased over time, as already demonstrated by Moroff et al., who evalu-ated this parameter in various kinds of PCs (illuminevalu-ated, filtered, etc.) during a 5-day storage period.16,17
Many studies have shown that a drop in the pH dur-ing storage to 6.4 or 6.2 causes swelldur-ing of the platelets and a decrease in the number of transfused platelets. A pH value <6.1 has been reported to result in irrevers-ible shape changes in transfused platelets and a pH value <6.2 results in a 50% decrease in the number of platelets remaining in circulation after transfusion and a 50% decrease in the half-life of the platelets in circulation.17 These changes are believed to decrease the efficacy of transfused platelets and are the basis for the lower
Be
ta
-t
hrom
bo
glob
ul
in
[I
U
/m
L] 80000
70000 60000 50000 40000 30000 20000 10000 0
Day 1 Day 3 Day 5
pO
₂ a
nd p
CO
₂ [
m
m H
g]
40
30
20
10
0
Day 1 Day 3 Day 5
Fig. 6. Effect of Mirasol® PRT system on the quality of PCs – pO2 and pCO2 [mm Hg]
– pO2 Mirasol®;– pO2 control; – pCO2 Mirasol®;– pCO2 control;
↔ – statistical significance.
Fig. 5. Effect of Mirasol® PRT system on the quality of PCs – beta-thromboglobulin [IU/mL]
pH limit for transfused platelets in the regulations. Mur-phy et al. observed the ideal pH value to be 6.8–7.4 and found that the mean platelet volume and platelet count are equally significant for PC quality control.18 Accord-ing to Rinder and Smith, most authors claim that the pH of platelets stored in gas-permeable bags should be closer to 7.0. In fact, considering the low platelet yields found in PCs, there is more concern about an alkaline pH (close to or >8.0), since storage at this pH is also known to be deleterious to platelet function and post-transfusion recov-ery.19 The degranulation of stored platelets at low pH was one factor that led us to examine if lesser but significant degrees of platelet release and activation occurred under more physiological storage conditions.18
Platelets stored in an acidic environment (pH < 6.0) lose their oxygen-absorbing capability, undergo degranulation and are rapidly removed from the recipient’s circulatory system.
A statistical significance in pH value in group M was observed on storage days 3 and 5, although the values were within normal range. On storage day 3, slight PC alkaliza-tion was noted in both PCs groups (C and M), but it was attributed to the procedure of sample collection, which resulted in a lower volume and a lower platelet count, while the O2/CO2 exchange surface remained the same.
Li et al. evaluated the PRT-treated PCs obtained through apheresis. They observed similar pH values (7.45 for con-trols and 7.51 for Mirasol® PRT system) on storage day 1 and the same value – 6.90 – for Mirasol® PRT system and for control on storage day 5. Clinical studies have demon-strated that pH value is a simple parameter which indi-rectly indicates the condition of platelets and correlates with in vivo platelet recovery.19,20 It has been determined that the mean platelet volume decreases in all components stored at room temperature, which confirms the satisfac-tory condition of cells.
Goodrich et al. showed the highest correlation between pH and lactate production in PCs and in vivo recovery of Mirasol®-treated platelets.21 In the 1970s, Valeri dem-onstrated a correlation between HSR and platelet viability in the recipient’s circulatory system.22 A similar correlation was reported by Handin, who recognized HSR as the most significant in vitro parameter to reflect in vivo platelet functions.23 In our study, we observed HSR changes to be very slight compared to the results obtained by other study centers. After 5 days of storage, the PCs in group M showed no statistically significant HSR differences com-pared to control PCs, which only shows that platelets are capable of “removing water out of the cell.”21,24
The turbidimetric method was used to evaluate platelet aggregation capacity by inducing with ADP, an agonist which defines the adhesion and aggregation capacity. ADP-related aggregation depends on the presence of ADP re-ceptors, IIb/IIIa receptors for fibrinogen and proper alpha granule release. The aggregation capacity of platelets de-creases with storage time, which was observed in both PC
groups (C and M). Similar results were obtained by Rijk-ers et al., who studied platelet aggregation in PCs. No ad-ditional effect of PRT treatment on platelet aggregation was reported.25
Flow cytometry is a routine method for studying plate-let activation mechanisms. Monoclonal antibodies used for the evaluation of platelet activation help to determine cell fractions that express on the platelet membrane. The appearance of new antigens (absent in a resting-stage), as well as quantity changes of antigens expressed on plate-let membranes, result from plateon plate-let activation and intra-cellular granule release. In consequence, the intraplatelet vesicle membrane fuses with the cytoplasmatic membrane, and the glycoproteins from granular membranes dissemi-nate into the cytoplasmatic membrane and are expressed on the platelet membrane. The level of platelet activa-tion on the cytoplasmatic membrane is usually expressed by 3 antigens. With an increase of platelet activation, the expression of P-selectine increases as well (PADGEM antigen, GMP-140 glycoprotein, CD62P antigen) as a re-sult of intensive alpha granule release. Simultaneously, the expression of the α fragment (the von Willebrand re-ceptor) for glycoprotein Ib (antigen CD42b) is reduced, and the expression of the active form of fibrinogen receptor GP IIb-IIIa (CD41) increases.26,27
To evaluate the effect of PRT treatment on PCs, we de-cided to concentrate on the 2 most characteristic param-eters of platelet activation, namely the CD42b and CD62P antigens.
In contrast to the results concerning the CD42b antigen expression reported by other authors, in our study, a slight decrease of glycoprotein Ib (antigen CD42b) expression on cells in both study groups was observed on storage day 3. On storage day 5, however, a return to the initial values was noted. Glycoprotein Ib is the basic receptor dur-ing the initial adhesion of platelets to the vessel wall, and a lack or decrease of this expression results in aggregation impairment.13 No correlation between the CD42b antigen expression and platelet aggregation capacity was found.
P-selectin is also a significant activation marker. Most authors involved in PC quality control use this param-eter as an indirect measure of platelet function. George et al. studied the CD62P antigen expression in PCs stored for 7 days under different agitation conditions. The per-centage of the CD62P antigen expression on cells was 3-fold higher as compared to the initial values.28 Fijnheer et al. observed that P-selectin expression correlates with the PC platelet count.29 According to his observations, after 5 days of storage, a 15% increase in the number of activated plate-lets occurred if the platelet count was below 1 × 10⁹/mL, and a 30% increase occurred if the platelet
concentra-tion was above 1.4 × 10⁹/mL. In our study, we observed
are the first to be removed from the recipient’s circula-tory system and are phagocytosed by granulocytes and monocytes.19
Glucose is a compound that participates in ATP synthesis via metabolism of lactic acid along the glycolytic pathway. There occurs a direct correlation between depletion of glu-cose resources and prolongation of storage time. Addition-ally, in our study we report a statistically significant decrease in glucose concentration for inactivated platelets (M) on days 3 and 5 which was also confirmed by other authors.18,19
Rinder and Smith report that beta-thromboglobulin con-centration may be an alternative to the costly and compli-cated isotope-stained studies which predict in vivo platelet recovery and survival. The higher beta-thromboglobulin release from alpha granules in PRT-treated PCs also in-dicates slight activation on all storage days as confirmed by the statistically significant difference observed for PCs after 5 days of storage.19
The pO2 and pCO2 values confirm proper gas exchange in the stored PCs, both control and PRT-treated.
The low-er pO2 values in group M compared to group C indicate
higher aerobic respiration, a requirement for adequate ATP production in cell mitochondria.
The aim of the study was to evaluate the in vitro bio-logical parameters of PCs. Many authors claim that pa-rameters such as aggregation capacity or HSR represent the in vivo hemostatic functions of platelets, but the most reliable, conclusive method of demonstrating PC transfu-sion effectiveness would be to evaluate the patient’s clinical state following the transfusion of PRT-treated PCs.20,30
Independently of the above-described in vitro studies, each regional blood transfusion center involved in PC in-activation also performs routine quality control of inacti-vated PCs and monitors the components. If the percentage of components within a normal range falls below 75%, cor-rective measures are launched which consist of monitoring all stages of inactivated PC preparation.
Conclusions
The in vitro results demonstrate that pH, HSR, aggrega-tion, CD42b antigen expression, MPV, and platelet count are comparable in groups M and C. It is commonly acknowledged that pH, HSR, CD42b antigen expression, MPV, and platelet count in the in vitro studies correlate with platelet survival time in the recipient’s circulatory system. We can therefore assume that the therapeutic value of PRT-treated PCs is com-parable to that of untreated conventional PCs, even though the values for glucose consumption and the CD62P antigen expression in group M are slightly higher on storage day 5, and for BTG the increase is statistically significant.
However, the most desired clinical outcome is the achieve-ment of hemostasis; therefore, further in vivo studies are required to confirm the correlation between the in vitro and in vivo results.
References
1. Lachert E, Kubis J, Dąbrowska A. Quality system in blood transfusion service. In: Łętowska M, ed. Medical Standards for Collection,
Prepara-tion and DistribuPrepara-tion of Blood and Blood Components. 3rd ed.
Warsza-wa: Institute of Hematology and Transfusion Medicine; 2014:41–105. 2. Klein HG, Bryant BJ. Pathogen-reduction methods: Advantages and
limits. Vox Sang. 2009;4:154–160.
3. Hayes EB, Komar N, Nasci RS, Montgomery SP, O’Leary DR, Camp-bell GL. Epidemiology and transmission dynamics of West Nile virus disease. Emerg Infect Dis. 2005;11:1167–1173.
4. Biggerstaff BJ, Petersen LR. Estimated risk of transmission of the West Nile virus through blood transfusion in the US, 2002. Transfusion. 2003;43:1007–1017.
5. Canellini G, Waldvogel S, Anderegg K, Tissot JD. Bacterial contami-nation of platelet concentrates: Perspectives for the future. Labmed-icine. 2010;41(5):301–305.
6. Cardo LJ, Rentas FJ, Ketchum L, et al. Pathogen inactivation of Leish-mania donovani infantum in plasma and platelet concentrates using riboflavin and ultraviolet light. Vox Sang. 2006;90:85–91.
7. Ruane PH, Edrich R, Gampp D, Keil SD, Leonard RL, Goodrich RP. Pho-tochemical inactivation of selected viruses and bacteria in platelet concentrates using riboflavin and light. Transfusion. 2004;44:877–885. 8. Fast LD, DiLeone G, Li J, Goodrich R. Functional inactivation of white
blood cells by Mirasol treatment. Transfusion. 2006;46:642–648. 9. Fiebig E, Hirschkorn DF, Maino VC, Grass JA, Lin L, Busch MP.
Assessment of donor T-cell function in cellular blood components by the CD69 induction assay: Effects of storage, γ radiation, and pho-tochemical treatment. Transfusion. 2000;40:761–770.
10. Ambruso DR, Thurman G, Marschner S, Goodrich RP. Lack of anti-body formation to platelet neoantigens after transfusion of ribofla-vin and ultraviolet light-treated platelet concentrates. Transfusion. 2009;49:2631–2636.
11. Cazenave JP, Follea G, Bardiaux L, et al. A randomized controlled clin-ical trial evaluating the performance and safety of platelets treat-ed with MIRASOL pathogen rtreat-eduction technology. Transfusion. 2010;50:2362–2375.
12. Ness P, Braine H, King K, et al. Single-donor platelets reduce the risk of septic platelet transfusion reactions. Transfusion. 2001;41:857–861. 13. Ali SF. Platelet activation in stored platelet concentrates: Comparison
of two methods preparation. J Hematol. 2012;1:15–19.
14. Slichter SJ, Corson J, Jones MK, Christoffel T, Pellham E, Bolgia-no D. Platelet concentrates prepared after a 20- to 24-hour hold of the whole blood at 22°C. Transfusion. 2012;52:2043–2048. 15. Tudisco C, Jett BW, Byrne K, Oblitas J, Leitman SF, Stroncek DF.
The value of pH as a quality control indicator for apheresis plate-lets. Transfusion. 2005;45:773–778.
16. Picker SM. In vitro assessment of platelet function. Transfus Apher Sci.
2011;44:305–319.
17. Moroff G, George VM, Siegl AM, Luban NLC. The influence of irradia-tion on stored platelets. Transfusion. 1986;26:453–456.
18. Murphy S, Rebulla P, Bertolini F, et al. In vitro assessment of the qual-ity of stored platelet concentrates. Transfus Med Rev. 1994;8:29–36. 19. Rinder HM, Smith BR. In vitro evaluation of stored platelets: Is there
hope for predicting post-transfusion platelet survival and function?
Transfusion. 2003:43:2–6.
20. Li J, Lockerbie O, de Korte D, Rice J, McLean R, Goodrich RP. Evalu-ation of platelet mitochondria integrity after treatment with Mira-sol pathogen reduction technology. Transfusion. 2005;45:920–926. 21. Goodrich RP, Li J, Pieters H, Crookes R, Roodt J, Heyns A. Correlation
of in vitro platelet quality measurements with in vivo platelet viabil-ity in human subjects. Vox Sang. 2006;90:279–285.
22. Valeri CR, Feingold H, Marchionni LD. The relation between response to hypotonic stress and the 51Cr recovery in vivo of preserved plate-lets. Transfusion. 1974;14:331–337.
23. Handin RI, Fortier NL, Valeri CR. Platelet response to hypotonic stress after storage at 4°C or 22°C. Transfusion. 1970;10:305–309. 24. Kraemer L, Raczat T, Weiss DR, Strobel J, Eckstein R, Ringwald J.
Cor-relation of the hypotonic shock response and extent of shape change with the new ThromboLUX™. Vox Sang. 2015;9:194–196.
26. Shrivastava M. The platelet storage lesion. Transfus Apher Sci. 2009;41:105–113.
27. Macher S, Sipurzynski-Budrass S, Rosskopf K, et al. Function and activation state of platelets in vitro depend on apheresis modality.
Vox Sang. 2010;99:332–340.
28. George JN. Changes in platelet membrane glycoproteins during blood bank storage. Blood Cells. 1992;18:501–511.
29. Fijnheer R, Modderman PW, Veldman H, et al. Detection of platelet activation with monoclonal antibodies and flow cytometry: Chang-es during platelet storage. Transfusion. 1990;30:20–25.
![Fig. 5. Effect of Mirasol® PRT system on the quality of PCs – beta-thromboglobulin [IU/mL]](https://thumb-us.123doks.com/thumbv2/123dok_us/8765538.1754238/5.595.44.281.411.547/fig-effect-mirasol-prt-quality-pcs-beta-thromboglobulin.webp)
