© 2017 Reem Abou Assi et al. This is an open access article distributed under the terms of the Creative Commons Attribution License -NonCommercial-ShareAlikeUnported License (http://creativecommons.org/licenses/by-nc-sa/3.0/).
Journal of Applied Pharmaceutical Science Vol. 7 (09), pp. 020-029, September, 2017 Available online at http://www.japsonline.com
DOI: 10.7324/JAPS.2017.70903 ISSN 2231-3354
Development and validation of a stability-indicating RP-HPLC
method for the detection and quantification of azithromycin in bulk,
and self-emulsifying drug delivery system (SEDDs) formulation
Reem Abou Assi1, Yusrida Darwis1*, Ibrahim M. Abdulbaqi1, Shaik Mohammed Asif1,2 1
Discipline of Pharmaceutical Technology, School of Pharmaceutical Sciences, Universiti Sains Malaysia, 11800 Penang, Malaysia. 2
Pharma Research, Wockhardt Research Center, Aurangabad, India.
ARTICLE INFO ABSTRACT
Article history: Received on: 23/04/2017 Accepted on: 06/06/2017 Available online: 30/09/2017
The objective of this work is to develop and validate a simple, rapid and specific reverse phase HPLC–UV method for the determination of azithromycin (AZM) in bulk, and self-emulsifying drug delivery system (SEDDs). The separation was done using Hypersil GOLD C-18 analytical column packed with deactivated silica (250 mm x 4.6 mm ID x 5 µm) kept at 60 °C, ammonium acetate solution (30 mmolL−1, pH= 6.8) and acetonitrile (18:82, v/v) as the mobile phase, and UV detection at 210 nm. Samples were eluted isocratically at a flow rate of 0.7 mL min−1.Forced degradation studies on AZM in bulk and the developed formulation were carried out. The method was validated for system suitability, specificity, linearity, precision, and accuracy. Theoretical plates (N > 1500), tailing factor (T ≤ 1.5), and resolution (Rs > 3) were as per United States Pharmacopeia (USP). There were no interferences by SEDDs excipients and AZM degradation products. The linearity was observed over the concentration range of 5–200 μg mL-1 (R2 > 0.9999).The limit of detection (LOD) and limit of quantification (LOQ) were 0.476 µg mL-1 and 1.443 µgmL-1 respectively.the developed method was statistically confirmed to be accurate, precise, and reproducible.
Key words: Azithromycin, Self-emulsifying Drug Delivery System SEDDs,Stress degradation, Stability-indicating, HPLC–UV.
INTRODUCTION
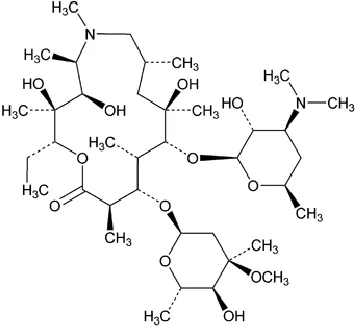
Azithromycin (AZM), (Fig 1) (USP, 2015), is a semi-synthetic 15-membered macrolide antibiotic. It is the first azalide subclass among its family members with a superior antibacterial activity in the market for the last three decades. AZM (anhydrous) has a lipophilic nature (log P = 4) with a
relatively large molecular weight of 749 g mol-1. It was initially
synthesized from erythromycin in an attempt to produce an acid stable macrolide, with a wider bacterial spectrum, and longer
half-life (68h) (Imperi et al., 2014). The drug is listed on the
World Health Organization website in the model list of essential medicines (World Health Organization, 2013).
* Corresponding Author Email: yusrida @ usm.my
AZM is active against a wide range of gram-positive and gram-negative bacteria, however due to its incomplete absorption, AZM showed a low oral bioavailability of 37% (Luke and Foulds, 1997), with side effects including nausea, abdominal pain, vomiting, and diarrhea (Pfizer, 2013). Oral lipid based formulation could be used to overcome AZM oral administration associated biopharmaceutical drawbacks. Lipid based formulations are isotropic mixtures of either oil and drug (type I), oil, drug, and surfactant (type II), oil, drug, surfactant and surfactant or co-solvent (type III), or surfactant and drug (type IV) (Pouton, 2000; Pouton, 2006). Upon contact with aqueous medium and mild agitation, the formulations will form fine oil in water nano or
micro emulsions (Porter et al., 2008). In the present study, AZM
AZM Ultraviolet (UV) detection is highly challenging due to the absence of the conjugated double bond in its lactone ring, which consequently results in a low molar absorptivity
(Kanfer et al., 1998). Accordingly, different analytical techniques
were explored to detect and quantify AZM in pharmaceutical and biological samples as well as foodstuffs and environment. These include spectrophotometric ion pair complexation techniques, spectrofluorimetric analysis, and near-infrared diffuse reflectance
spectroscopy (Rachidi et al., 2006), (Sayed et al., 2013; Li et al.,
2012; Khashaba 2002). Other methods such as LC–MS/MS (Shen
et al., 2010), thin layer chromatography-densitometry (A.
Kwiecień, 2013; Khedr and Sheha, 2003), cyclic voltammetry and
square-wave voltammetry using different electrodes (Peng et al.,
2011; AvramovIvić et al., 2006;Farghaly et al., 2004; Nigović et
al., 2003) and Raman spectroscopy by measuring drug’s peak
intensity (Shende et al., 2014) were also used. However, the above
mentioned techniques are either expensive, tedious or time consuming in comparison to a simple HPLC-UV method.
Based on literature review, although some HPLC-UV methods have been developed to detect AZM in pharmaceutical
dosage form such as tablets and capsules (Pravallika et al., 2014;
Waghule et al., 2013; Senthil Raja et al., 2010; Shaikh et al., 2008;
Kulikov and Verushkin 2004), few methods were performed under stability indicating conditions (Subbareddy and Divakar, 2015;
Ramesh et al., 2012; El-Gindy et al., 2011; Al-Rimawi and
Kharoaf, 2010). Despite the fact that HPLC-UV techniques were used to quantify AZM in some nano-formulations, but the
validation of these methods was not mentioned (Meng Zhong et
al., 2014; Pouretedal, 2014; Yan Liu et al., 2009). To the best of
our knowledge, this is the first work reporting azithromycin HPLC-UV analysis in bulk and AZM-SEDDs formulation, along with their degradation profiles. The purpose of this work was to develop a simple, specific and reproducible stability-indicating HPLC–UV method for the determination of AZM in pure, and AZM-SEDDs. The method was developed and validated as per the
recommendations of the International Conference on
Harmonization ICH guideline (ICH, 2005).
Fig. 1: The chemical structure of azithromycin anhydrous.
MATERIALS AND METHODS
Chemical and reagents
Azithromycin anhydrous (purity > 97.2%) was a kind gift from Wockhardt research centre (Aurangabad, India). Acetonitrile and methanol (HPLC grade) were purchased from J. T. Baker (Phillipsburg, NJ, USA). Ammonium acetate was bought from
Bendosen laboratory chemicals (Bendosen, Norway). Tween 20®
(Polyethylene glycol sorbitan monolaurate) was purchased from
Sigma-Aldrich (St. Louis, MO, USA), Capryol 90® (Propylene
glycol monocaprylate) and Transcutol HP® (Diethylene glycol
monoethyl ether) were purchased from Gattefossé (Lyon, France). All other chemicals used were of analytical reagent grade and obtained commercially.
Instrumentation
The study was conducted using a Shimadzu liquid chromatography system (VP series, Kyoto, Japan) with CBM/20A system controller, LC/20AD solvent delivery pump, SPD/20A UV/VIS detector, SIL/20A auto-sampler, and CTO/10ASvp oven system. Data acquisition and analysis were performed using
Shimadzu LabSolutions® software (version 5.30 SP1) (Kyoto,
Japan).
Chromatographic condition
The chromatographic separation was performed using a Hypersil GOLD C-18 analytical column with the dimensions of 250 mm x 4.6 mm ID x 5 µm, Fisher Scientific (Waltham,
Massachusetts, USA). The flow rate was set at 0.7 mLmin−1
, and the detection wavelength was set to 210 nm. The oven temperature was maintained at 60ºC, and an injection volume of 10 µl was employed.
Mobile phase was consisting of acetonitrile: ammonium
acetate solution (30 mmolL−1, pH = 6.8) (82:18 v/v). The mobile
phase was filtered through nylon membrane filter 0.45 µm, Titan®
, Thermos Scientific (Waltham, MA, USA), sonicated and degassed before use. All samples were filtered before injection using syringe filter 0.2 µm Pall (New York, USA).
Preparation of stock solution, calibration standards and quality control samples
The standard stock solution of AZM (5000 μg mL-1
) was prepared by dissolving 50 mg of AZM powder in 10 mL of methanol and sonicated in an ultrasonic bath (Branson 5510, USA) for 2 min.
Then it was further diluted with the diluting solution (which consists of acetonitrile: ammonium acetate solution (60:40
v/v)) to obtain a working standard solution of 1600 μg mL-1
. Solutions for the calibration were prepared by diluting the working standard solution with the diluting solution to give concentrations
in the range of 5 to 200 μg mL-1
. Three quality control (QC) solutions at low (LQC), medium (MQC) and high (HQC)
concentrations were prepared of 15, 100 and 180 μg mL-1,
Preparation of AZM self-emulsifying delivery system (AZM-SEDDs)
AZM-SEDDs was prepared by dissolving accurately weighted amount of AZM (120 mg) in a volume of 2 mL of the previously prepared blank SEDDs. The blank SEDDs was placed
in a glass vial consisted of oil (Capryol 90® oil), surfactant (Tween
20®), and co-surfactant (Transcutol HP®). The pure AZM was
added to the blank SEDDs and the mixture was vortexed for 1 min using a ZX3 vortex mixer (VELP Scientifica, Italy) and then
placed in a water bath shaker at 37◦C overnight. The obtained
samples of AZM-SEDDs were stored at the ambient temperature for further use.
System suitability studies
System suitability tests were conducted to verify the performance and the reproducibility of the chromatographic system. Analytical parameters such as retention time (Rt), theoretical plates (N), tailing factor (T), and resolution (Rs) were checked at the three QC concentrations in six injection replicates.
SPECIFICITY
The specificity test is a reflection of the analytical method capacity in measuring the drug in the presence of impurities, excipients, and degradation products (if any). The test was done by comparing the chromatograms of the mobile phase,
AZM standard solution, blank-SEDDs, AZM-SEDDs, in vitro
release mediums including 0.1 mmolL−1 HCl solution (pH = 4),
and simulated intestinal fluid (SIF, pH = 6.8).
Stress degradation studies
In this study, the stress degradation conditions of acid, base, oxidation, light and heat were performed on four solutions namely: AZM standard, AZM-SEDDs, blank-SEDDs and mobile
phase. The AZM standard solution of 1600 μg mL-1
was prepared by diluting the required volume of the standard stock solution with
methanol. The 0.267 mL of AZM-SEDDs (60 mg mL-1 AZM) was
dissolved in10 mL methanol to get the AZM concentration of 1600
μgmL-1
. The blank-SEDDs solution was prepared similar to AZM-SEDDs solution. The mobile phase was used as it is.
Acid and alkali degradation studies
In the acid degradation study, two sets of four 10 mL flasks were filled in with 1 mL of AZM standard, AZM-SEDDs, blank-SEDDs or mobile phase, respectively. Subsequently, 1 mL
of 1 mmolL−1HCl was added to all the flasks. The solutions in the
first set were neutralized immediately with 1 mL of
1mmolL−1NaOH, then the diluting solution was added up to 10
mL. These solutions were served as zero hour samples. The solutions in the second set were left on the bench at room temperature (25ºC/65% relative humidity) for 24h, then neutralized and diluted by the same way. These solutions were served as 24h samples. All the samples were injected in triplicate. For alkali degradation study, similar procedure was used, but 1 mL
of 100 mmolL−1NaOH was added to each flask instead of 1 mL of
1mmolL−1HCl and the neutralization procedures were done using
100 mmolL−1HCl.
Oxidative hydrogen peroxide (H2O2) degradation
Two sets of four 10 mL flasks were filled in with 1 mL of AZM standard, AZM-SEDDs, blank-SEDDs or mobile phase,
respectively. Subsequently, 1 mL of 3% H2O2was added to all the
flasks. The solutions in the first set were immediately diluted with diluting solution up to 10 mL, and injected into the HPLC to prevent any unnecessary degradation for zero time solutions.These solutions were served as zero hour samples. The solutions in the second set were left on the bench at room temperature (25ºC/65% relative humidity) for 24h, then diluting solution was added up to 10 mL. These solutions were served as 24h samples. All the samples were injected in triplicate.
Light degradation
Two sets of four 10 mL flasks were filled in with 1 mL of AZM standard, AZM-SEDDs, blank-SEDDs or mobile phase, respectively. The solutions in the first set were immediately diluted with the diluting solution up to 10 mL and served as zero hour samples. The solutions in the second set were stored in light cabinet (365 nm) for 24h, and then diluting solution was added up to 10 mL and served as 24h samples. All samples were injected in triplicate.
Thermal degradation study
Two sets of four 10 mL flasks were filled in with 1 mL of AZM standard, AZM-SEDDs, blank-SEDDs or mobile phase, respectively. The solutions in the first set were immediately diluted with diluting solution up to 10 mL and served as zero hour samples. The solutions in the second set were heated in a water bath at 80ºC for 2h, and then diluting solution was added up to 10 mL and served as 2h samples. All the samples were injected in triplicate.
METHOD VALIDATION
Linearity
The linearity range of this method was from 3 to 120 %
of the AZM targeted concentration (160 μg mL-1
) to meet ICH guidelines linearity range selection for dissolution and assay testing (ICH,2005). Accordingly, the calibration curve was set
from 5 to 200 μg mL-1
. Seven solutions containing 5, 10, 20, 40,
80, 120 and 200 μg mL-1
of AZM were used. Each solution was injected in triplicate. The standard calibration curves for
concentration versus peak area were constructed. The
homoscedasticity assumption of the linearity was evaluated by performing the F-test.
Precision and accuracy
Three levels of quality control (QC) samples of AZM
(LQC, MQC and HQC correspond to 15, 100 and 180 μg mL-1
were prepared from the stock solution and used to determine the method precision and accuracy. For intra-day precision and accuracy, three sets of standard solutions were injected on the same day. For inter-day precision and accuracy, three sets of standard solutions were injected over six consecutive days. Precision is known as the percentage of relative standard deviation (% RSD), while accuracy is presented as the relative percentage of error (% RE), both are calculated using the following formulas:
Precision (%RSD) = Standard deviation x 100% Mean value
Accuracy (% RE) = (Calculated concentration – Cstd) x 100% Cstd
Where Cstd is the nominated concentration of the standard
solution in µg mL-1.
Limit of Detection (LOD) and Limit of Quantification (LOQ)
The LOD and LOQ were determined by serial dilutions of AZM stock solution in order to obtain signal to noise (S/N) ratio of at least 3.3:1 for LOD and 10:1 for LOQ.
Robustness
A good HPLC method have an adequate capacity to remain unaffected by minor variations in the method parameters. The robustness of the developed method was evaluated by deliberately making slight changes in the optimized value of the chromatographic conditions. The evaluated variables were namely: detector wavelength (±2 nm), pH (±0.2), composition of the
mobile phase (±1 v/v), flow rate (±0.1 mLmin-1) and oven
temperature (±2 °C). AZM concentration of 100 µg/mL (MQC) was selected to perform the robustness study. AZM peak areas and the % RSD were calculated under all conditions studied and the obtained data were submitted for statistical analysis.
STOCK SOLUTION STABILITY
The stability of AZM stock solution (5000 μg mL-1
) was studied under room temperature condition (25 ºC/65% relative humidity) for 24h. After that, the stock solution was diluted to the
MQC concentration (100 μg mL-1
) and directly injected to the HPLC to determine AZM concentration. The stability of the stock solution was determined by comparing the concentration of AZM in the stock solution after 24h with the freshly prepared one.
QUANTIFICATION OF AZM CONTENT IN THE SEDDs FORMULATION
A volume of 0.267 mL of AZM-SEDDs formulation (60
mg mL-1AZM) was dissolved in 10 mL methanol and stirred with
a magnetic stirrer for 30 min. The solution was then sonicated in ultrasonic bath for 2 min. Suitable aliquots were taken and diluted with the diluting solution and filtered with 0.2 µm pore size nylon
filter to get a final concentration of 160 μg mL-1
. The solution was
subjected to chromatographic analysis, which was done in triplicate.
RECOVERY OF AZM
A volume of 0.267 mL of the blank SEDDs formulation was dispersed in 10 mL of methanol. After that, 16 mg of AZM was accurately weighted and added to the solution under continuous gentle mixing with a magnetic stirrer for 30 min. The solution was then sonicated in an ultrasonic bath for 2 min, and 1 mL of this solution was diluted with the diluting solution in a 10 mL volumetric flask.
The solution was filtered with 0.2 µm pore size nylon
filter to give a final concentration of 160 μg mL-1
. The sample of 10 µL was injected into the HPLC system, and the analysis was done in triplicate.
STATISTICS
All the statistical tests of the developed method including the one-way analysis of variance (ANOVA), and Tukey's HSD
(honest significant difference) were performed using Minitab® 17
software, Minitab Inc., USA. All the data are presented as the mean ± the standard deviation (S.D) and p values < 0.05 were considered to be statistically significant.
RESULTS AND DISCUSSION
Method development and optimization
Column selection
The alkaline nature of AZM has made it easily absorbed by the silanol group (Si–OH) on the silica surface of the chromatographic packing, which caused a serious tailing of the
chromatographic peaks (Chang et al., 2016). Moreover, the C18
columns were the dominating stationary phase for macrolides separation through the liquid chromatography (LC) methods (Wang, 2009). Accordingly, a Hypersil GOLD C-18 analytical
column packed with deactivated silica was selected to reduce silanol interactions with AZM, and to reduce the tailing of
peak.
Wavelength selection
AZM at a concentration of 800μg mL-1was scanned from
190 to 400 nm using a UV-Vis spectrophotometer U-2000 (Hitachi, Japan). The maximum of AZM absorbance was observed at a wavelength of 210 nm. Thus, the wavelength was selected for the analysis.
Oven temperature optimization
Several oven temperatures (25, 40, 50, 55, and 60◦C)
were tried. It was observed that increasing the oven temperature would decrease the peak broadening. The lowest tailing of the
peak was found at 60◦C, and this temperature was considered as
Mobile phase composition optimization
Acetonitrile was considered over methanol because it has the lowest absorbance and consequently lower noise under such UV detection wavelength (210 nm) (Miguel and Barbas 2003).
A robust HPLC method development depends on achieving analyte’s peak separation at a pH where its retention time is the least affected by pH changes. The mobile phase pH should be selected to be at least ± 2 pH units from the pKa of the analyte. This is to ensure that the analyte is either 100% ionized or 100% non-ionized at the selected pH to obtain reproducible results. This principle was investigated by comparing different pH values below the pKa value of AZM (8.74) through using ammonium acetate solution (pH 6.8), ammonium acetate buffer (pH = 4.5 and 5.5).The results showed that when pH values of 4.5 and 5.5 were used, irreproducible and lower peak areas with high tailing factor > 1.5 were obtained. This could be attributed to the lower stability of AZM in acidic media (Miguel and Barbas 2003). On the other hand, ammonium acetate solution (pH = 6.8) have shown to produce highly reproducible and good peak areas with a tailing factor < 1.5.
Although phosphate buffers are most commonly used in analysing AZM under higher pH values above its pKa, however, they were excluded in this method due to the high tendency of these buffers to form precipitates when used with high concentration of acetonitrile which will affect the HPLC device, column, and create many problems. While, ammonium acetate provides superior solubility in acetonitrile even in the presence of
a high concentration of acetonitrile (Carr et al., 2004).
Accordingly, ammonium acetate solution (pH = 6.8) was selected for this method.
The selected mobile phase composition in this method (acetonitrile and ammonium acetate solution) is more economic than the mobile phase of other methods which are composed of more than one organic solvent (acetonitrile and methanol, or acetonitrile, methanol and tetrahydrofuran with phosphate buffer) (Subbareddy and Divakar, 2015; El-Gindy et al, 2011). Different compositions of the mobile phase acetonitrile: ammonium acetate solution (75: 25, 80:20 and 82:18 v/v) were studied. It was found that the mobile phase at the ratio of 82:18 v/v had the highest AZM peak resolution (Rs).Therefore, it was consideredas the optimum ratio of the mobile phase for the HPLC method. In the preparation of AZM calibration standards and quality control samples, different ratios of diluting solutions, a mixture of acetonitrile and ammonium acetate (90:10, 80:20, 70:30, 60:40, 50:50, 40:60, 30:70, 20:80, 10:90) were studied. The diluting
solution composed of acetonitrile and ammonium acetate at a ratio of 60:40 was found to offer the highest theoretical plate number (N), and peak area.
System suitability studies
The results of the system suitability test are shown in table 1. The average retention time (Rt) of AZM was 7.95 min. The retention time of AZM in this method was faster than that reported by Subbareddy and Divakar (9.08 min), and by El-Gindy et al (31.8 min) (Subbareddy and Divakar 2015; El-Gindy et al, 2011). The theoretical plate number (N) which is a reflection of the stationary phase quality and performance, for this method was > 1500. The tailing factor (T) is an indication of peak’s symmetry and it was < 1.5. The resolution between peaks (Rs) is a quantitative measure of how well two elution peaks can be differentiated in a chromatographic separation, and it was found to be > 3. All the %RSD results were below 1.1%. The data above are suggesting that the developed method is meeting the United States Pharmacopeia requirements (USP, 2015).
SPECIFICITY
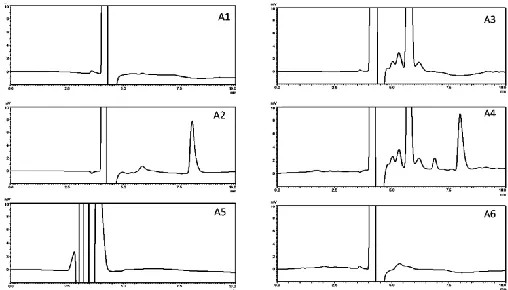
The chromatogram of the AZM-SEDDs sample showed a peak at the average retention time of 7.95 min, which was similar to the AZM peak in the standard solution. There was no peaks in the mobile phase, blank-SEDDs, and dissolution mediums
(0.1mmolL−1HCl solution, and simulated intestinal fluid) appeared
in the region of the AZM peak (Fig 2), and the peak resolution values were > 3 for AZM standard and AZM-SEDDs samples. This indicates that the method is selective and specific for AZM.
Fig. 2: Chromatograms of (A1) mobile phase, (A2) AZM standard solution, (A3) blank SEDDs, (A4) AZM-SEEDs, (A5) Simulated Intestinal Fluid (SIF), (A6) 0.1mmolL−1 HCl solution.
Table 1: Results of system suitability studies of quality control samples of AZM. Conc.
(µg mL-1) Rt1(min) RSD % T RSD % N RSD % Rs RSD %
15 7.954± 0.032 0.41 1.496 ± 0.006 0.39 6525.3 ± 53.39 0.82 4.33 ±0.039 0.92
100 7.952± 0.016 0.21 1.496 ± 0.004 0.267 6276.5 ± 42.25 0.67 4.13 ± 0.037 0.88
180 7.954 ± 0.03 0.39 1.497 ± 0.004 0.27 6358.5 ± 47.6 0.75 4.17 ± 0.036 0.875
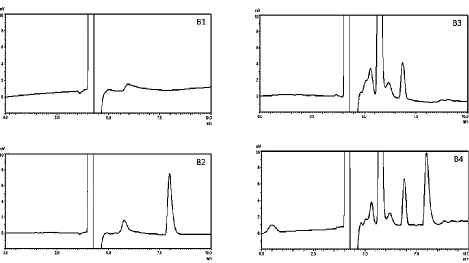
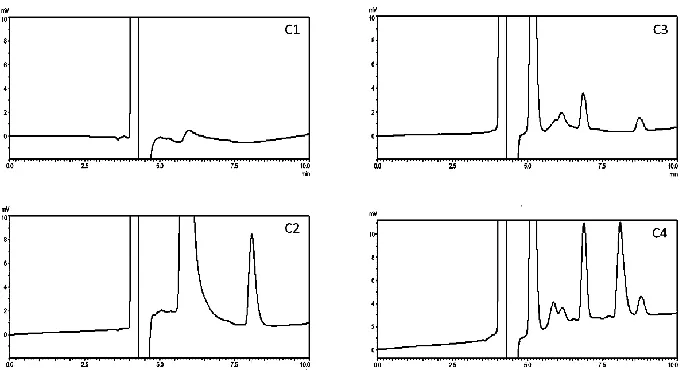
Stress degradation studies
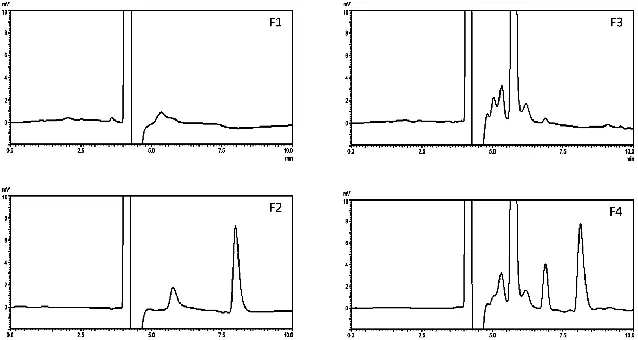
The results of the stress degradation studies (acid, alkali, oxidation, light and heat) for mobile phase, AZM standard solution, blank-SEDDs, and AZM-SEDDs are shown in table 2, while their chromatograms under the different stress conditions after 24h are shown in figures 3, 4, 5, 6, and 7 respectively.
Acid/base stress concentrations were selected so that samples should not be over-stressed with a degradation range limit
of not more than 5 – 20% (Blessy et al., 2014). A degradation of
around 10% was observed under the acid stress (1 mmolL−1), and
6% under the alkali condition (100 mmolL−1) after 24h indicating
that AZM has much better stability under alkali condition than the acidic ones, these results are in agreement with other studies (Al-Rimawi and Kharoaf, 2010; Miguel and Barbas, 2003). Oxidation tests showed a 5% degradation at zero time, 18% after 4
min time, and a complete degradation after 24h, this could be due to the direct attack of the oxidative molecules on the two
tertiary-amine nitrogens in AZM molecule (Huber et al., 2005). The drug
showed good stability under light (365 nm) and heat (80 ◦C)
stresses after 24h, and 2h respectively, these results are in line with previously conducted light and heat stress studies (Miguel and Barbas, 2003). The results of the stress study showed that the
resolution values (Rs) of AZM in pure formulation acidic (24 h),
basic (24 h), oxidation (4 min), light (24 h), and heat (2 h) conditions were 4.33, 4.53, 1.475, 4.72, 4.94, respectively. While in SEDDs formulation, the resolution values were 3.41, 3.42, 1.48, 3.75, 3.33 respectively, reflecting the high specificity of the method for AZM and that it was able to detect and quantify the drug in presence of degradation products and formulation components.
Table 2: Results of the stress degradation studies.
Stress Degradation studies results for the standard azithromycin solution
Forced degradation condition Remaining Drug % Exposure Time Remaining Drug % Exposure time
Acid (1 mmolL−1 HCl) 99.9 ± 0.39 0 89.98 ± 0.99 24h
Base (100 mmolL−1 NaOH) 99.93 ± 0.35 0 93.95 ± 0.26 24h
Oxidation (3% H2O2) 95.001 ± 0.44 0 0 24h
light (365 nm) 99.92 ± 0.15 0 99.53 ± 0.26 24h
Heat (80 ºC) 99.84 ± 0.29 0 100.47 ± 0.81 2h
Stress Degradation studies results for the azithromycin loaded lipid-based formulation
Forced degradation condition Remaining Drug % Exposure Time Remaining Drug % Exposure time
Acid (1 mmolL−1 HCl) 99.92 ± 0.2 0 90.52 ± 0.89 24h
Base (100 mmolL−1 NaOH) 99.97 ± 0.31 0 94.01 ± 1.3 24h
Oxidation (3% H2O2) 94.99 ± 0.17 0 0 24h
light (365 nm) 99.91 ± 0.58 0 99.63 ± 0.11 24h
Heat (80 ºC) 99.92 ± 0.2 0 100.57 ± 0.11 2h
Values are reported as mean ± S.D, n = 3.
Fig. 4: Chromatograms under basic stress condition (C1) mobile phase, (C2) AZM standard solution, (C3) blank SEDDs, (C4) AZM-SEEDs.
Fig. 5: Chromatograms under oxidation stress condition (D1) mobile phase, (D2) AZM standard solution, (D3) blank SEDDs, (D4) AZM-SEEDs
METHOD VALIDATION
Linearity
The results of the variance test (F-test) confirmed the absence of heteroscedasticity. The linear regression equation was
y=712.58x-476.46 with a correlation coefficient (R2) of 0.9999
(Fig 9). The obtained R2 value of the current method (0.9999) is
better than the obtained R2 values by Subbareddy and Divakar
(0.9988), and Ramesh et al. (Subbareddy and Divakar, 2015;
Ramesh et al., 2012).
Precision and accuracy
The obtained results of the intra-day and inter-day precision and accuracy, are shown in table 3. The intra-day
precision for AZM ranged between 0.12% and 0.2%, while the accuracy was between 0.03% and 0.06%. The inter-day precision ranged between 0.2% and 0.45%, while the accuracy was between -0.3% and 0.02%.
The method showed a good degree of precision and accuracy which were within the recommended range of the United States Pharmacopeia (USP, 2015).
Limit of detection (LOD) and limit of quantification (LOQ)
The LOD and LOQ of AZM by the proposed method
were found to be 0.476 µg mL-1and 1.443 µgmL-1 respectively.
The LOD and LOQ values of this method are lower than the
previously reported method (3.7 µg mL-1 and 12.56 µg mL-1
respectively) (Ramesh M. et al., 2012).
Fig. 7: Chromatograms under heat stress condition (F1) mobile phase, (F2) AZM standard solution, (F3) blank SEDDs, (F4) AZM-SEEDs.
Table 3: Results of intra-day and inter-day precision and accuracy.
Nominated Concentration
(µg mL-1)
Intra-day Inter-day Measured
Concentration (µg mL-1)
Precision (%RSD)
Accuracy (%RE)
Measured Concentration
(µg mL-1)
Precision (%RSD)
Accuracy (%RE)
15 15.01 ± 0.03 0.2 0.06 14.99 ± 0.07 0.45 - 0.09
100 100.2 ± 0.17 0.17 0.03 99.97 ± 0.22 0.22 - 0.3
180 180.05 ± 0.2 0.12 0.03 180.04 ± 0.37 0.2 0.02
Values are reported as mean ± S.D, n = 6.
Fig. 8: AZM calibration curve from 5 to 200 µg mL-1. y = 712.58x - 476.46
R² = 0.9999
0 20000 40000 60000 80000 100000 120000 140000 160000
0 50 100 150 200 250
P
ea
k
Are
a
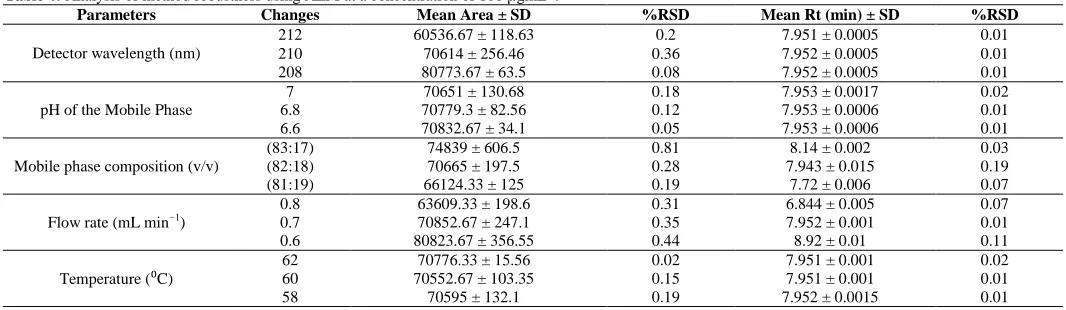
Robustness
Results of the robustness study are presented in table 4. Statistical tests showed that the mobile phase pH and the oven temperature variations did not significantly affect the peak area or the retention time. On the other hand, mobile phase composition, and the flow rate variations caused significant differences in the peak area and retention time, while detection wavelength variation did not influence the retention time, but caused significant change in the peak area.
Stock Solution Stability
The results showed that the concentration of AZM in the stock solution after 24h at room temperature (25ºC/65% relative humidity) was 100.067 ± 0.55%. There was no statistical difference in the concentration of AZM at 0 h and 24h, which indicated that the stock solution was stable for at least 24h at room temperature.
Quantification of AZM Content in the SEDDs Formulation
AZM content in AZM-SEDDs was found to be 99.76%.
Recovery Studies of AZM in the SEDDS Formulation
Recovery study is one of the most widely used approach to test the method’s accuracy which is performed by spiking the studied analyte (AZM) in blank matrices (SEDDs) (Miguel and Barbas 2003). Recovery studies are also a way to assure that the extraction method of AZM from the proposed formulation (SEDDs) is an effective one. The percentage recovery of AZM from the AZM-SEDDs formulation was in the ranged of 99.51 % to 99.91 %.
CONCLUSION
A stability indicating HPLC–UV method was
successfully developed for the determination of AZM loaded in self-emulsifying drug delivery system and also in a routine laboratory analysis. The method was simple, sensitive and specific. The Statistical analysis confirmed that the method was accurate, precise, and reproducible. There were no interferences
.
with the formulation excipients, diluents, or degradation products. AZM was found to be stable under heat and light stress, but highly susceptible to oxidation degradation in a period of 24 h. Under the studied acidic and basic conditions, AZM degraded within the accepted limits.
ACKNOWLEDGEMENTS
Author (Reem Abou Assi) gratefully acknowledges Universiti Sains Malaysia for granting the Graduate Assistantship.
Financial support and sponsorship: The current work was
funded by Universiti Sains Malaysia under the University
Research Grant scheme Reference No.1001/PFarmasi/811285.
Conflict of interests: There are no conflicts of interest.
REFERENCES
A.Kwiecień, J. Krzek, M. Gądek.Simultaneous identification and quantitative determination of azithromycin, clarithromycin, roxithromycin, spiramycin and troleandomycin by thin-layer chromatography and densitometry. Acta Chromatographica, 2013; 26 (4):657-670.
Al-Rimawi, F., and M. Kharoaf.Analysis of azithromycin and its related compounds by RP-HPLC with UV detection. J. Chromatogr Sci, 2010; 48 (2):86-90.
Avramov Ivić, M. L., S. D. Petrović, D. Ž Mijin, P. M. Živković, I. M. Kosović, K. M. Drljević, and M. B. Jovanović.Studies on electrochemical oxidation of azithromycin and Hemomycin® at gold electrode in neutral electrolyte. Electrochimica Acta, 2006; 51 (12):2407-2416.
Blessy, M., Ruchi D. Patel, Prajesh N. Prajapati, and Y. K. Agrawal. Development of forced degradation and stability indicating studies of drugs—A review. Journal of Pharmaceutical Analysis, 2014; 4 (3):159-165.
Carr, Adam P. Schellinger and Peter W.Solubility of Buffers in Aqueous–Organic Eluents for Reversed-Phase Liquid Chromatography. LCGC North America, 2004; 22 (6):544 - 548.
Chang, Yan, Li-Xin Wang, Ya-Ping Li, and Chang-Qin Hu. Factors Influencing the HPLC Determination for Related Substances of Azithromycin. Journal of Chromatographic Science, 2016; 54 (2):187-194.
El-Gindy, A., K. A. Attia, M. W. Nassar, N. M. Al Abasawi, M. Al-Shabrawi. Optimization and validation of a stability-indicating RP-HPLC method for determination of azithromycin and its related compounds. J. AOAC Int, 2011; 94 (2):513-22.
Table 4: Analysis of method robustness using AZM at a concentration of 100 µgmL-1.
Parameters Changes Mean Area ± SD %RSD Mean Rt (min) ± SD %RSD
Detector wavelength (nm)
212 60536.67 ± 118.63 0.2 7.951 ± 0.0005 0.01
210 70614 ± 256.46 0.36 7.952 ± 0.0005 0.01
208 80773.67 ± 63.5 0.08 7.952 ± 0.0005 0.01
pH of the Mobile Phase
7 70651 ± 130.68 0.18 7.953 ± 0.0017 0.02
6.8 70779.3 ± 82.56 0.12 7.953 ± 0.0006 0.01
6.6 70832.67 ± 34.1 0.05 7.953 ± 0.0006 0.01
Mobile phase composition (v/v)
(83:17) 74839 ± 606.5 0.81 8.14 ± 0.002 0.03
(82:18) 70665 ± 197.5 0.28 7.943 ± 0.015 0.19
(81:19) 66124.33 ± 125 0.19 7.72 ± 0.006 0.07
Flow rate (mL min−1)
0.8 63609.33 ± 198.6 0.31 6.844 ± 0.005 0.07
0.7 70852.67 ± 247.1 0.35 7.952 ± 0.001 0.01
0.6 80823.67 ± 356.55 0.44 8.92 ± 0.01 0.11
Temperature (⁰C) 62 60 70552.67 ± 103.35 70776.33 ± 15.56 0.02 0.15 7.951 ± 0.001 7.951 ± 0.001 0.02 0.01
58 70595 ± 132.1 0.19 7.952 ± 0.0015 0.01
Farghaly, Othman Abd El-Moaty, and Niveen Abdel Latif Mohamed.Voltammetric determination of azithromycin at the carbon paste electrode. Talanta, 2004; 62 (3):531-538.
Huber, Marc M., Anke GÖbel, Adriano Joss, Nadine Hermann, Dirk LÖffler, Christa S. McArdell, Achim Ried, Hansruedi Siegrist, Thomas A. Ternes, Urs von Gunten.Oxidation of Pharmaceuticals during Ozonation of Municipal Wastewater Effluents: A Pilot Study. Environmental Science & Technology, 2005; 39 (11):4290-4299.
International Conference on Harmonization of technical requirements for registration of pharmaceuticals for human use. Validation of Analytical Procedures: Text and Methodology. ICH Q2 (R1), 2005.
Imperi, Francesco, Livia Leoni, Paolo Visca.Antivirulence activity of azithromycin in Pseudomonas aeruginosa. Frontiers in Microbiology, 2014; 5 (178):1-7.
Kanfer, I., M. F. Skinner, and R. B. Walker.Analysis of macrolide antibiotics. J. Chromatogr A, 1998; 812 (1-2):255-86.
K. E. Pravallika, M. Bhavya, P. Ravi, K. Hemavathi, and D. Lalitha Kumari. Development and validation of RP-HPLC method for the simultaneous estimation of azithromycin and levofloxacin in combined tablet dosage form. Asian Journal of Pharmaceutical Analysis and Medicinal Chemistry, 2014; 2 (4):186 - 196.
Khashaba, Pakinaz Y.Spectrofluorimetric analysis of certain macrolide antibiotics in bulk and pharmaceutical formulations. Journal of Pharmaceutical and Biomedical Analysis, 2002; 27 (6):923-932.
Khedr, Alaa, and Mahmoud Sheha. Quantitative Thin-Layer Chromatographic Method of Analysis of Azithromycin in Pure and Capsule Forms. Journal of Chromatographic Science, 2003; 41 (1):10-16.
Kulikov, A. U., and A. G. Verushkin. Development and Validation of a Micellar Liquid Chromatographic Method with UV Detection for Determination of Azithromycin in Tablets and Capsules. Chromatographia, 2004; 60 (1-2).
Li, Pao, Guorong Du, Wensheng Cai, Xueguang Shao. Rapid and nondestructive analysis of pharmaceutical products using near-infrared diffuse reflectance spectroscopy. Journal of Pharmaceutical and Biomedical Analysis, 2012; 70:288-294.
Luke David R., and George Foulds.Disposition of oral azithromycin in humans. Clinical Pharmacology & Therapeutics, 1997; 61 (6):641-648.
Meng Zhong, Yue Feng, Hong Liao, Xueyuan Hu, Shengli Wan, Biyue Zhu, Mi Zhang, Huarong Xiong, Yunli Zhou, Jingqing Zhang. Azithromycin Cationic Non-Lecithoid Nano/Microparticles Improve Bioavailability and Targeting Efficiency. Pharm Res., 2014; 31:2857 - 2867.
Miguel, L., and C. Barbas.LC determination of impurities in azithromycin tablets. Journal of Pharmaceutical and Biomedical Analysis, 2003; 33 (2):211-217.
M. Senthil Raja, Shan. S.Ha., P. Perumala., and M.T.S. Moorthy. RP-HPLC method development and validation for the simultaneous estimation of azithromycin and ambroxol hydrochloride in tablets. International Journal of PharmTech Research, 2010; 2 (1): 36-39.
Nigović, Biljana, and Branimir Šimunić.Voltammetric assay of azithromycin in pharmaceutical dosage forms. Journal of Pharmaceutical and Biomedical Analysis, 2003; 32 (1):197-202.
Peng, J. Y., C. T. Hou, X. X. Liu, H. B. Li, X. Y. Hu. Electrochemical behavior of azithromycin at graphene and ionic liquid composite film modified electrode. Talanta, 2011; 86:227-32.
Pfizer Laboratories. 2013. "ZITHROMAX® azithromycin tablets and azithromycin for oral suspension". [ONLINE] Available at: http://labeling.pfizer.com/ShowLabeling.aspx?id=511. [Accessed on 05 April 2017].
Pouretedal, Hamid Reza.Preparation and characterization of azithromycin nanodrug using solvent/antisolvent method. Int. Nano Lett, 2014; 4 (103):1 - 9.
Pouton, Colin W.Lipid formulations for oral administration of drugs: non-emulsifying, self-emulsifying and ‘self-microemulsifying’ drug delivery systems. European Journal of Pharmaceutical Sciences, 2000; 11, Supplement 2:S93-S98.
Pouton, Colin W.Formulation of poorly water-soluble drugs for oral administration: Physicochemical and physiological issues and the lipid formulation classification system. European Journal of Pharmaceutical Sciences, 2006; 29 (3–4):278-287.
Rachidi, M., J. Elharti, K. Digua, Y. Cherrah, A. Bouklouze. New Spectrophotometric Method for Azithromycin Determination. Analytical Letters, 2006; 39 (9):1917-1926.
Ramesh M., Durga M. Kanaka, Sravani A., Snehalatha T., Thimmareddy D.A New Stability Indicating Validated RP-HPLC Method for the Simultaneous Estimation of Azithromycin and Cefixime in Bulk and Pharmaceutical Dosage Forms. Asian Journal of Research In Chemistry, 2012; 5 (8):1067 - 1073.
Rockville, MD. Porter, Christopher J. H., Colin W. Pouton, Jean F. Cuine, and William N. Charman. Enhancing intestinal drug solubilisation using lipid-based delivery systems. Advanced Drug Delivery Reviews, 2008; 60 (6):673-691.
Sangita N Waghule, Nitin P. Jain, Chetan J Patani, and Aparana C. Patani.M ethod development and validation of HPLC method for determination of azithromycin. Der Pharma Chemica, 2013; 5 (4):166 - 172.
Sayed, Rania A., Wafaa S. Hassan, Magda Y. El-Mammli, and Abadalla Shalaby. New Spectrophotometric and Conductometric Methods for Macrolide Antibiotics Determination in Pure and Pharmaceutical Dosage Forms Using Rose Bengal. Journal of Spectroscopy, 2013; 2013:13.
Shaikh, K. A., S. D. Patil, and A. B. Devkhile.Development and validation of a reversed-phase HPLC method for simultaneous estimation of ambroxol hydrochloride and azithromycin in tablet dosage form. Journal of Pharmaceutical and Biomedical Analysis, 2008; 48 (5):1481-1484.
Shen, Yan, Chun Yin, Mengxiang Su, and Jiasheng Tu. Rapid, sensitive and selective liquid chromatography–tandem mass spectrometry (LC–MS/MS) method for the quantification of topically applied azithromycin in rabbit conjunctiva tissues. Journal of Pharmaceutical and Biomedical Analysis, 2010; 52 (1):99-104.
Shende, Chetan, Wayne Smith, Carl Brouillette, Stuart Farquharson.Drug Stability Analysis by Raman Spectroscopy. Pharmaceutics, 2014; 6 (4):651-662.
Subbareddy, P., and Divakar, T.E. New Stability Indicating Analytical Method Development and Validation for the Simultaneous Estimation of Azithromycin and Ambroxol Hydrochloride in Bulk and Tablet Dosage Form Using RP-HPLC. American Journal of PharmTech Research, 2015; 5 (4):652 - 662.
(USP) - United States Pharmacopoeia/National Formulary. 38th ed. Rockville, MD: Pharmacopeial Convention; 2015; p. 2339.
Wang, Jian.Analysis of macrolide antibiotics, using liquid chromatography-mass spectrometry, in food, biological and environmental matrices. Mass Spectrometry Reviews, 2009; 28 (1):50-92.
World Health Organization (WHO), 2013. Model List of Essential Medicines. [ONLINE] Available at:
http://www.who.int/medicines/publications/essentialmedicines/e n/index.html. [Accessed on 05 April 2017].
Yan Liu, Xia Lin and Xing Tang. Lipid emulsions as a potential delivery system for ocular use of azithromycin. Drug Development and Industrial Pharmacy, 2009; 35 (7):887–896.
How to cite this article: