R E S E A R C H
Open Access
Protein interaction and functional data
indicate MTHFD2 involvement in RNA
processing and translation
Costas Koufaris
1,2,3and Roland Nilsson
1,2,3*Abstract
Background:The folate-coupled metabolic enzyme MTHFD2 is overexpressed in many tumor types and required for cancer cell proliferation, and is therefore of interest as a potential cancer therapeutic target. However, recent evidence suggests that MTHFD2 has a non-enzymatic function which may underlie the dependence of cancer cells on this protein. Understanding this non-enzymatic function is important for optimal targeting of MTHFD2 in cancer.
Methods:To identify potential non-enzymatic functions of MTHFD2, we defined its interacting proteins using co-immunoprecipitation and mass spectrometry and integrated this information with large-scale co-expression analysis, protein dynamics, and gene expression response to MTHFD2 knockdown.
Results:We found that MTHFD2 physically interacts with a set of nuclear proteins involved in RNA metabolism and translation, including components of the small ribosomal subunit and multiple members of the RNA-processing hnRNP family. Interacting proteins were also in general co-expressed with MTHFD2 in experiments that stimulate or repress proliferation, suggesting a close functional relationship. Also, unlike other folate one-carbon enzymes, the MTHFD2 protein has a short half-life and responds rapidly to serum. Finally, shRNA against MTHFD2 depletes several of its interactors and yields an overall transcriptional response similar to targeted inhibition of certain ribosomal subunits.
Conclusions:Taken together, our findings suggest a novel function of MTHFD2 in RNA metabolism and translation.
Keywords:Interactome, Moonlighting, Heat shock proteins, RNA, Non-metabolic
Background
Altered metabolism is a hallmark of cancer cells that facilitates their growth and survival [1]. In particular, me-tabolism of folate-coupled one-carbon groups is repro-grammed in a wide variety of cancers [2–4]. One-carbon metabolism is localized into cytosolic, mitochondrial, and nuclear compartments (Fig.1) and is required for the syn-thesis of purines, dTMP, and remethylation of homocyst-eine to methionine. Extensive evidence now supports that proliferating cancer cells primarily rely on the mitochon-drial catabolism of serine via SHMT2 as their main source of one-carbon groups [5–7], rather than the correspond-ing cytosolic enzymes. The reason for this preference is
unclear, but may be due to the mitochondrial NADH/ NAD ratio favoring flux in the oxidative direction [8], or related to the associated reduction of NAD and NADP [7]. In the nucleus, the formate produced by the mito-chondrial pathway supports synthesis of dTMP during DNA replication.
Within mitochondrial folate one-carbon metabolism, the enzyme MTHFD2 has attracted considerable attention as a potential target for cancer therapeutics [4,9,10], mo-tivated by a favorable expression profile with high
expres-sion in various human tumor types [4] but low or
undetectable levels in most adult tissues. The normal function of MTHFD2 may be in embryogenesis, since the enzyme has long been known to be highly expressed and essential during embryonic development [11], and a par-alogous mitochondrial enzyme, MTHFD2L, is expressed in normal adult tissues [12]. Expression of MTHFD2 in tumors also correlates with poor disease outcome in * Correspondence:[email protected]
1
Cardiovascular Medicine Unit, Department of Medicine, Karolinska Institutet, SE-171 76 Stockholm, Sweden
2Division of Cardiovascular Medicine, Karolinska University Hospital, SE-171 76 Stockholm, Sweden
Full list of author information is available at the end of the article
breast cancer [13], liver cancer [14], and acute myeloid
leukemia (AML) [10]. Knockdown of MTHFD2 can
in-hibit cancer cell proliferation in vitro [4, 10, 15] and re-duces (but does not abolish) tumor growth in vivo [7,10]. This combination of specific expression in transformed cells and severe cell phenotypes upon knockdown render MTHFD2 a compelling potential drug target.
Nevertheless, several observations suggest that the known metabolic function of MTHFD2 may not be the sole explanation for its prominent role in cancer. First, supplementing cultures with formate, the primary product of the mitochondrial pathway (Fig. 1), fails to rescue MTHFD2 knockdown cancer cells [4,10], indicating that another function of the MTHFD2 protein might be neces-sary for growth. Second, cells can rapidly adapt to loss of MTHFD2 by shifting to the cytosolic one-carbon pathway [7], suggesting a degree of redundancy where flux through the mitochondrial pathway is not strictly essential. Third, knockdown of the SHMT2 enzyme, which should also block the mitochondrial pathway, does not cause cell death unless glycine is removed [2, 16]. Moreover, the MTHFD2 protein was recently found to be present in the nucleus at sites of newly synthesized DNA, and over-expression of catalytically inactive MTHFD2 drives cell proliferation [17], suggestive of a role in signaling/ regulation rather than metabolism. Knockdown of MTHFD2 also affects invasion and migration in vitro [14,
18], although no obvious mechanistic link exists between one-carbon metabolism and these phenotypes.
Given these observations, it is becoming clear that the effective targeting of the MTHFD2 protein requires a better understanding of its role in cancer cells beyond
metabolism. Although chemical inhibitors of the
MTHFD enzymatic activity have been reported [19,20], different strategies may be required if a non-enzymatic function of the MTHFD2 enzyme is critical for cancer cells. For these reasons, we performed an initial investi-gation of the possible non-metabolic functions of MTHFD2 by mapping the protein’s interacting partners,
co-expression pattern and the transcriptional responses to knockdown. Taken together, our results suggest a pre-viously unrecognized role for MTHFD2 in RNA metab-olism and translation.
Methods Cell culture
HCT-116 cell lines were obtained from the National
Cancer Institute. The MTHFD2 CRISPR−/− knockout
(D2-KO) and parental wildtype (WT) HCT-116 cells were obtained from the lab of Dr. Rabinowitz [7]. Cells were grown in RPMI-1640 medium supplemented with 5% FBS (Life technologies) and Penicillin/Streptomycin (Gibco) and maintained at 37 °C and 5% CO2.
For serum starvation experiments, 200,000 cells were plated in six-well plates. The next day, the medium was removed, the cells were washed with PBS and then serum-free RPMI-1640 medium was added. Cyclohexa-mide was obtained from Sigma Aldrich (C4859). For the serum re-stimulation experiments, after 48 h of serum starvation, wells were washed with PBS and then fresh RPMI-1640 containing 20% FBS was added to the cells.
Real-time PCR
RNA was isolated from cells using the Qiagen RNeasy mini kit and quantified using a Nanodrop ND-1000 spectropho-tometer. The RNA was reverse transcribed to cDNA using the VILO cDNA synthesis kit (Invitrogen). The qPCR reactions were performed in triplicate on a StepOne Real-Time PCR machine (Thermo Fisher Scientific) using the Fast SYBR Green master mix (Thermo Fisher Scientific). Oligos were ordered from Sigma Aldrich. Primer sequences are listed in Additional file1. Relative amounts of mRNA were calculated using theΔΔCTmethod normal-ized to RPLPO mRNA as a reference.
Immunoblotting
Total protein was isolated from cells using RIPA buffer (Thermo Fisher Scientific), with the addition of × 100 purines
ch2-thf ch2-thf
ch2-thf dtmp
cho-thf MTHFD2
MTHFD1L MTHFD1
MTHFD1 TYMS
MTHFD2?
serine serine
mitochondrion
nucleus cytosol
glycine glycine
nad(p)h SHMT1
glycine SHMT1/2
serine
SHMT2
ALDH1L2 cho-thf
formate formate MTHFD1
MTHFD1
cho-thf
formate co2
nadph
Halt protease inhibitors (Thermo Fisher Scientific) just prior to the extraction. Protein from nuclear and cyto-solic cellular compartments were fragmented as de-scribed previously [17]. Protein levels were quantified by the BCA assay (Pierce). Equal amounts of protein (10– 20μg) were loaded per lane of 10% SDS-PAGE gel. The following primary antibodies were incubated overnight: anti-MTHFD2 (Proteintech 12270-1-AP); anti-MTHFD1 (Proteintech 6113-1-AP); anti-MTHFD1L (Proteintech
10794-1-AP); Lamin A/C (Thermo Fisher
Scien-tific MA3-1000); HSP60 (Abcam ab46798); Tubulin (Abcam ab6046); and COX IV (Abcam 33985). Quantifi-cation of protein bands was performed using the ImageJ software and values were normalized to tubulin for each sample.
Co-immunoprecipitation
WT and D2-KO HCT-116 cells were lysed using the mod-erate Pierce IP lysis buffer (Thermo Fisher Scientific) with addition of × 100 Halt protease inhibitors (Thermo Fisher Scientific). All steps were performed at 4 °C to reduce pro-tein disassociation. The propro-tein lysate was quantified using the BCA assay, and 1 or 2 mg of lysate was used for im-munoprecipitation with no cross-linkage. Immunoprecipi-tation was performed using two separate anti-MTHFD2 antibodies (Proteintech 12270-1-AP (AP) and Genetex N1C3 (NC)) or an anti-rabbit immunoglobulin (IgG) (Santa Cruz). The immunoprecipitation was performed at 4 °C for 2 h using Dynabeads Protein A (Thermo Fisher Scientific) following the manufacturer’s instructions.
In-gel digestion and mass spectrometry
Immunoprecipitated proteins were eluted from Dyna-beads through a combination of elution buffer and heat-ing and separated on a 10% SDS gel. In-gel stainheat-ing of proteins was performed using the SilverQuest silver staining kit (Thermo Fisher Scientific). Protein lanes were excised manually and in-gel digested using a MassPREP robotic protein-handling system (Waters, Millford, MA, USA). Gel pieces were distained twice
with 100μL of 50 mM ammonium bicarbonate (AmBic)
containing 50% acetonitrile at 40 °C for 10 min. Proteins were reduced with 10 mM DTT in 100 mM Ambic for 30 min at 40 °C and alkylated with 55 mM iodoaceta-mide in 100 mM AmBic at 40 °C for 20 min followed with in-gel digestion with 0.3 μg trypsin (sequence grade, Promega, Madison, WI, USA) in 50 mM at 40 °C AmBic for 5 h. The tryptic peptides were extracted with 1% formic acid in 2% acetonitrile, followed by 50% acetonitrile twice. The liquid was evaporated to dryness, and the peptides were reconstituted in 10 μL of 2% acetonitrile/0.1% formic acid. Five microliters of the samples was injected onto the LC-MS/MS system (Ultimate™3000 RSLCnano chromatography system and
Q Exactive HF Orbitrap mass spectrometer, Thermo Scientific). The peptides were separated on an Easy-C18 column, 50 cm (Thermo Fisher Scientific) at 55 °C in a 120-min gradient at a flow rate of 300 nL/min. The lin-ear gradient was from 5 to 26% of buffer B (98% aceto-nitrile/0.1% formic acid) in 115 min and to 95% of buffer B in 5 min.
We used data-dependent acquisition with a survey scan range of 300 to 1650 m/z, at a resolution of 120,000 m/z and selected up to 16 most abundant features with a charge state ≥2 for HCD fragmentation at a normalized collision energy of 26 and a resolution of 30,000 at m/z 200. To limit repeated sequencing, dynamic exclusion of sequenced peptides was set to 90 s. Thresholds for ion in-jection time and ion target values were set to 250 ms and 5 × 10⁶ for the survey scans, and 120 ms and 2 × 10⁵ for the MS/MS scans. Data were acquired using the Xcalibur software (Thermo Fisher Scientific). The spectra were ana-lyzed using the Mascot search engine v. 2.4 (Matrix Sci-ence Ltd., UK) using carbamidomethylation (C) as fixed and deamidation (NQ), oxidation (M) as variable modifi-cation. The precursor mass tolerance was set to 10 ppm while MS/MS tolerance was 0.02 Da allowing 2 missed cleavages. The SwissProt database was used with tax-onomy limited toHomo sapiens.
In total, we performed 12 Co-IP experiments (for HCT-116 WT, 4 using AP antibody, 2 using NC anti-body, and 2 using IgG antibody; for HCT-116 D2-KO, 2 using AP antibody and 2 using NC antibody) followed by MS analysis. A protein was considered as high confi-dence if at least two unique peptides were detected in 50% of IP-MS samples for each of the MTHFD2 anti-bodies used and was not detected in any of the IP-MS samples from D2-KO cells, nor the IgG isotype control IP-MS samples.
Protein-protein interaction network
A protein-protein interaction network was extracted from the STRING database v10.5 [21] using the set of MTHFD2 interacting proteins identified here. Only ex-perimental data (e.g., from co-purifications and yeast two hybrids) imported in STRING from primary sources were used for constructing the network. Threshold for connections between proteins was set at medium score (more than 0.400) as calculated in STRING, and gene ontology (GO) enrichment was calculated.
Half-life analysis
Co-expression analysis
Calculation of gene co-expression was performed using a clustering-based method, as described previously [17]. Briefly, we analyzed 25,485 genes represented on a var-iety of microarray platforms for co-expression with MTHFD2 across 8097 human, mouse and rat data sets obtained from the Gene Expression Omnibus (GEO). From the resulting matrix of coexpression scoresxgd, we
computed the overall coexpression score wg for each
gene g by simply summing over all data sets d. We se-lected the 50 data sets showing highest coexpression for the D2PPI genes by scoring each data set by the
weighted sum X
g
wgxgd, where g ranges over the 29
genes in the D2PPI gene set; and similarly for the ATF4 gene set (Fig.3b). Example data sets from GEO (Fig.3c–f) were analyzed as deposited on GEO, with no further normalization. In cases where multiple probes against a single gene were present on the arrays, the probe with highest mean signal across all samples was used. Enrich-ment analysis was done using the GSEA-P statistic [25], and an enrichmentpvalue was calculated by gene permu-tation (10,000 permupermu-tations). An independent analysis was made using the SEEK tool (http://seek.princeton.edu) with default settings [26].
Connectivity Map (CMap) analysis
Expression data from the Connectivity Map (CMap) pro-ject in Level 5 (signature) GCTX format was obtained from GEO (accession GSE92742), and data for 99 experi-ments with five distinct shRNA hairpins against MTHFD2 across 12,328 measured genes was extracted using R v.3.3.3 and the cmapR package (https://github.com/cmap/ cmapR). Since the three hairpins TRCN0000036550,
TRCN0000036551, and TRCN0000036553 exhibited
strongest knockdown on MTHFD2 itself, these were used for subsequent analysis. Data from the ASC and NPC cell lines were discarded due to few replicates. The z-scores for the remaining 9 cell lines were averaged into a final
z-score vector, which was used for enrichment analysis using the GSEA-P statistic [25]. The genesets examined were downloaded from ConsensusPathDB collection (http://cpdb.molgen.mpg.de/). An enrichmentpvalue was calculated by gene permutation (10,000 permutations).
Connectivity scores between hairpins targeting three one-carbon enzymes included in CMap (MTHFD2, MTHFD1, and SHMT1) and hairpins targeting 3799 ex-amined genes were analyzed using the CMap online tools (https://clue.io/cmap). Connectivity scores of more than 90 or less than−90 were considered as significantly enriched. Clustering analysis of connectivity scores was performed using ClustVis [27] with average linkage and correlation metric. Ribosomal genes were selected for
analysis based on the KEGG ribosome gene set (entry hsa03010).
RNAi and CRISPR screening data analysis
Global RNAi and CRISPR screening data were per-formed as part of the Achilles project in 501 and 342 cell lines respectively [28, 29]. We also examined a second CRISPR study conducted in 14 AML cell lines [30]. To identify genes with similar dependencies across exam-ined cell lines in the RNAi and CRISPR screens, we cal-culated Pearson’s correlation for MTHFD2 against all examined genes in both datasets.
Results
Protein interaction partners of MTHFD2
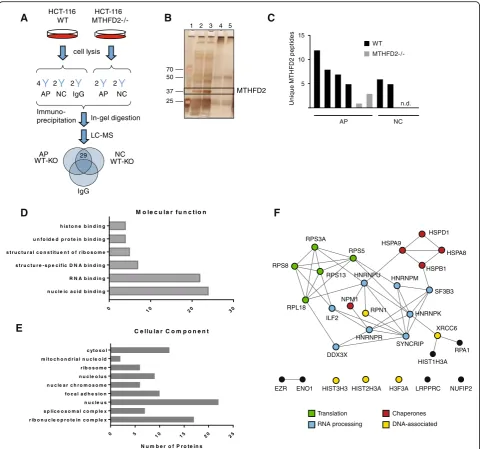
Since a non-metabolic function of MTHFD2 would likely involve direct physical contact with other proteins, we decided to first perform co-immunoprecipitation (Co-IP) of MTHFD2-interacting proteins followed by mass spectrometry (MS) to identify its binding partners. To avoid potential artifacts due to unspecific antibody binding, we chose to perform Co-IP experiments in
wildtype (WT) and CRISPR MTHFD2 knockout
(D2-KO) HCT-116 cells [7], using two distinct MTHFD2 antibodies, 12270-1AP (AP; Proteintech) and N3C3 (NC; Genetex) as well as an isotype control (IgG) anti-body (Fig. 2a). We first confirmed by immunoblotting and IP that the MTHFD2 protein was absent from D2-KO cells (Additional file 2). Next, we performed Co-IP followed by SDS-PAGE and silstaining to ver-ify the efficient immunoprecipitation of MTHFD2. This analysis revealed a strong band at the expected size of MTHFD2, as well as a large number of other immunoprecipitated protein bands (Fig. 2b). In D2-KO cells, the MTHFD2 band was not detected, but other protein bands were still observable, presumably due
to non-specific binding of the antibodies used
(Additional file 2). Detected peptide fragments in all ex-amined Co-IP lysates are listed in Additional file 3. Reassuringly, MTHFD2 itself was reliably identified from WT cells using both antibodies and strongly decreased in the D2-KO lysates (Fig.2c).
We defined high-confidence MTHFD2-interacting pro-teins as those that were reliably detected by Co-IP in WT but not D2-KO cells, using both the AP and NC antibodies, and were also absent from IgG lysates (Fig.2a;
Methods). With these criteria, we identified 29
MTHFD2-interacting proteins, from here on referred to as the D2PPI gene set (Table1). The majority of these pro-teins have been reported to localize to the nucleus, consistent with previous evidence that MTHFD2 is also
a nuclear protein [17]. While two mitochondrial
D2PPI proteins. We did detect MTHFD1 using the AP anti-body, but this protein was found in D2-KO cells as well, in-dicating that this interaction is due to unspecific binding. Hence, MTHFD2 does not appear to participate in the previ-ously reported nuclear thymidylate synthesis complex [31].
Gene Ontology (GO) analysis of these proteins confirmed a highly significant enrichment of RNA binding proteins (24/29 proteins; q< 10−20) (Fig. 2d; Additional file 4) and that a large fraction of these proteins were also nu-clear (Fig. 2e). To determine if the D2PPI proteins
0 5
10 15 20 25
r ib o n u c le o p r o t e in c o m p le x s p lic e o s o m a l c o m p le x n u c le u s f o c a l a d h e s io n n u c le a r c h r o m o s o m e n u c le o lu s r ib o s o m e m it o c h o n d r ia l n u c le o id c yt o s o l
C e llu la r C o m p o n e n t
N u m b e r o f P r o t e in s
0 10 20 30
n u c le ic a c id b in d in g R N A b in d in g s t r u c t u r e - s p e c if ic D N A b in d in g s t r u c t u r a l c o n s t it u e n t o f r ib o s o m e u n f o ld e d p r o t e in b in d in g h is t o n e b in d in g
M o le c u la r f u n c t io n
MTHFD2
1
25
2 3 4 5
Unique
MTHF
D
2
pep
tides
C A
D F
E
B
cell lysis
AP NC IgG AP NC
Immuno-precipitation In-gel digestion
LC-MS
4 2 2 2 2
29
IgG AP
WT-KO WT-KONC
HCT-116 HCT-116
WT
MTHFD2-/-HSPD1 HSPA9
HSPA8
HSPB1 RPS3A
HIST3H3
Translation RNA processing
Chaperones DNA-associated RPS5
HNRNPM RPS13
SF3B3 RPS8
ENO1 EZR
HNRNPU
RPL18 ILF2
H3F3A RPN1
HNRNPR
SYNCRIP HNRNPK
NUFIP2 DDX3X
NPM1
LRPPRC XRCC6
HIST2H3A
RPA1
HIST1H3A 5
10 15
AP NC
WT
n.d.
MTHFD2-/-37 50 70
belonged to any known complexes, we extracted a protein-protein interaction (PPI) network over these 29 proteins from the STRING database [21]. We ob-tained 47 physical interactions, which is two times more than expected by chance (p< 10−7); hence, the D2PPI proteins are likely part of previously known protein complexes, including the small ribosomal sub-unit proteins (four RPS proteins), RNA processing proteins (several hnRNP family members; SF3B3; ILF2), protein chaperones (several heat shock pro-teins; NPM1), and histone/DNA repair proteins (three histone proteins; XRCC6; RPN1) (Fig. 2f ). Hence, the
proteins shown here to directly interact with
MTHFD2 indicate a role for the protein in metabol-ism and translation of RNA.
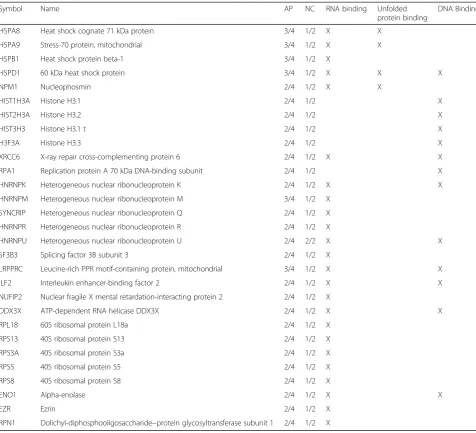
Co-expression analysis of MTHFD2 and interacting proteins To systematically assess if the D2PPI proteins indeed share a common function with MTHFD2, we next asked whether their mRNAs are also frequently co-expressed with MTHFD2. We have previously shown that frequent co-expression across diverse experimental conditions is highly predictive of closely related biological function [32, 33]. Using a previously described method [17], we scored 25,845 genes for co-expression with MTHFD2 in 8067 human, rat, and mouse microarray datasets (Additional file5). Remarkably, D2PPI gene set was clearly
enriched for coexpression with MTHFD2 (p= 0.003,
permutation test), with 13 of 29 of genes within the 95th percentile of coexpression scores (Fig. 3a). An exception was the histone proteins H3F3A, HIST1H3A, HIST3H3, Table 1MTHFD2 protein interactors identified by CoIP and MS
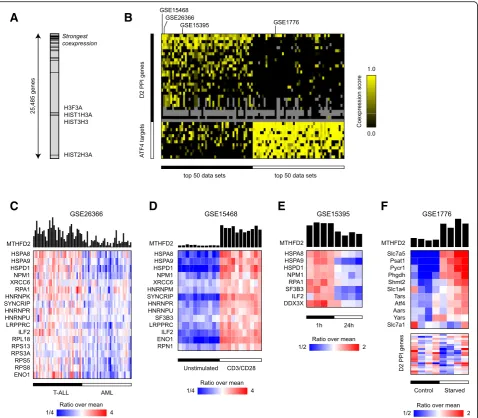
Symbol Name AP NC RNA binding Unfolded
protein binding
DNA Binding
HSPA8 Heat shock cognate 71 kDa protein 3/4 1/2 X X
HSPA9 Stress-70 protein, mitochondrial 3/4 1/2 X X
HSPB1 Heat shock protein beta-1 3/4 1/2 X
HSPD1 60 kDa heat shock protein 3/4 1/2 X X X
NPM1 Nucleophosmin 2/4 1/2 X X
HIST1H3A Histone H3.1 2/4 1/2 X
HIST2H3A Histone H3.2 2/4 1/2 X
HIST3H3 Histone H3.1 t 2/4 1/2 X
H3F3A Histone H3.3 2/4 1/2 X
XRCC6 X-ray repair cross-complementing protein 6 2/4 1/2 X X
RPA1 Replication protein A 70 kDa DNA-binding subunit 2/4 1/2 X
HNRNPK Heterogeneous nuclear ribonucleoprotein K 2/4 1/2 X X
HNRNPM Heterogeneous nuclear ribonucleoprotein M 3/4 1/2 X
SYNCRIP Heterogeneous nuclear ribonucleoprotein Q 2/4 1/2 X
HNRNPR Heterogeneous nuclear ribonucleoprotein R 2/4 1/2 X
HNRNPU Heterogeneous nuclear ribonucleoprotein U 2/4 2/2 X X
SF3B3 Splicing factor 3B subunit 3 2/4 1/2 X
LRPPRC Leucine-rich PPR motif-containing protein, mitochondrial 3/4 1/2 X X
ILF2 Interleukin enhancer-binding factor 2 2/4 1/2 X X
NUFIP2 Nuclear fragile X mental retardation-interacting protein 2 2/4 1/2 X
DDX3X ATP-dependent RNA helicase DDX3X 2/4 1/2 X X
RPL18 60S ribosomal protein L18a 2/4 1/2 X
RPS13 40S ribosomal protein S13 2/4 1/2 X
RPS3A 40S ribosomal protein S3a 2/4 1/2 X
RPS5 40S ribosomal protein S5 2/4 1/2 X
RPS8 40S ribosomal protein S8 2/4 1/2 X
ENO1 Alpha-enolase 2/4 1/2 X X
EZR Ezrin 2/4 1/2 X
RPN1 Dolichyl-diphosphooligosaccharide--protein glycosyltransferase subunit 1 2/4 1/2 X
and HIST2H3A that did not exhibit co-expression with MTHFD2; however, these proteins were not well-repre-sented on the microarrays used, so this result may reflect low power to detect coexpression. An independent ana-lysis of 3356 human gene expression datasets using the SEEK gene co-expression analysis tool [26] gave similar results (Additional file5). To investigate factors that might drive the observed coexpression of the D2PPI gene set, we identified specific gene expression data sets where this set was coexpressed (Fig. 3b, Additional file 6). Among the top scoring data sets were several tumor gene expression studies, where expression varied between subtypes; for
example, in one leukemia study, highest expression was found in T-ALL and lowest in AML subtypes, suggesting specific disease contexts where the D2PPI proteins may be relevant (Fig.3c). We also noted a concerted induction of the D2PPI proteins in stimulated T cells (Fig. 3d), in line with previous observations of MTHFD2 induction in this setting [4], and also suppression of D2PPI genes in HCT-116 cancer cells in response to treatment with a
CDK inhibitor (Fig. 3e). These data indicate that
MTHFD2 and the D2PPI genes are frequently
coexpressed and responsive to mitogenic stimuli and anti-proliferative drugs.
A
C
D
E
F
B
Fig. 3MTHFD2-interacting proteins are coexpressed with MTHFD2 in response to stimuli.aEnrichment plot showing the ranks of MTHFD2-interacting (D2PPI) proteins ordered by overall coexpression with MTHFD2 across 8067 gene expression data sets (see Methods).bHeat map of coexpression score for the D2PPI and ATF4 gene sets, across the 50 data sets exhibiting with strongest coexpression for each set. Data sets selected for panels
As previously shown [17], a set of ATF4-responsive mRNAs involved in amino acid metabolism and aminoacyl-tRNA synthesis, including the mitochondrial folate-coupled enzymes SHMT2 and MTHFD1L, was also strongly co-expressed with MTHFD2. However, we found that these genes co-express with MTHFD2 in dif-ferent conditions than the MTHFD2-interacting proteins (Fig.3b, Additional file6), suggesting that the underlying mechanism is different. For example, the mitochondrial enzymes were induced in contexts of amino acid starva-tion, possibly reflecting the involvement of this pathway in amino acid synthesis, while the D2PPI genes were not (Fig. 3f ). In summary, the D2PPI genes are co-regulated with MTHFD2 in specific biological conditions, provid-ing independent evidence that they share a biological function with MTHFD2, which appears to be distinct from ATF4-driven induction of MTHFD2.
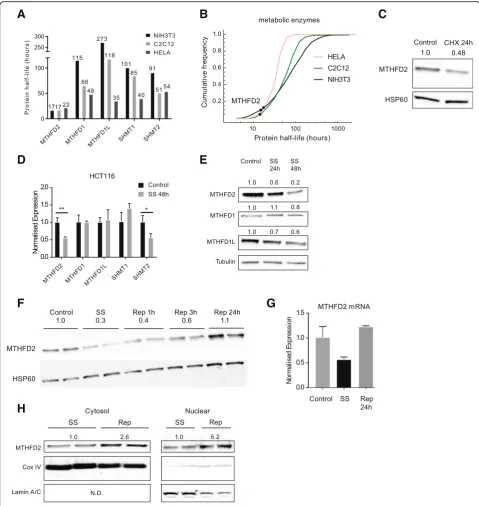
MTHFD2 is a rapidly regulated protein with a short half-life Given the above finding that MTHFD2 and the D2PPI gene set is acutely regulated by pro- and anti-proliferative stimuli, we examined in more detail the dynamics of MTHFD2 regulation. Generally, metabolic enzymes are long-lived proteins, while proteins involved in RNA me-tabolism, cell cycle, and signaling have shorter half-lives [22]. In a reanalysis of global protein half-life data [22,23], we noted that the half-life of the MTHFD2 protein was consistently within 17–22 h in HeLa, C2C12, and NIH3T3 cells, which was markedly lower than the other folate one-carbon enzymes (Fig.4a) and within the 5–10th per-centile of all detected enzymes (as defined by Recon2 [24]; 596–605 enzymes were detected across three cell lines) (Fig.4b). We confirmed this short half-life of MTHFD2 by treatment with the cyclohexamide inhibitor of protein synthesis, which resulted in an approximate halving of protein levels after 24 h (Fig. 4c). Therefore, MTHFD2 is unusually short-lived for a metabolic enzyme in general, and one-carbon enzymes in particular.
Considering the short half-life of MTHFD2, we next examined the regulation of the MTHFD2 protein com-pared to other enzymes in the mitochondrial folate path-way. In HCT-116 cells, after 48 h serum starvation, MTHFD2 and SHMT2 mRNA was significantly de-creased, while SHMT1, MTHFD1, and MTHFD1L was unaffected (Fig.4d). At the protein level, MTHFD2 and MTHFD1L decreased noticeably at the 24 h time point, while MTHFD1 did not (Fig. 4e), consistent with the shorter half-life of MTHFD2. In serum restimulated HCT-116 cells, MTHFD2 protein was induced within 3 h (Fig. 4f ), consistent with our previous report [17]. Moreover, induction of the protein was observed in both the nuclear and cytoplasmic compartments (Fig. 4h), and also on the mRNA level (Fig. 4g). Our data show therefore that enzymes of the one-carbon pathway differ
in their response to serum depletion and stimulation, with MTHFD2 being particularly responsive.
Transcriptional response to MTHFD2 knockdown in cancer cells
To study the effects of loss of MTHFD2, and how these relate to its identified interacting proteins, we analyzed transcriptomics data from MTHFD2 shRNA knockdown cells generated by the Connectivity Map (CMap) project [34]. Interestingly, the D2PPI gene set was clearly de-creased (ES -0.64, p< 10−4) in MTHFD2 knockdown
cells (Fig. 5a) and was among the most negatively
enriched among examined collection of 3581 gene sets (Fig. 5b). Hence, loss of MTHFD2 affects expression of the D2PPI genes, consistent with a shared function.
The CMap data also allows assessing functional rela-tionship between genes by scoring the similarity of tran-scriptional response of cancer cells to individual gene knockdown. In this regard, knockdown of MTHFD2 was highly similar (score > 90/100) to four out of the 14 D2PPI genes represented in CMap: HSPA8, HSPA9, HSPD1, and
RPS3A. In contrast, with this criterion, other
folate-metabolizing enzymes present in the CMap data set (MTHFD1, SHMT2, GLDC, AMT, TYMS, MTR, MTRR, FTCD, and DHFR) were not similar to MTHFD2, with the exception of MTHFD1 (score = 91.0, rank 414/3798), pos-sibly reflecting the fact that loss of MTHFD1 also gives se-vere growth phenotypes [7]. In particular, SHMT2 was not closely related (score = 18.74 of 100, rank 2790/3798), consistent with the observations that loss of MTHFD2 is often detrimental to cells [4], while SHMT2 is not [2], and suggesting that at least some effects of MTHFD2 suppres-sion are unrelated to mitochondrial folate metabolism.
Finally, we investigated the sets of genes that in CMap were highly similar to MTHFD2. We noted that, across all 3798 genes for which shRNA data was available in the CMap data set, MTHFD2 was highly similar (absolute score > 90) to 510 genes, compared to only 266 for SHMT2 and 169 for MTHFD1, indicating that loss MTHFD2 induces a response that more commonly occurs with gene knockdown. In addition, the set of 510 genes similar to MTHFD2 in this respect were clearly different from those of SHMT2 and MTHFD1 (Fig.5c), again con-sistent with MTHFD2 having a distinct function. In par-ticular, knockdown of MTHFD2, but not SHMT2 or MTHFD1, was highly similar to knockdown of a group of ribosomal proteins (Fig. 5d). Therefore, MTHFD2 is unique in that suppression of this protein causes cellular transcriptomic responses that are highly similar to those observed following the targeting of ribosomal proteins.
A
B
D
F
H
G
E
C
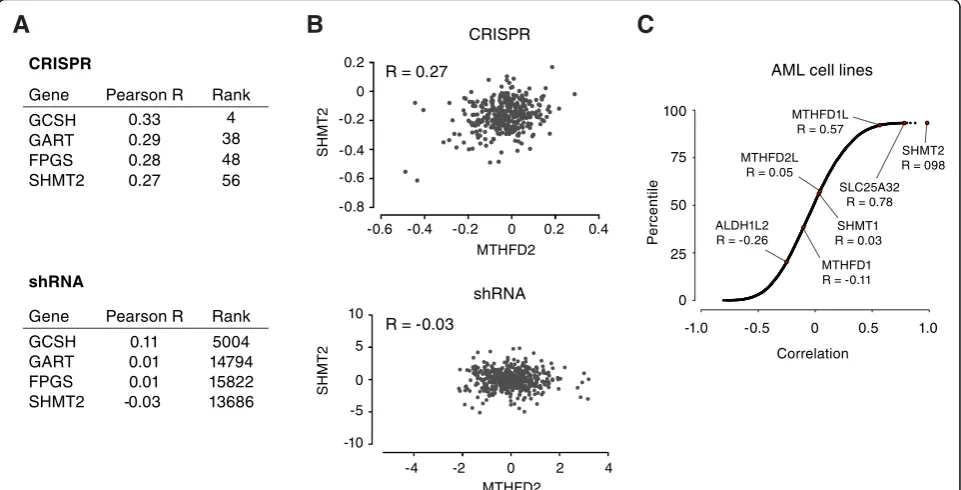
Fig. 4MTHFD2 is a short-lived and dynamically regulated protein.aHalf-life of enzymes of the one-carbon pathway in in HeLa, C2C12, and NIH3T3 cell lines.bCumulative frequency of all quantified enzymes (596, 576, and 605 respectively) half-life in three cell lines. Dotted lines indicate relative half-life of MTHFD2 in each cell line.cEffect of treatment of HCT-116 cells for 24 h with 25 mg/ml protein translation inhibitor cyclohexamide on MTHFD2 protein levels.dqRT-PCR measurement of effect of 48 h serum starvation on mRNA of folate one-carbon enzymes.eImmunoblots of MTHFD1, MTHFD1L, MTHFD2, and beta-tubulin in HCT-116 grown in normal media or serum starved for 24 or 48 h.fImmunoblot showing time course of MTHFD2 protein response to serum replenishment in HCT-116 cells. SS, serum-starved; rep, serum replenishment (time point indicated).
upstream enzyme SHMT2, seemed counter-intuitive. A possible explanation is that shRNA knockdown cells still contain some residual protein, which may be sufficient to retain activity of a metabolic enzyme, but disrupts a more sensitive non-metabolic function such as control of translation. Indeed, there is evidence that a small amount of residual enzymatic activity can be sufficient to maintain necessary metabolic output, as seen for ex-ample with SHMT2 and formylmethionyl-tRNA pools [35]. To investigate this hypothesis, we compared the ef-fects of shRNA knockdown to efef-fects of CRISPR knock-out, using genome-wide shRNA and CRISPR screening data from the Achilles project, measuring growth pheno-types across 501 and 341 cell lines, respectively. Here, genes with shared functions are expected to have similar dependency profiles across cell lines [30]. Overall, 977 genes were similar to MTHFD2 in the shRNA screening data, and 161 with CRISPR screening (Pearson’s correl-ation, Bonferroni-correctedp< 0.05). Interestingly, genes involved in folate metabolism (SHMT2, GART, GCSH, FPGS) were similar to MTHFD2 in the CRISPR, but not in the shRNA screens (Fig. 6a, b, Additional file 7). Moreover, in a similar analysis of an independent CRISPR
dataset comprising 14 AML cell lines, SHMT2,
SLC25A32, and MTHFD1L were strongly correlated with MTHFD2, while cytosolic one-carbon enzymes showed
weak correlations (Fig. 6c). However, in these data sets, the D2PPI proteins frequently showed strong growth phenotypes across all cell lines and were not significantly correlated with MTHFD2 (data not shown). This is con-sistent with the notion that in CRISPR MTHFD2 knock-outs, the metabolic disruption dominates the effects on cell proliferation, while for shRNA knockdown, other functions of MTHFD2 may play a role.
Discussion
A common theme in cancer metabolism is that cancer-associated enzymes of interest as potential thera-peutic targets [36–38] are frequently found to have non-metabolic“moonlighting”functions [39, 40]. In this study, we have demonstrated that MTHFD2 interacts with ribosomal and RNA processing proteins (Fig. 2,
Table1), which are also coexpressed with MTHFD2, and give similar transcriptional phenotypes upon shRNA knockdown. These distinct methods provide independ-ent evidence suggesting that MTHFD2 has a previously unrecognized function in RNA metabolism and/or trans-lation, although further experiments are required to con-firm these findings, for example using ribosomal profiling, in-depth analysis of alternative splicing, and additional interaction data including reverse Co-IP ex-periments. The MTHFD2-interacting proteins clearly
C
D
B
16 ribosomal genes connectivity score connectivity score
A
MTHFD1 SHMT2 MTHFD2 SHMT2 MTHFD1 MTHFD2 100 0 50 -50 -100 Enr ichment score3582 gene sets
RP S 1 9 RP S 1 3 RP S 6 RP S 5 RP S 1 6 RP S9 RP S 1 0 RP S3A RP S2 7 A RP S 7 FA U RP S3 RP S 1 5 A RP L 7 UB A5 2 RP L 2 2 D2PPI D2PPI gene set
-1.0 -0.5 0.5 0 1.0 12,328 genes
510 high-scoring genes
60 80 0 40 20 Down Up
ES = -0.64 HIST3H3
HIST3H3 RPS5
Fig. 5Consequences of MTHFD2 knockdown.aEnrichment plot showing ranks of the D2PPI gene set among 12,328 genes responding to treatment with MTHFD2 shRNA in CMap study. Overall enrichment score was−0.64. Genes with low enrichment scores (histones and RSP5) are indicated.
consist of previously known complexes of proteins with related, but also diverse, functions. We found multiple members of the heterogeneous ribonuclear protein (hnRNP) family of RNA binding proteins, which are of particular interest for several reasons. hnRNPs are known to interact with nascent RNA and control their stability, localization, splicing, and translation, and sev-eral family members have been implicated in regulation of cell proliferation and in the endothelial-mesenchymal transition (EMT) process [41, 42], which are also af-fected by RNAi against MTHFD2 [42–44]. While the consequences of interaction between MTHFD2 and hnRNPs are not yet clear, one possibility is that this interaction may allow nuclear MTHFD2 to exert some control over gene expression; indeed, there are many ex-amples of hnRNP-interacting proteins influencing gene regulation via hnRNPs [45–47]. Moreover, hnRNPs may mediate signals on metabolic status: in particular, hnRNP-E1 has been reported to regulate gene transcrip-tion in response to folate starvatranscrip-tion [48]. We also ob-served interactions with components of the small ribosomal subunit, and with several heat-shock proteins (HSPs) that assist with the folding and transportation of
target proteins. While HSPs could interact with
MTHFD2 simply to assist its own folding, it is also pos-sible that MTHFD2 or other components of the ob-served complexes bind and that regulate the functions of
the HSPs [49]. Interestingly, some of the observed hnRNPs are involved in heat shock responses as well [50], hinting at a common role. We also found interac-tions with proteins involved in DNA repair and replica-tion (XRCC6 and RPN1), as well as histones (Fig. 2; Table 1, consistent with observations that the protein localize to regions of newly formed DNA [17]. Whether these findings represent more than one distinct function of the MTHFD2 protein, or rather are multiple aspects of a single mechanism, is not yet clear.
Although Co-IP coupled with MS is a powerful meth-odology for the unbiased detection of protein interac-tions, it is still a technique with false positives (due to off-target binding of antibodies) and false negatives (due to failure to capture protein-proteins interactions that are of transient nature, or due to other technical rea-sons). To reduce the impact of false positives, we utilized two antibodies and a CRISPR knockout control. Due to this stringent approach, it is more probable that we have missed some real protein interactors rather than identi-fied false positives. Interestingly, we did not detect
inter-actions between MTHFD2 and other one-carbon
metabolism enzymes involved in nuclear dTMP
synthe-sis (SHMT1, SHMT2, MTHFD1, TYMS or DHFR) [51],
nor with nuclear lamin to which they are tethered [31]. Such interactions could of course have been missed in our experiments, since we used quite stringent criteria -10
-5
-4 -2 0 2 4
5
0 10 0.2
0
-0.2
-0.4
-0.6
-0.8
-0.6 -0.4 -0.2 0 0.2 0.4
shRNA Gene Pearson R Rank
GART 0.29 38 FPGS 0.28 48 SHMT2 0.27 56
GCSH 0.33 4
CRISPR
shRNA
Gene Pearson R Rank
GART FPGS SHMT2
GCSH 0.11 5004 0.01 14794 15822 0.01
-0.03 13686
MTHFD2
Correlation
MTHFD1 R = -0.11 ALDH1L2
R = -0.26 MTHFD2L
R = 0.05
SHMT1 R = 0.03 MTHFD1L
R = 0.57
SLC25A32 R = 0.78
SHMT2 R = 098
-1.0 100
75
50
25
0
-0.5 0 0.5 1.0
MTHFD2
SHMT
2
Pe
rc
e
n
ti
le
SHMT
2
R = 0.27
R = -0.03
CRISPR
AML cell lines
A
B
C
to obtain high-quality interactions and did not perform cross-linking during CoIP. Alternatively, MTHFD2 may reside in a different compartment. From a biochemical perspective, nuclear MTHFD2 would not be expected to contribute to dTMP synthesis, since this process re-quires CH2-THF which MTHFD2 cannot generate on its own, as it lacks the formyl-THF synthase domain present in MTHFD1.
An open question is what drives the recruitment and association of MTHFD2 with cellular RNA-processing protein complexes. Because several of the D2PPI pro-teins are RNA-binding, one possibility is that MTHFD2 itself is an RNA-binding protein and encounters its part-ners while bound to specific RNAs. Indeed, a recent large-case study reported that RNA binding proteins tend to CoIP with a large number of other RNA binding proteins [52]. Additionally, MTHFD2 contains Rossman folds, NAD-binding domains that can also bind RNA, as in the example of GAPDH [53]. A number of enzymes have been shown to “moonlight” by binding RNA, in-cluding SHMT2 and MTHFD1 [54], and it has been sug-gested that this may allow metabolic status to influence gene regulation [55]. However, it is also possible that MTHFD2 is not a direct RNA-binding protein, but in-stead contacts one or more proteins around which the RNA-binding complex is organized. Further work is re-quired to demonstrate whether MTHFD2 binds RNA species directly or indirectly, and understand how the observed protein-protein interactions are formed and function. Further experiments will also be important for validating and extending the findings of this study, such as Co-IP and transcriptomic studies of enzymatically in-active MTHFD2 in diverse nutritional and cell condi-tions. For example it will be of interest to determine whether the interaction partners of MTHFD2 are modi-fied in response to availability of one-carbon units, growth factors or DNA damage.
Conclusions
Our study suggests a role for nuclear MTHFD2 in RNA metabolism and translation, besides its established func-tion in mitochondrial folate metabolism. An intriguing possibility is that the MTHFD2-interacting proteins could provide a mechanism whereby MTHFD2 can affect gene expression and cell behaviour, perhaps serving to integrate information on folate metabolism. While the precise mechanism remains to be investigated, such a function would explain the observation that catalytically inactive MTHFD2 protein is sufficient to promote cell prolifera-tion [17]. Future investigation of this non-enzymatic func-tion will be important for pharmaceutically targeting MTHFD2; for example, inhibitors of MTHFD2 dehydro-genase activity may not be effective, and instead drugs that disrupt protein-protein interactions might be required.
Additional files
Additional file 1:Table S1.List of primers used for qRT-PCR in this study. (DOCX 12 kb)
Additional file 2:Figure S1.Validation of MTHFD2 knockout cell model. (a) Immunoblot of MTHFD2 in WT and D2-KO clones. Tubulin is shown as loading control. (b) Immunoprecipitation of MTHFD2 using Anti-MTHFD2 antibody from D2-KO and WT cells followed by immunoblotting for MTHFD2. (c) Silver-stained SDS-PAGE of CoIP lysates from WT and D2-KO cells. As indicated the CoIP were performed using either of the anti-MTHFD2 NC or AP antibodies. anti-MTHFD2 bands are indicated by blue squares. As can be seen MTHFD2 were detected in IP samples from WT but not D2-KO cells. (PDF 311 kb)
Additional file 3:Mapped peptides detected by Mass Spectrometry in each of 12 CoIP lysate samples. (XLSX 748 kb)
Additional file 4:Significantly enriched GO Molecular Function and Cellular Component gene sets for 29 identified MTHFD2 protein interactors. (XLSX 15 kb)
Additional file 5:Co-expression scores between MTHFD2 and the D2PPI genes. The gene co-expression were calculated across 8097 human, rat, and mouse datasets using in-house tools, or against ~ 3000 human datasets using SEEK. (XLSX 11 kb)
Additional file 6:List of top data sets exhibiting coexpression between MTHFD2 and the D2PPI and ATF4 gene sets, respectively. (XLSX 17 kb)
Additional file 7:Correlation scores of MTHFD2 against all other genes in Achilles Project. (XLSX 1006 kb)
Abbreviations
AP:Proteintech 12,270–1-AP anti-MTHFD2 antibody; CoIP: Co-immunoprecipitation; D2-KO: MTHFD2 CRISPR knockout cell line; D2PPI: Set of D2 protein-protein interactors, listed in Table1.; HNRNP: Heterogeneous ribonucleoprotein; HSP: Heat-shock proteins; IgG: Immunoglubulin G; MS: Mass spectrometry; MTHFD2: Methylenetetrahydrofolate dehydrogenase (NADP+ dependent) 2; NC: Genetex N1C3 anti-MTHFD2 antibody; PPI: Protein-protein interaction
Acknowledgements
We would like to thank Dr. Rabinowitz for providing us with the MTHFD2 CRISPR knockout cells. In-gel digestion, peptide extraction, MS analysis, and database searches of protein identification were performed by the Proteomics Karolinska (PK/KI) core facility at Karolinska Institute, Stockholm.
Funding
The project was funded by Cancerfonden (CAN 2016/632) and the Swedish Foundation for Strategic Research (FFL12-0220).
Availability of data and materials
The CMap data can be accessed from the project’s online tool (https://clue.io/cmap). Achilles Project data are available from the Broad Institute portal (https://
portals.broadinstitute.org/achilles). Protein half-life data are available from
original publications [22,56]. Co-expression with MTHFD2 calculated by SEEK are available online (http://seek.princeton.edu).
Authors’contributions
RN and CK conceived the study, designed the experiments, wrote the manuscript, and approved for the publication of the final manuscript. CK performed the experiments. CK and RN performed the computational analysis presented here.
Ethics approval and consent to participate
Not applicable.
Consent for publication
Not applicable.
Competing interests
Publisher’s Note
Springer Nature remains neutral with regard to jurisdictional claims in published maps and institutional affiliations.
Author details
1Cardiovascular Medicine Unit, Department of Medicine, Karolinska Institutet, SE-171 76 Stockholm, Sweden.2Division of Cardiovascular Medicine, Karolinska University Hospital, SE-171 76 Stockholm, Sweden.3Center for Molecular Medicine, Karolinska Institutet, SE-171 76 Stockholm, Sweden.
Received: 29 May 2018 Accepted: 8 August 2018
References
1. Pavlova NN, Thompson CB. The emerging hallmarks of cancer metabolism. Cell Metab. 2016;23:27–47.
2. Jain M, Nilsson R, Sharma S, Madhusudhan N, Kitami T, Souza AL, et al. Metabolite profiling identifies a key role for glycine in rapid cancer cell proliferation. Science. 2012;336:1040–4.
3. Locasale JW. Serine, glycine and one-carbon units: cancer metabolism in full circle. Nat Rev Cancer. 2013;13:572–83.
4. Nilsson R, Jain M, Madhusudhan N, Sheppard NG, Strittmatter L, Kampf C, et al. Metabolic enzyme expression highlights a key role for MTHFD2 and the mitochondrial folate pathway in cancer. Nat Commun. 2014;5:3128. 5. Pike ST, Rajendra R, Artzt K, Appling DR. Mitochondrial C1-tetrahydrofolate
synthase (MTHFD1L) supports the flow of mitochondrial one-carbon units into the methyl cycle in embryos. J Biol Chem. 2010;285:4612–20. 6. Lewis CA, Parker SJ, Fiske BP, McCloskey D, Gui DY, Green CR, et al. Tracing
compartmentalized NADPH metabolism in the cytosol and mitochondria of mammalian cells. Mol Cell. 2014;55:253–63. Elsevier Inc
7. Ducker GSSS, Chen L, Morscher RJJJ, Ghergurovich JMMM, Esposito M, Teng X, et al. Reversal of cytosolic one-carbon flux compensates for loss of the mitochondrial folate pathway. Cell Metab. Elsevier Inc. 2016;23:1140–53. 8. Mejia NR, MacKenzie RE. NAD-dependent methylenetetrahydrofolate
dehydrogenase is expressed by immortal cells. J Biol Chem. 1985;260: 14616–20.
9. Tedeschi PM, Vazquez A, Kerrigan JE, Bertino JR. Mitochondrial methylenetetrahydrofolate dehydrogenase (MTHFD2) overexpression is associated with tumor cell proliferation and is a novel target for drug development. Mol Cancer Res. 2015;13:1361–6.
10. Pikman Y, Puissant A, Alexe G, Furman A, Chen LM, Frumm SM, et al. Targeting MTHFD2 in acute myeloid leukemia. J Exp Med. 2016;213:1285–306. 11. Di Pietro E, Sirois J, Tremblay ML, MacKenzie RE. Mitochondrial NAD-dependent
methylenetetrahydrofolate dehydrogenase-methenyltetrahydrofolate cyclohydrolase is essential for embryonic development. Mol Cell Biol. 2002;22:4158–66.
12. Bolusani S, Young BA, Cole NA, Tibbetts AS, Momb J, Bryant JD, et al. Mammalian MTHFD2L encodes a mitochondrial methylenetetrahydrofolate dehydrogenase isozyme expressed in adult tissues. J Biol Chem. 2011; 286:5166–74.
13. Liu F, Liu Y, He C, Tao L, He X, Song H, et al. Increased MTHFD2 expression is associated with poor prognosis in breast cancer. Tumor Biol. 2014;35:8685–90. 14. Liu X, Huang Y, Jiang C, Ou H, Guo B, Liao H, et al.
Methylenetetrahydrofolate dehydrogenase 2 overexpression is associated with tumor aggressiveness and poor prognosis in hepatocellular carcinoma. Dig Liver Dis. 2016;48:953–60.
15. Koufaris C, Gallage S, Yang T, Lau C-H, Valbuena GN, Keun HC. Suppression of MTHFD2 in MCF-7 breast cancer cells increases glycolysis, dependency on exogenous glycine, and sensitivity to folate depletion. J Proteome Res. 2016;15:2618–25.
16. Kim D, Fiske BP, Birsoy K, Freinkman E, Kami K, Possemato RL, et al. SHMT2 drives glioma cell survival in ischaemia but imposes a dependence on glycine clearance. Nature. 2015;520:363–7.
17. Gustafsson Sheppard N, Jarl L, Mahadessian D, Strittmatter L, Schmidt A, Madhusudan N, et al. The folate-coupled enzyme MTHFD2 is a nuclear protein and promotes cell proliferation. Sci Rep. 2015;5:15029. 18. Lehtinen L, Ketola K, Mäkelä R, Mpindi J-P, Viitala M, Kallioniemi O, et al.
High-throughput RNAi screening for novel modulators of vimentin expression identifies MTHFD2 as a regulator of breast cancer cell migration and invasion. Oncotarget. 2013;4:48–63.
19. Schmidt A, Wu H, MacKenzie RE, Chen VJ, Bewly JR, Ray JE, et al. Structures of three inhibitor complexes provide insight into the reaction mechanism of the human methylenetetrahydrofolate dehydrogenase/cyclohydrolase. Biochemistry. 2000;39:6325–35.
20. Fu C, Sikandar A, Donner J, Zaburannyi N, Herrmann J, Reck M, et al. The natural product carolacton inhibits folate-dependent C1 metabolism by targeting FolD/MTHFD. Nat Commun. 2017;8:1529.
21. Szklarczyk D, Morris JH, Cook H, Kuhn M, Wyder S, Simonovic M, et al. The STRING database in 2017: quality-controlled protein–protein association networks, made broadly accessible. Nucleic Acids Res. 2017;45:D362–8. 22. Schwanhäusser B, Busse D, Li N, Dittmar G, Schuchhardt J, Wolf J, et al. Global
quantification of mammalian gene expression control. Nature. 2011;473:337–42. 23. Cambridge SB, Gnad F, Nguyen C, Bermejo JL, Krüger M, Mann M. Systems-wide proteomic analysis in mammalian cells reveals conserved, functional protein turnover. J Proteome Res. 2011;10:5275–84.
24. Thiele I, Swainston N, Fleming RMT, Hoppe A, Sahoo S, Aurich MK, et al. A community-driven global reconstruction of human metabolism. Nat Biotechnol. 2013;31:419–25.
25. Subramanianan A, Tamayo P, Mootha VK, Mukherjeed S, Ebert BL, Gillette MA, et al. Gene set enrichment analysis: a knowledge-based approach for interpreting genome-wide expression profiles. Proc Natl Acad Sci U S A. 2005;102:15545–50.
26. Zhu Q, Wong AK, Krishnan A, Aure MR, Tadych A, Zhang R, et al. Targeted exploration and analysis of large cross-platform human transcriptomic compendia. Nat Methods. 2015;12:211–4.
27. Metsalu T, Vilo J. ClustVis: a web tool for visualizing clustering of multivariate data using principal component analysis and heatmap. Nucleic Acids Res. 2015;43:W566–70.
28. Meyers RM, Bryan JG, McFarland JM, Weir BA, Sizemore AE, Xu H, et al. Computational correction of copy number effect improves specificity of CRISPR–Cas9 essentiality screens in cancer cells. Nat Genet. 2017;49: 1779–84.
29. Tsherniak A, Vazquez F, Montgomery PG, Weir BA, Kryukov G, Cowley GS, et al. Defining a cancer dependency map. Cell. 2017;170:564–576.e16. 30. Wang T, Yu H, Hughes NW, Liu B, Kendirli A, Klein K, et al. Gene Essentiality
Profiling Reveals Gene Networks and Synthetic Lethal Interactions with Oncogenic Ras. Cell. 2017;168:890–903.e15.
31. Anderson DD, Woeller CF, Chiang E-P, Shane B, Stover PJ. Serine Hydroxymethyltransferase anchors de novo thymidylate synthesis pathway to nuclear Lamina for DNA synthesis. J Biol Chem. 2012;287: 7051–62.
32. Baughman JM, Nilsson R, Gohil VM, Arlow DH, Gauhar Z, Mootha VK. A computational screen for regulators of oxidative phosphorylation implicates SLIRP in mitochondrial RNA homeostasis. PLoS Genet. 2009;5:e1000590. 33. Nilsson R, Schultz IJ, Pierce EL, Soltis KA, Naranuntarat A, Ward DM, et al.
Discovery of genes essential for heme biosynthesis through large-scale gene expression analysis. Cell Metab. 2009;10:119–30.
34. Subramanian A, Narayan R, Corsello SM, Peck DD, Natoli TE, Lu X, et al. A Next Generation Connectivity Map: L1000 Platform and the First 1,000,000 Profiles. Cell. 2017;171:1437–1452.e17.
35. Minton DR, Nam M, McLaughlin DJ, Shin J, Bayraktar EC, Alvarez SW, et al. Serine Catabolism by SHMT2 Is Required for Proper Mitochondrial Translation Initiation and Maintenance of Formylmethionyl-tRNAs. Mol Cell. 2018;69:610–621.e5.
36. Christofk HR, Vander Heiden MG, Harris MH, Ramanathan A, Gerszten RE, Wei R, et al. The M2 splice isoform of pyruvate kinase is important for cancer metabolism and tumour growth. Nature. 2008;452:230–3. 37. Son J, Lyssiotis CA, Ying H, Wang X, Hua S, Ligorio M, et al. Glutamine
supports pancreatic cancer growth through a KRAS-regulated metabolic pathway. Nature. 2013;496:101–5.
38. Dang L, White DW, Gross S, Bennett BD, Bittinger MA, Driggers EM, et al. Cancer-associated IDH1 mutations produce 2-hydroxyglutarate. Nature. Nature Publishing Group. 2009;462:739–44.
39. Yang W, Lu Z. Pyruvate kinase M2 at a glance. J Cell Sci. 2015;128:1655–60. 40. Yu X, Li S. Non-metabolic functions of glycolytic enzymes in tumorigenesis.
Oncogene. 2017;36:2629–36.
41. Geuens T, Bouhy D, Timmerman V. The hnRNP family: insights into their role in health and disease. Hum Genet. 2016;135:851–67.
43. Zhang Z, Zhou C, Chang Y, Zhang Z, Hu Y, Zhang F, et al. Long non-coding RNA CASC11 interacts with hnRNP-K and activates the WNT/ß-catenin pathway to promote growth and metastasis in colorectal cancer. Cancer Lett. 2016;376:62–73.
44. Lai C-H, Huang Y-C, Lee J-C, Tseng JT-C, Chang K-C, Chen Y-J, et al. Translational upregulation of aurora-a by hnRNP Q1 contributes to cell proliferation and tumorigenesis in colorectal cancer. Cell Death Dis. 2017;8:e2555.
45. Ji Y, Tulin AV. Poly (ADP-ribose) controls DE-cadherin-dependent stem cell maintenance and oocyte localization. Nat Commun. 2012;3:760. 46. Lee P-T, Liao P-C, Chang W-C, Tseng JT. Epidermal growth factor increases
the interaction between nucleolin and heterogeneous nuclear ribonucleoprotein K/poly (C) binding protein 1 complex to regulate the gastrin mRNA turnover. Mol Biol Cell. 2007;18:5004–13.
47. Leal G, Comprido D, de Luca P, Morais E, Rodrigues L, Mele M, et al. The RNA-Binding Protein hnRNP K Mediates the Effect of BDNF on Dendritic mRNA Metabolism and Regulates Synaptic NMDA Receptors in Hippocampal Neurons. eNeuro. 2017;4:ENEURO.0268-17.2017. 48. Tang Y-S, Khan RA, Xiao S, Hansen DK, Stabler SP, Kusumanchi P, et al.
Evidence favoring a positive feedback loop for physiologic auto upregulation of hnRNP-E1 during prolonged folate deficiency in human placental cells. J Nutr. 2017;147:482–98.
49. Calderwood SK, Gong J. Heat shock proteins promote cancer: It’s a protection racket. Trends Biochem Sci. 2016;41:311–23.
50. Weighardt F, Cobianchi F, Cartegni L, Chiodi I, Villa A, Riva S, et al. A novel hnRNP protein (HAP/SAF-B) enters a subset of hnRNP complexes and relocates in nuclear granules in response to heat shock. J Cell Sci. 1999; 112(Pt 10):1465–76.
51. Field MS, Kamynina E, Agunloye OC, Liebenthal RP, Lamarre SG, Brosnan ME, et al. Nuclear enrichment of folate cofactors and methylenetetrahydrofolate dehydrogenase 1 (MTHFD1) protect de novo thymidylate biosynthesis during folate deficiency. J Biol Chem. 2014;289:29642–50.
52. Brannan KW, Jin W, Huelga SC, Banks CAS, Gilmore JM, Florens L, et al. SONAR discovers RNA-binding proteins from analysis of large-scale protein-protein Interactomes. Mol Cell. 2016;64:282–93.
53. Nagy E, Rigby WF. Glyceraldehyde-3-phosphate dehydrogenase selectively binds AU-rich RNA in the NAD(+)-binding region (Rossmann fold). J Biol Chem. 1995;270:2755–63.
54. Castello A, Fischer B, Eichelbaum K, Horos R, Beckmann BM, Strein C, et al. Insights into RNA biology from an atlas of mammalian mRNA-binding proteins. Cell. 2012;149:1393–406.
55. Hentze MW, Preiss T. The REM phase of gene regulation. Trends Biochem Sci. 2010;35:423–6.