ISSN: 2231-5373
http://www.ijmttjournal.org
Page 195
Mathematical Technique Based Speaker Recognition
for Total Security System
S. K. Patel#1, Dr. J. M Dhodiya*2, Dr. D. C. Joshi#3
#1
Assistant Professor, Humanities and Social Science department,Shree Swami Atmanand Saraswati Institute of Technology, Surat, India.
*2 Assistant Professor ,Department Of Applied Mathematics & Humanities, Sardar Vallabhbhai National Institute of Technology, Surat, India.
#3
Associate Professor, Department of Mathematics, Veer Narmad South Gujarat University, Surat, India.
Abstract—Today security system is rapidly growing and updating simultaneously due to advance of technology. This growth in electronic transactions results in a rise of demand for fast and accurate user identification and authentication system. Tota l security system solve this problem as a number of parameters like face, speech, fingerprint, palm print etc. are undeniably connected to its owner which verifies quantitative data like E-cards, password and Login ID etc. of human being. This paper discusses Mel frequency Cepstral Coefficient (MFCC) to extract the features from voice and Vector quantization technique to identify the speaker for the speaker’s recognition in MATLAB for TSS.
Keywords— Speaker Recognition, TSS, VQ, MFCC, Biometrics.
I. 1INTRODUCTION
The present era of global security threats found the atmosphere with full of risks, both externally and internally. So every organization, commercial, military, government, and individual person etc. want to advance their security system. Security system is a computational device that verifies characteristics of human data and when someone tries to break it, then the system activates an alert. Many biometrics recognition systems are available in the world which verifies only fingerprint or voice or face or iris or palmprint of humans but each biometrics system has its limitation [11] which creates problems for its user’s authentication. This problem can be solved by Total security system (TSS). Since it is verify quantitative data like password and Login ID, E-card information and qualitative data like face, speaker, fingerprint, palmprint, iris etc. according to user requirement. In this paper we explore TSS with speaker recognition.
A speaker recognition system was developed in 1960 with the discovery of voiceprint analysis, where characteristics of an individual’s voice were thought to be able to characterize the uniqueness of an individual as much like a fingerprint. General overviews of speaker recognition have been given by Atal, Doddington, Furui, O’Shaughnessy, Rosenberg, Soong, Sutherland, and Jack [4, 9, 15, 6, 2, 8, 3]. In 1999, Ericsson developed a voice recognition system for their T-series mobile phones. In november 2010, Nuance communications obtained PerSay corp. to develop a new method based on biometric features. Speaker recognition is basically divided into speaker verification and identification, which is the automatic process to determine person as well as person’s speech signal from the database. Speaker recognition system can be divided into two methods, text- dependent and text independent methods [7]. In text dependent method the speaker has to say the key words or sentences (pin-code, password etc.), having the same text for both training and recognition trials. In the text independent method device should catch the characteristics of the speech irrespective of the text spoken.
ISSN: 2231-5373
http://www.ijmttjournal.org
Page 196
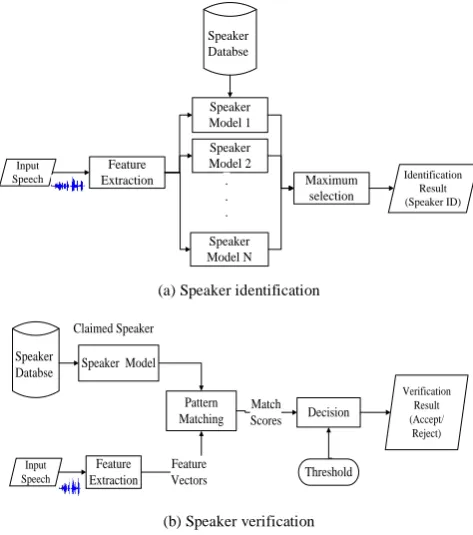
Input Speech Feature Extraction Speaker Model 1 Maximum selection Speaker Model 2 Speaker Model N . . . Identification Result (Speaker ID) Speaker Databse(a) Speaker identification
Input Speech Feature Extraction Claimed Speaker Decision Pattern Matching Feature Vectors Match Scores Verification Result (Accept/ Reject) Speaker
Databse Speaker Model
Threshold
(b) Speaker verification
Fig. 1: Basic structures of speaker recognition systems
II. SPEECH FEATURE EXTRACTIONS
In speaker recognition, Feature extraction is the first step which is the process to identify the components of the audio signal that are good for identifying the linguistic content and discarding all the other stuff which carries information like background noise, emotion etc. Using Digital Signal Processing (DSP) tools convert the speech waveform to a set of features for further analysis which is referred as the signal-processing front end. There are many techniques like Auditory Spectrum-Based Speech Feature (ASSF), Linear Prediction Coding (LPC), Mel- Frequency Cepstrum Coefficients (MFCC) etc. used to parametrically represent a voice signal for speaker recognition. MFCC are a feature widely used in speaker recognition. It was introduced by Davis and Mermelstein in the 1980 [14]. MFCC technique extract features from the speech signal and compare the unknown speaker with the exist speaker database.
A. Mel Frequency Cepstrum Coefficients (MFCC) steps
The MFCC process is subdivided into five phases or blocks which are shown in Fig. 2. The input speech is recorded at a sampling rate above 10000 Hz. The computation of MFCC is explained as follow:
Frame Blocking Continuous
speech frame Windowing FFT
Mel-frequency Wrapping spectrum Cepstrum Mel spectrum Mel cepstrum
Fig. 2: Block diagram of the MFCC processor
1) Step 1: Frame Blocking
In frame blocking section, the speech waveform is more or less divided into frames of approximately 30 milliseconds. In this step the continuous speech signal is divided into frames where each frame consists of N samples and successive frames are overlapping with each other by M samples [10]. Using sampling frequency is 14000 Hz, and in this paper. This means the frame length is 0.03*14000 = 420 samples. The first 420 sample frame starts at sample 0, the next 420 sample frame starts at sample 140 etc. until the end of the speech file is reached. If the speech file does not divide into an even number of frames, pad it with zeros so that it does.
2) Step 2: Windowing
After frame blocking, the windowing block minimizes the discontinuities of the signal by tapering the beginning and end of each frame to zero. The window ( ) is defined as
( ) ( ) ( )
ISSN: 2231-5373
http://www.ijmttjournal.org
Page 197
( ) { (
)
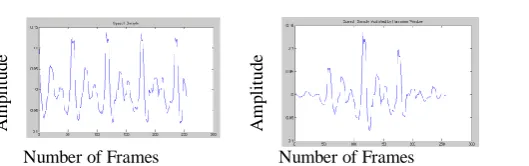
A speech sample in Fig. 3(a) is shown in Fig.3(b) after multiplying by Hamming window.
A
m
p
li
tud
e
A
m
p
li
tud
e
Number of Frames Number of Frames
Fig. 3: Speech sample a) without Hamming Window b) with Hamming Window.
3) Step 3: Fast Fourier Transform (FFT)
The FFT block converts each frame of N samples from the time domain to the frequency domain. The FFT is a fast algorithm
to implement the Discrete Fourier Transform (DFT), which is defined on the set of N samples , as
∑ ( )
Here √ is the imaginary unit, are complex numbers. To compute absolute values (frequency magnitudes) of
complex number for each frequency component is taken by using:
( ) [ ( )] [ ( )]
We obtain resulting sequence is interpreted as follows: positive frequencies correspond to values
and negative frequencies – correspond to . denotes the sampling frequency.
After applying “windowing” and “FFT” steps transform the signal into the frequency domain which is called the spectrum of the original signal.
4) Step 4: Mel Filter Bank
In this block, the signal is plotted against the Mel spectrum to mimic human hearing. Each pitch of a pure tone with an actual measured frequency f measured in Hz, a subjective pitch is measured on a scale called the ‘Mel Scale’. Mel Filter Bank filters an input power spectrum through a bank of number of Mel-filters. The output is an array of filtered values, typically called Mel spectrum, each corresponding to the result of filtering the input spectrum through an individual filter which is achieved by
( ) ∑ ( ) [ ][ ]
Where k is is number of filters. The mel-frequency scale is a linear frequency spacing below 1000 Hz and a logarithmic
spacing above 1000 Hz. To compute the mels for a given frequency f in Hz as following approximate formula:
( ) ( ).
The number of mel spectrum coefficients is typically chosen as 20. That filter bank has a triangular band pass frequency response, and the spacing as well as the bandwidth is determined by a constant mel frequency interval.
5) Step 5: Log Compression
Using the Mel filter bank generate range of the values is reduced by replacing each value by its natural logarithm as
( ) ( )
6) Step 6: Cepstrum
In this final step, we convert the log mel spectrum back to time domain using the Discrete Cosine Transform (DCT) is called the MFCC which is calculated as
̃ ∑ ( ) [ ( ) ]
Here ̃ is calculated from the DCT since it represents the mean value of the input signal, which carried little speaker specific
information.
ISSN: 2231-5373
http://www.ijmttjournal.org
Page 198
III.FEATURE MATCHING
There are many techniques like Dynamic Time Warping (DTW), Hidden Markov Modeling (HMM), Gaussian mixture model (GMM) and Vector Quantization (VQ) for feature matching in speaker recognition. Using VQ achieves high accuracy and essential number of highly representative code vectors for each speaker. VQ is a process of mapping vectors from a large vector space to a finite number of regions in that space. Each region is called a cluster which is represented by its center is called a codeword (code vector). The collection of all codewords is called a codebook [16]. A codebook (acoustic model) for each speaker is constructed in the same way.
A vector quantizer maps k dimensionalvectors in the vector space into a finite set of vectors .
Each vector iscalled a code vector (codeword)and the set of all the codewords is called a codebook. Associated with each
codeword, is a nearest neighbour region called voronoi region, and it is defined as
{ ‖ ‖ ‖ ‖ }
Here should consist of all vectors that are closer to than any of the other code vectors. The representative codeword is determined to be the closest in Euclidean distance from the input vector. The Euclidean distance is defined by
( ) √∑ ( )
where and are the component of the input vector and codeword respectively. The key to VQ is the good codebook.
VQ is implementing through Binary Splitting LBG algorithm ([13], [18]).
B. Codebook generation algorithms: LBG(Linde-Buzo-Gray) Algorithm
LBG algorithm steps are as follows [12, 18]:
Step 1: Design a 1-vector codebook; i.e. the centroid of the entire set of training vectors (here iteration is not required).
Step 2: Double the size of the codebook by splitting each current codebook according to the rule
( )
( )
where n varies from 1 to the current size of the codebook, and ε is a splitting parameter (we choose ). Step 3: Nearest-Neighbour Search:
For each training vector, find the codeword in the current codebook that is closest (in terms of similarity measurement), and assign that vector to the corresponding cell (associated with the closest codeword).
Step 4: Centroid Update: Update the codeword in each cell using the centroid of the training vectors assigned to that cell. Step 5: Iteration 1: Repeat steps 3 and 4 until the average distance falls below a preset threshold.
Step 6: Iteration 2: Repeat steps 2, 3 and 4 until a codebook size of M is designed.
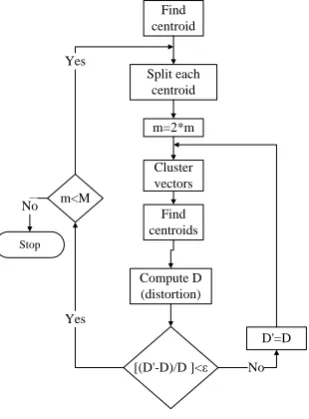
Intuitively, the LBG algorithm designs an M- vector codebook in stages. It starts first by designing a 1-vector codebook, then uses a splitting technique on the codewords to initialize the search for a 2-vector codebook, and continues the splitting process until the desired M-vector codebook is obtained.
A flow chart of the LBG algorithm is shown in Fig.4.
Find centroid
Split each centroid m=2*m
Cluster vectors Find centroids
Compute D (distortion)
D'=D [(D'-D)/D ]<ε
Yes
No m<M
Yes
No
Stop
Fig. 4: Flow diagram of the LBG algorithm
ISSN: 2231-5373
http://www.ijmttjournal.org
Page 199
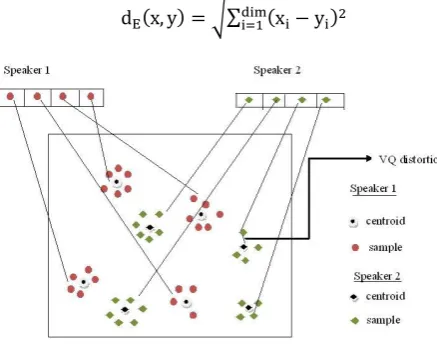
distance from a vector to the closest codeword of a codebook is called a VQ distortion. VQ distortion is the Euclidian distance between the two vectors which is obtained by
( ) √∑ ( )
Fig. 5: Conceptual diagram illustrating vector quantization codebook formation.
One speaker can be separated from another based of the location of centroids. Speaker database has a codebook for each speaker. In testing phase, an unknown voice after extracting voice feature vectors compared with the codebook of each speaker in the speaker database and compute distortion [17, 5]. Unknown voice will have minimum distortion with the true speaker. All these tasks are implemented in Matlab 7.6.
IV.DATABASE DESCRIPTION
For Speaker recognition, we recorded 20speakers voice i.e. S1.wav, S2.wav… S20. wav in the Train folder as well as in Test folder. The complete parameters that we used for speaker recognition are sampling frequency of 14000Hz, 8 bits per sample, the recorded time was 2 seconds, Hamming window with and for frame blocking process, 20 mel filter banks and a codebook size of 16.
V. EXPERIMENTAL RESULTS OF SPEAKER RECOGNITION
Arrange 20 speakers’ voice WAV file name as 1 s1, s2, s3, s4, s5, s6, s7, s8, s9, s10, s11, s12, s13, s14, s15, s16, s17, s18, s19, s20 in Training folder as well as Test folder. The performance evaluations of the speaker recognition using above method we obtain 0% error and 100% recognition rate with recognize 20 out of 20 speakers correctly as follows: Speaker 1 matches with speaker 1, Speaker 2 matches with speaker 2,…, Speaker 20 matches with speaker 20.
Next time we select speaker 2 for recognition from Test folder, we get recognize speaker 2 from Train folder with calculating minimum Euclidean distance between the codebooks of each speaker among train speaker as shown in Table 1 and Fig.6. Here Minimum Euclidean Distance of speaker 2 with train speakers is: 3.0741. The graphical users interface (GUI) and plot for speaker recognition has been implemented in MATLAB 7.6.0 (R2008a).
Speaker ID Distance Speaker ID Distance
Speaker 1 7.2445 Speaker 11 10.7834 Speaker 2 3.0741 Speaker 12 9.2241 Speaker 3 6.0825 Speaker 13 10.9145 Speaker 4 9.0405 Speaker 14 10.6763 Speaker 5 6.6289 Speaker 15 8.9737 Speaker 6 7.3146 Speaker 16 10.0919 Speaker 7 6.0292 Speaker 17 10.8013 Speaker 8 7.7026 Speaker 18 11.8506 Speaker 9 10.7958 Speaker 19 10.9785 Speaker 10 10.3603 Speaker 20 10.7951
ISSN: 2231-5373
http://www.ijmttjournal.org
Page 200
Fig. 6: Euclidean distance between the speaker 2 and Train folder.
VI.TOTAL SECURITY SYSTEM (TSS)
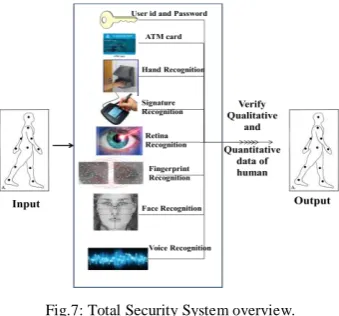
TSS creates new security services which will make our everyday lives more secured. Because it verifies both quantitative data which can be measured by device, like PIN numbers, login ID and password, keys etc. as well as qualitative data which can be observed but difficult to measure like images, videos, speech, finger print, face, iris and so on of a person for an authentication according to users’ requirement. We can see overview of TSS in Fig.7.
Fig.7: Total Security System overview.
At an initial stage, each person’s data like Login ID and Password, E- card information, face images, body images, voice,
palmprint, fingerprint and so on are stored in server database in TSS. Also set threshold value1for data set mentioned above for
identification in TSS. So, next time a person passing through the system, TSS calculates threshold value and recognizes person through stored data with input data one by one. If the match score is less then or equal to threshold value then it gives permission to access the TSS, otherwise gives alert messages. In this paper we discussed one of the qualitative data verification speaker recognition for TSS.
VII. CONCLUSION
Speaker recognition is an essential component of TSS. Its plays a vital role in security system, because it recognizes qualitative or quantitative or both data of humans. For speaker recognition, we have used MFCC and VQ respectively for same in TSS. The experimental results are analyzed with the help of MATLAB 7.6, which gives efficient results. Speaker recognition is widely applicable in the use of speaker’s voice to verify their identity and control access to services like banking by telephone, database access services, voice dialling telephone shopping, information services, voice mail and security control.
VIII. REFERENCES
[1] A. Douglas, “experimental evaluation of features for robust speaker identification”, IEEE, OCT1994.
[2] A. Rosenberg, “Automatic Speaker Verification: A Review”, Proceedings of the IEEE, Vol. 64, No. 4, pp. 475-487, 1976.
[3] A. Sutherland and M. Jack, “Speaker Verification”, In Aspects of Speech Technology, editors M. Jack and J. Laver, Edinburgh: Edinburgh University Press, pp. 185-215, 1988.
[4] B. S. Atal, “Automatic Recognition of Speakers from Their Voices”, Proceedings of the IEEE Vol. 64, pp. 460-475, 1976.
[5] B. Wildermoth, “Text-Independent Speaker Recognition using Source Based Features”, M. Phil thesis, Griffith University Australia, Jan 2001. [6] D. O’Shaughnessy, “Speech Communication, Human and Machine. Digital Signal Processing”, Wesley, 1987.
[7] D. A. Reynolds, R.C.rose, “Robust text-independent speaker identification using Gaussian mixture speaker model”, IEEE, 1995.
1Threshold Value: A User sets value according to requirement for qualitative data identification to decide if the input person data are rejecte d or accepted in TSS. The acceptance or rejection of person data is dependent on the match score falling above or below the threshold value.
0 2 4 6 8 10 12 14 16 18 20
3 4 5 6 7 8 9 10 11 12
Speaker ID
E
u
c
lid
e
a
n
D
is
ta
n
c
e
Speaker Recognition
ISSN: 2231-5373
http://www.ijmttjournal.org
Page 201
[8] E. Rosenberg and F. K. Soong, “Recent Research in Automatic Speaker Recognition,in Advances in Speech Signal Processing”, pp. 701-738. New York: Marcel Dekker, 1992.
[9] G. R. Doddington, “Speaker Recognition—Identifying People by their Voices,” Proceedings of the IEEE, Vol. 73, No. 11, pp. 1651-1664, 1985. [10] H. Jayanna,. and S. Prasanna, “Analysis, feature extraction, modeling and testing techniques for speaker recognition”, IETE Technical, 2009. [11] http://www.cse.wustl.edu/~jain/cse571-11/ftp/biomet/index.html#Arc09
[12] L Rabiner, Biing-Hwang Juang and B.Yegnanarayana, “Fundamental of Speech Recognition”, Prentice-Hall, Englewood Cliffs, 2009. [13] R. M. Gray, “‘Vector quantization”, IEEE ASSP Marg., pp. 4-29, Apr. 1984.
[14] S. Davis, P. Mermelstein, “Comparison of Parametric Representations for Monosyllabic Word Recognition in Continuously Spoken Sentences” in IEEE Transactions on Acoustics, Speech, and Signal Processing, 1980, Vol. 28 No. 4, pp. 357-366.
[15] S. Furui, “Speaker-Dependent-Feature Extraction, Recognition and Processing Techniques.” Speech Communication,Vol. 10, pp. 505-520, 1991. [16] T. Kinnunen and I. Karkkainen, "Class-Discriminative Weighted Distortion Measure for VQ-Based Speaker Identification" Joint IAPR Int. Workshop on
Statistical Pattern Recognition (SPR'2002), Windsor, Canada, 681- 688, August 2002.
[17] T. Matsui, S. Funii, “Comparison of Text-dependent Speaker Recognition Methods using VQ-Distortion and Discrete/Continuous HMMs”, IEEE ICASSP’92, 1992, v01.2, pp.157 -160.