MURDOCH RESEARCH REPOSITORY
http://dx.doi.org/10.1109/ICDSP.2002.1027915
Kwok, S.M., Chandrasekhar, R. and Attikiouzel, Y. (2002)
Adaptation of the Daugman-Downing texture demodulation to
highlight circumscribed mass lesions on mammograms. In: 14th
International Conference on Digital Signal Processing (DSP
2002), 1 - 3 July, Santorini, Greece, pp 449 - 452 vol.1.
http://researchrepository.murdoch.edu.au/17995/
Copyright © 2002 IEEE
Personal use of this material is permitted. However, permission to reprint/republish
this material for advertising or promotional purposes or for creating new collective
ADAPTATION
OF
THE DAUGMAN-DOWNING TEXTURE DEMODULATION TO
HIGHL~GHT
CIRCUMSCRIBED MASS LESIONS
ON
MAMMOGRAMS
S
M kicsok, R
Chandrasekhar and
Y
Attikiouzel
Australian Research Centre for Medical Engineering
The University of Western Australia
35
Stirling Highway, Crawley, WA
6009,
Australia
[email protected]
Abstract: Daugman and Downing introduced a new method in 1993 for decomposing textures using a demodulation transform that they claimed had its basis in human visual perception. We argue that their transfomi may be applied to mammograms for image texture analysis and tissue characterization. In this paper, an adaptation made to their demodu- lation transform is presented for the purpose of highlighting circumscribed mass lesions on mammograms. Three major modifications are introduced: (a) Fourier half-plane selection, (b) amplitude-only and phase-only reconstruction, and (c) image subtraction to highlight masses -~ on mammograms. This adapted algorithm exhibited high sensitivity for detecting circumscribed mass lesions and initial results are promising
1. INTRODUCT JON
In 1993, Daugman and Downing [ I ] introduced a new texture operator based on decomposition of an image by demodulation into a carrier and a phasor, the latter be- ing capable of further decomposition into amplitude and phase components. In a later, more complete presenta- tion, they claimed that ". . . some aspects of human spa- tial vision, particularly for textured patterns and scenes, can be described in tenns of demodulation and predictive coding" [2].
In previous work, we have used a range-based neigh- bourhood texture measure [ 31 for characterizing the widely varied appearance of breast tissue or parenchyma,
and abnormalities, or ksions, on mammograms, which are X-ray images of the compressed female breast. The novel approach of Daugman and Downing, for texture characterization, appeared promising for this purpose, as well. The hypothesis was that if the Daugman-Downing decomposition could be used to characterize the mam- mographic parenchyma successfully, then it could, by a subtractive process, be used to highlight lesioris or abnor- malities in the breast.
This approach has now been tested on a subset of le- sions called circurnscrihed inass lesions, which are typ- ified on mammograms by bright elliptical regions with well defined borders. Initial results are very encourag- ing, although further work needs to be done to improve discrimination between normal and lesion tissue.
and
2. KEVLEW OF THE DAUGMAN-DOWNING
TEXTURE DEMODULATION
where so is the mean value of S ( x , y ) and S ( x , y ) has zero- mean and is taken to be the original image henceforth. The texture demodulation method depends on factorizing
S ( x , y ) , in terms of a singlepredictive currier wuve e(,r,.v)
and a conipfex modukatioti phusor Z(x,y) such that their modulation product reproduces the original image, i.e.,
Dauginan and Downing then expressed S(.x,y) by the 2D-Fourier expansion using paired coivtigate. frequencies
so:
Y
S(.V) =
c
akexP[jOlkx+VhY)I (3)X = ~ ~ . N
where there are 2iV paired conjugate 2D frequency com- ponents (pk,vk) = (-p...k, -v-h) and their associated com- plex coefficients are ak = u k + jhk with c10 = 0. More- over, because S ( x , y ) is real rather than complex, the co- efficients are conjugate symmetric, i.e., a k =
aTk.
The polar form of ak is / / a k / j exp(jek).Since the Fourier spectrum is conjugate symmetric, the Fourier half-plane may be defined in any orientation such that all values of k sharing the same sign (+/-) are in the same half-plane. Over the half-plane of all pos- itive frequency components, the spectral centre of mass
(,uc,vc) is determined by:
The review in this section summarizes the exposition of Daugman and Downing [ 1,2]. Any arbitrary real-valued image S(x,y) may be expressed as
S ( x : y ) = S ( x , y ) + s o (1)
(4)
( 5 )
The predictive carrier wave C ( x , y ) is then selected at the centre-of-mass frequency (,U< ,vL):
C ( x , y ) = exp l i O ~ ~ , r + v ~ . ~ ) ] (6)
by dernodulating the original signal S(x,y) by the carrier C ( X > J ) . Thus all the positive frequency components in the half-plane are shifted to have their centre of mass at the origin.
N
k= 1
Z(X,Y) = clkexp l i ( 4 k x
+
Av~Y)] (7)where .4pg = pk - ji, and Avg = vk - v, .
without loss using Z ( x , y ) and C(x,,v) so:
The original image S(x,y) can then be reconstructed
S(x,y) = Z(x,jj)C(x,-v) +Z'(x;y)C*(x,y) (8)
Alternatively,
Note that the mean so must be added back to S(x,y) to obtain the initial image S(x.y).
Furthermore, the complex modulation phasor can be expressed in complex polar form to obtain as a product of amplitude modulation (AM) and phase modulation (PM) Components, A ( x , y) and @(x, y) respectively:
Z ( W ) = A ( x , . v ) CXPli@(X,Y)l (10) where
and
The AM component A ( x , y ) may also be expressed just in terms of all the vector difference frequencies among all the components of S ( x , y ) in the half-plane:
A ( W 4 =
c
l l ~ m l l l l ~ f i l l
ia=1 n=l h.'cos[OItn -Pn)x+ (vm -vn)y+ (Onz- On)]
I
(13)This equation reveals the important property that thepha- sor's A M component depends only on the original im- age S(x, y) and is independent of the carrier frequency (,u,.v,). Therefore the image demodulation process al-
ways produces the same filter-independent AM compo- nent that is particularly useful in our application of this approach to mammograms.
3. ADAPTATION FOR MAMMOGRAPHIC ANALYSIS
Although Daugman and Downing's demodulation trans- form is able to decompose synthetic texture images into
simplified AM and PM components, we have found its performance to be not as good when applied directly to natural or medical images.
Our principal interest in this technique is to apply it to mammograms, to analyze or characterize the texture of the breast tissue, and possibly for lesion detection.
Due to the complexity of the local image structure, no single carrier wave can be chosen to have high predic- tive power; hence the resulting PM component is almost as complex as the original image, achieving no economy through decomposition.
ture demodulation method to our application by introduc- ing the following modifications:
We have therefore adapted the Daugman-Downing tex-
1 . Selection of the half-plane orientation so that it IS
orthogonal to the direction of the dominant Fourier components;
2. Phase-only and amplitude-only reconstruction;
3. Subtraction or partially reconstructed component images.
These modifications are explained below.
3.1. Half-plane selection
The first adaptation of Daugman and Downing's demod- ulation transform is the setting of the half-plane. Their al- gorithm does not restrict the orientation of the half-plane. I-Iowever different choices of the half-plane yield direrent centres of mass as computed by equations (4) and ( 5 ) . It
i s well known [4, p 6031 that the directions of the domi-
nant Fourier magnitude components of an image are or- thogonal to the dominant directions of edges in the im- age. Therefore, to optimize the demodulation transform, the border of the Fourier half-plane should be chosen per- pendicular to the dominant direction of the Fourier com- ponents to capitalize on the dominant directionality of the edges, and possibly texture, in the image. This is the ra- tionale for this choice of the half-plane.
The Fourier plane is first divided into four sectors
centred on four directions: O", 45", 90" and 135". The average magnitude of all the Fourier components is then computed for each sector. The sector with the highest average magnitude is selected to be the dominant direc- tion in the Fourier domain, and hence the border of the half-plane is set peipendicular to it. The centre-of-mass frequency is computed over this half-plane as in equa- tions (4) and ( 5 ) .
3.2. Phase-only and amplitude-only reconstruction
As shown in equation (9), the original image S(.w,y)
is completely reconstructed by the carrier C ( x , y ) and the phasor Z(x,y) = A(x,y) expb@(x,y)]. The notation,
RAM(X.Y) and R p . ~ ( x , y ) , for partially reconstructed com- ponents is now introduced. For Ahi-onZy reconstruction.
only A ( x , y ) is used and all values of @(x?y) are set to zero:
On the other hand, only Q(x:,y) is used in PM-only recon- struction where all values ofA(x,y) are sec to one;
RPM(X,JJ) = 2 ~;(expli9(x.~)]C(.r,f)) (15)
The motivation Cor this step is the observation that a phase- only reconstruction of the discrete Fourier transform of an image results in an edge detected image of the ong- inal [ 5 ] . The intention here was to explore the range of images that resulted from amplitude-only and phase-only reconstruction and to determine if diagnostically useful information about the mammograms could be extracted from them.
3.3. Subtraction
The AM and PM-only reconstructed components, speci- fied in equations (1 1) and (15) respectively, are both lin-
euvlv quuntized to the image hit-depth where
I,,,, is the maximum pixel value. Then the PM-only re- constructed image is subtracted by the photogvuphic neg- ative image of thc AM component, i.e.,
~ ( x , Y ) = & M ( ~ , Y ) - [["lax - ~ ( x J ) ] (16)
where k p( X J ) ~ and
2
(x,y) denote the quantized images of the PM-only reconstructed and AM components re- spectively. Finally, L ~ ( x , J ~ ) is clamped at zero to form the final resulting image N ( x , y ) :N ( x . v ) may then be scaled and quantized once more to [0, ] ,,/, for better visualization so:
This output image was empirically found to be capable of highlighting circtimscr-ihed 11zas.s lesisions on mammo- grams and shall be henceforth be referred to as image suhtruction.
4. EXPERIMENTS WITH MAMMOGRAMS
The new algorithm was tested on 28 mammograms from the MIAS database [6], including 22 circumscribed mas- ses and 6 normal cases, to gauge its ability to highlight Circumscribed masses. The original 50 ydpixel im- ages were low-pass filtered and reduced in resolution to 400 pdpixel. The colour depth of each image was X-
bits grey scale [0-2551, as in the original. The annota- tion supplied with the database provided the location co- ordinates and radius r of the enclosing circle for each le- sion. In our experiments with the 22 abnormal images, the region-of-interest (RO1) was selected as a square re- gion of side length 2 ( r + 10) pixels centred on the loca-
tion co-ordinates of the circumscribed mass. For the nor- mal images, an ROI of size 128 x 128 pixels, was placed on the parenchyma by the first author with no particulaI preference of location.
5. RESULTS
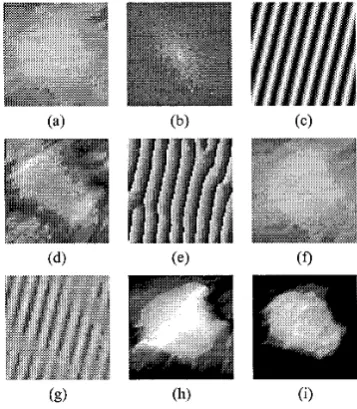
The textural decomposition of an RO1 of a manunogram, highlighting a circumscribed mass lesion is illustrated in Figure 1. Images (a-f) were produced by the Daugman- Downing demodulation transform; while images (g-i) were the three new components generated by the adapted algorithm.
Fig. 1. Demodulation results: (a) Original RO1 showing cir- cumscribed mass and texture of MIAS image mdbO28. (b) 2D Fourier spectrum of texture. (c) Carrier wave. (d) Phasor AM
component. ( e ) Phasor PM component. (f) AMPM complete reconstruction. (8) AM-only reconstruction. (h) PM-only re- construction. (i) Circumscribed mass highlighted by image sub- traction as defined in equations (1 f+( 18).
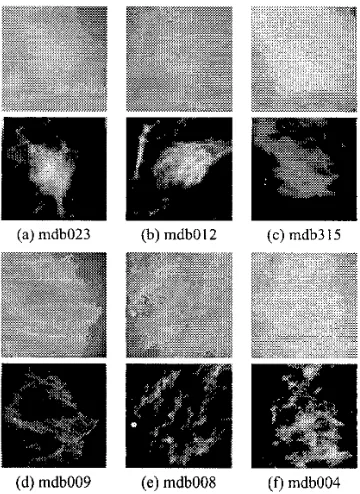
Figure 2 shows more results of both circumscribed masses (top row) and normal cases (bottom row). The three examples of nomial cases 1-epresent the breast tis- sues of different density: fatty (d), fatty-glandular (e) and dense (f).
As a preliminary evaluation, the 28 subtracted images were examined by the first author. Out of 22 circum- scribed mass images, 19 were considered acceptable. In these cases, the shape of the lesion was highlighted accu- rately and the background was dark. In the other three, although the circumscribed masses was highlighted, the shape of the highlighted region did not accurately reflect the lesion shape. Note also that the subtracted images of the six normal cases highlight regions of the breast, even though they do not contain circumscribed masses.
6. DISCUSSION
(a) mdb023 (b) mdbO I2 (c) mdb3 I5
(d) mdb009 (e) mdb008 ( f ) mdb004
Fig. 2. (a-c) Original and highlighted images for circum- scribed masses. (d-f) Original and highlighted images for nor-
mal breast tissue. The window sizes of images (a), (b) and
(e) wcre 52 x 52, 62 x 62 and 114 x 114 pixcls rcspectively; whereas the window size of images (d-e) was fixed at 128 x 128 pixels.
intensity backgrounds using the adapted algorithm on ap- propriate ROIs. In a few cases, the algorithm failed due to the mass overlapping with the pectoral muscle or part of the lesion being lost at the image edge. Most noteworthy is the observation that in the subtracted images, the cir- cumscribed masses are themselves highlighted while the other glandular tissues are suppressed. This reveals an important difference between our results and those from methods that rely on optimal thresholding or bandpass filtering.
The new method, however, does not appear to have good specificity. When it is applied to normal breast tissue, the glandular tissues are themselves highlighted, rather than suppressed, forming some irregular and non- circular shapes in the resulting image. This effect is more significant for dense breast tissues. Therefore a shape analysis operator may need to be developed to distin- guish circular and non-circular shapes so as to improve the specificity for circumscribed mass lesions. More- over, the appearance of these highlighted normal tissue fractions are so different from the appearance of circum- scribed masses that it is not difficult to visually distin- guish normal and abnormal tissues from the highlighted images. As a final point, the highlighting of normal breast tissue may prove itself useful for modelling and subtract- ing out portions of the breast tissue for dense breasts, thus enhancing visualization.
7. CONCLUSIONS
In this paper we have summarized the Daugman-Downing demodulation scheme and adapted it for mammographic texture analysis. We have demonstrated the decompo- sition of an image into the carrier and the phasor AM and PM components and also its complete reconstruction from these components. The adaptations we have intro- duced have been explained together with their rationale. These are: (1) the selection of the Fourier half-plane; (2) partial re-construction and (3) PM-only reconstruc- tion followed by subtraction of the photographic nega- tive AM component. This modified algorithm was found to highlight circumscribed masses on mammograms with high sensitivity. The method, however, has poor speci- ficity, which needs to be investigated further. It is our belief that a new and fruitful approach to mammographic texture analysis and abnomiality detection has resulted from this work.
Acknowledgements
This research was partially supported by The Univer- sity of Westem Australia Small Grant (UWASG) No. 12 104000, by Australian Research Council (ARC) Large Grant No. A00000714, and by the Western Australian Government through funding of ARCME as part of its
Centres of Excellence programme.
REFERENCES
J. Daugman and C. Downing, “Demodulation: A new approach to texture vision,” in Spatial Vision in Hu- mans und Robots: The Proceedings ojthe 1991 York Conference on Spatial Vision in Humans and Robots
(L. Harris and M. Jenkin, eds.), ch. 5 , pp. 63-87, New York: Cambridge University Press, 1993.
J. G. Daugman and C. J. Downing, “Demodulation, predictive coding, and spatial vision,” Journal of the Optical Society ofdmericu A , vol. 12, pp. 641-660, Apr. 1995.
R. Chandrasekhar and Y. Attikiouzel, “New range- based neighbourhood operator for extracting edge and texture information from mammograms for sub- sequent image segmentation and analysis,” IEE Proceedings-Science, Measurement and Technoi-
ogy, vol. 147, pp. 408413,Nov. 2000.
M. Sonka, V. Hlavac, and R. Boyle, Image Process- ing, Analysis, and Machine W o n . Pacific Grove, CA, USA: PWS Publishing, 2nd ed., 1999.
J. S. Lim, Two-dimensional signal and image pro- cessing. Englewood Cliffs, NJ, USA: Prentice-Hall, 1990.
J. Suckling, J. Parker, D. R. Dance, and S. A. et al., “The Mammographic Image Analysis Society Digi- tal Mammogram Database,” in Digital Mammogra- phy (A. G. Gale, S. M. Astley, D. R. Dance, and A. Y. Caims, eds.), (Amsterdam, The Netherlands), pp. 375-378, Elsevier Science, 1994.