Vegesna et al. World Journal of Pharmaceutical and Life Sciences
RP-HPLC METHOD DEVELOPMENT AND VALIDATION FOR THE SIMULTANEOUS
ESTIMATION OF SACUBITRIL AND VALSARTAN IN BULK AND
PHARMACEUTICAL DOSAGE FORM
Vegesna Swetha*1, S. V. U. M. Prasad2 and M. Indupriya1
1
School of Pharmacy, Jawaharlal Nehru Technological University, Kakinada.
2Program Director, School of Pharmaceutical Sciences and Technologies, JNTU Kakinada.
Article Received on 13/09/2017 Article Revised on 03/10/2017 Article Accepted on 24/10/2017
INTRODUCTION
Valsartan is a nonpeptide, orally active and specific angiotensin II receptor blocker acting on the AT1 receptor subtype. Valsartan is chemically N-(1-oxopentyl)-N-[[2'-(1Htetrazol-5- yl)[1,1'-biphenyl] -4-yl]methyl]-Lvaline.[1-4] Methods such as HPLC[5-7], LC-MS[8-9], protein precipitation[10] and simultaneous UV-spectrophotometric methods[11-12] are reported for estimation of valsartan alone or in combination with other agents. Sacubitril is chemically 4- [[(2S,4R)-5- ethoxy-4-methyl-5-oxo-1-(4-phenylphenyl)pentan-2-yl]amino]-4-oxobutanoic acid.[13]
Figure 1: Chemical structure of valsartan.
Sacubitril is an antihypertensive drug used in combination with valsartan for the treatment of heart failure.[14-15] Literature search reveals that only two analytical methods were reported for simultaneous estimation of sacubitril and valsartan from rat plasma using LC-MS/MS[16] and from a synthetic mixture using HPLC.[17]
Figure 2: Chemical structure of valsartan.
There is no stability indicating analytical methods were reported for simultaneous estimation of sacubitril and valsartan. Hence a simple, rapid, sensitive and accurate stability indicating HPLC method was developed for the
World Journal of Pharmaceutical and Life Sciences
WJPLS
www. wjpls. org SJIF Impact Factor: 4. 223
*Corresponding Author: Vegesna Swetha
School of Pharmacy, Jawaharlal Nehru Technological University, Kakinada.
ABSTRACT
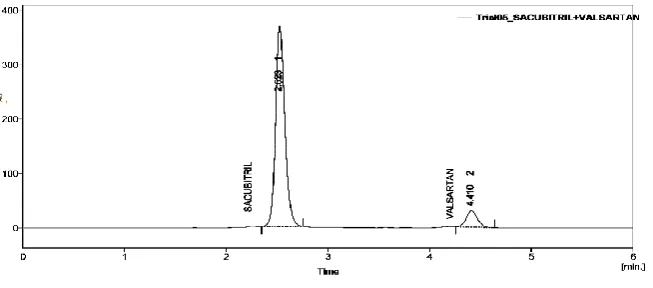
A simple and selective LC method is described for the simultaneous estimation of sacubitril and valsartan in tablet dosage forms. Chromatographic separation was achieved on a Inertsil ODS 3V column using mobile phase consisting of a mixture of 50 volumes of Triethylamine buffer, and 50 volumes of acetonitrile; pH 3.5 at isocratic mode and eluents were monitored at 239nm.With the optimized method, the retention times of sacubitril and valsartan were found to be 2.523 and 4.410mins respectively with theoretical plate count and assymetry as per the ICH limits. Linearity was observed in the concentration range of 5-15µg/ml for Sacubitril (r2 =0.999) and 2.5-7.5 µg /ml for Valsartan (r2 =0.999). The method was found to be precise as indicated by the repeatability analysis, showing %RSD less than 2. The percentage assays were found to be 100.27% and 101.98% respectively. Limit of detection and Limit of quantification values were found to be 0.015, 0.038 and 0.004,0.011 respectively. All statistical data proves validity of the method in accordance with ICH guidelines and hence can be successfully applied to the simultaneous estimation of Sacubitril and Valsartan.
simultaneous estimation of sacubitril and valsartan from API and pharmaceutical dosage form.
MATERIALS AND METHODS[17]
Materials and reagents
Triethyl amine, Acetonitrile, orthophosphoric acid HPLC and AR grade were procured from Merck and Rankem lab ltd. Sacubitril and valsartan standards were received as gift samples from KP labs, Hyderabad, India and the combination collected from local pharmacy.
Instrumentation
Chromatographic separation was performed on HPLC system consist of model Shimadzu LC-20 AT having SPD-20AT detector and rheodyne injector with 20μl loop volume. Spinchrom software was applied for data collecting and processing. UV spectrophotometer which consists of model Systronic 119 is also used to measure the wavelength of the solution of Sacubitril and Valsartan.
Preparation of mixed standard solution
Weigh accurately 10mg of SACUBITRIL and 15 mg of VALSARTAN in 100 ml of volumetric flask and dissolve in 100ml of mobile phase and make up the volume with mobile phase. From above stock solution 100 µg/ml of Sacubitril and 150 µg/ml of Valsartan is
prepared by diluting 1.5ml to 10ml with mobile phase. This solution is used for recording chromatogram.
Tablet sample
10 tablets were weighed (each tablet Entresto containing sacubitril-24mg and valsartan-26mg and taken into a mortar and crushed to fine powder and uniformly mixed taken into a mortar and crushed to fine powder and uniformly mixed. Tablet stock solutions of valsartan and sacubitril (μg/ml) were prepared by dissolving weight equivalent to 10 mg of sacubitrl and 15mg of valsartan and dissolved in sufficient mobile phase. After that filtered the solution using 0.45-micron syringe filter and Sonicated for 5 min and dilute to 100ml with mobile phase. Further dilutions are prepared in 5 replicates of 100μg/ml of sacubitril and 150μg/mlof valsartan was made by adding 1.5 ml of stock solution to 10 ml of mobile phase.
Chromatographic conditions
Inertsil ODS C18 (250*4.6 mm, 5µm) column was used as the stationary phase. A mixture of triethylamine (pH 3.0) and acetontrile in the ratio of (50:50 %v/v) was used as a mobile phase and pH 3.0 adjusted with ortho phosphoric acid. It was filtered through 0.45μ (micron) membrane filter and degassed. The mobile phase was pumped at 1.0 ml/min. The eluents were monitored at 239nm. The injection volumes of sample and standard were 20μl (microliter). Total run time is 6mins.
Figure 3: optimised chromatogram.
The developed Method was validated for linearity, precision, accuracy, robustness and is applied for forced degradation studies as per the ICH guidelines.[18-23]
Assay
Preparation of samples for Assay Preparation of standard solution
Weigh accurately 10mg of SACUBITRIL and 15mg of VALSARTAN in 100ml volumetric flask and dissolve in 100ml of mobile phase and make up the volume with mobile phase. From above stock solution 100 µg/ml of SACUBITRIL and 150 µg/ml of VALSARTAN is prepared by diluting 1.5ml to 10ml with mobile phase. This solution is used for recording chromatogram.
Tablet sample
Calculated or Sample Weight
%Assay of Drug= Sx Label claim
RESULTS AND DISCUSSION
Method validation
The described method has been validated which include parameters like system suitability, linearity, accuracy,
precision, robustness, LOD (limit of detection) and LOQ (limit of quantification).
System suitability
System suitability and chromatographic parameters were validated such as resolution, theoretical plates, and tailing factor was calculated. The results are given in table 1.
Table 1: Optimized method parameters.
S.No Name Retention
time
Peak
area Resolution
Tailing factor
1 Sacubitril 2.523 2325117 - 1.40 2 Valsartan 4.410 2241282 10.248 1.19
Linearity
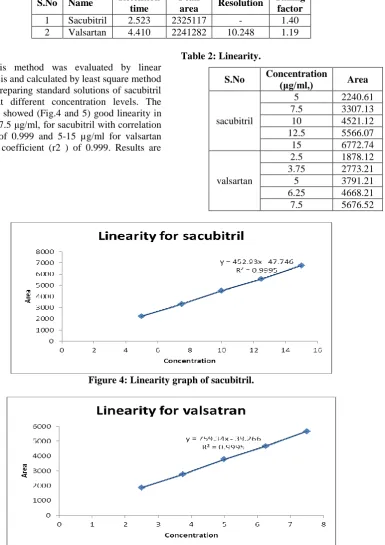
Linearity of this method was evaluated by linear regression analysis and calculated by least square method and studied by preparing standard solutions of sacubitril and valsartan at different concentration levels. The calibration curve showed (Fig.4 and 5) good linearity in the range of 2.5-7.5 μg/ml, for sacubitril with correlation coefficient (r2) of 0.999 and 5-15 µg/ml for valsartan with correlation coefficient (r2 ) of 0.999. Results are given in table -2.
Table 2: Linearity.
S.No Concentration
(μg/ml,) Area
sacubitril
5 2240.61 7.5 3307.13 10 4521.12 12.5 5566.07 15 6772.74
valsartan
2.5 1878.12 3.75 2773.21 5 3791.21 6.25 4668.21 7.5 5676.52
Figure 4: Linearity graph of sacubitril.
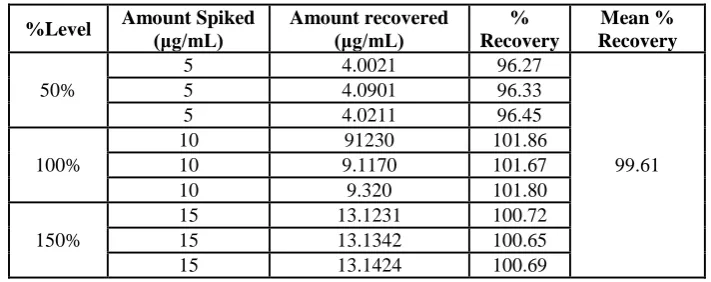
Accuracy
Recovery studies were carried out by addition of standard drug to the sample at 3 different concentration levels (80%, 100% and 120%) taking into consideration percentage purity of added bulk drug samples. At each concentration, sample was injected thrice to check
repeatability and from the % RSD values it was analyzed that the method was accurate as % recovery values found to be in the range of 99.72-100.02% for the Sacubitril and 99.87- 100.17 % for valsartan at three different concentrations 80%, 100%, 120%. The results are given in table 3 and 4.
Table 3: Accuracy table of sacubitril.
%Level Amount Spiked
(μg/mL)
Amount recovered (μg/mL)
% Recovery
Mean % Recovery
50%
5 4.0021 96.27
99.61
5 4.0901 96.33
5 4.0211 96.45
100%
10 91230 101.86
10 9.1170 101.67
10 9.320 101.80
150%
15 13.1231 100.72 15 13.1342 100.65 15 13.1424 100.69
Table 4: Accuracy table of Valsartan.
%Level Amount Spiked (μg/mL) Amount recovered (μg/mL) %
Recovery
Mean % Recovery
50%
2.5 1.5300 100.21
100.58 2.5 1.4309 100.56
2.5 1.5670 100.45
100%
5 3.0010 100.24
5 3.0230 100.87
5 4.0120 100.86
150%
7.5 6.5661 100.43 7.5 6.5632 100.31 7.5 6.5564 10.23
Precision
Method Precision
Standard solution containing sacubitril (24.5 µg/ml) and valsartan (25.5 µg/ml) was injected six times and areas
of peaks were measured and % R.S.D. was calculated. The results are givenin table 5.
Table 5: Method Precision.
Intraday data of Sacubitril Interday data of Valsartan
S.No. Rt Area S.No. Rt Area
1 2.507 2350119 1 4.397 202888 2 2.497 2341355 2 4.390 208551 3 2.507 2319879 3 4.397 208704 4 2.507 2305220 4 4.397 200953 5 2.523 2321138 5 4.390 205011 6 2.523 2331562 6 4.413 201450
Avg 23122.21 Avg 209.98
SD 1.32 SD 1.32
System precision of sacubitril and valsatran
Table 6: system precision of sacubitril and valsartan.
Intraday data of Sacubitril Interday data of Valsartan
S.No. Rt Area S.No. Rt Area
1 2.510 2192247 1 4.397 227545 2 2.523 2322573 2 4.410 211442 3 2.523 2321138 3 4.413 202102 4 2.523 2333196 4 4.413 200853 5 2.507 2350119 5 4.397 202888 6 2.497 2341315 6 4.390 228551
Avg 2314.67 Avg 227.80
SD 1.25 SD 1.39
%RSD 0.56 %RSD 0.61
Limit of Detection
The detection limit of an individual analytical procedure is the lowest amount of analyte in a sample which can be detected but not necessarily quantitated as an exact value.
• Based on Signal-to-Noise.
• Based on the Standard Deviation of the Response and the slope.
LOD = (3.3 * σ) / S
Where, σ = the standard deviation of the response S = the slope of the calibration curve
The slope S may be estimated from the calibration curve of the analyte.
Limit of Quantification
The quantitation limit of an individual analytical procedure is the lowest amount of analyte in a sample which can be quantitatively determined with suitable precision and accuracy. From the linearity data calculate the limit of detection and quantitation, using the following formula,
LOQ = (10 * σ) / S
When,σ = the standard deviation of the response S = the slope of the calibration curve
The slope S may be estimated from the calibration curve of the analyte.
Table 7: LOD & LOQ results.
S.No Drug name LOD (µg/ml) LOQ (µg/ml)
1 Sacubitril 0.015 0.038 2 Valsartan 0.004 0.011
Robustness
Small deliberate changes in chromatographic conditions such as change in mobile phase ratio (+ 2 %), change in pH (±2 units) and flow rate (± 2 units) were studied to determine the robustness of the method. The results were in factor of (% RSD< 2%) the developed RPHPLC method for the analysis of sacubitril and valsartan. The results are given in table 8 and 9.
Table 8: Robustness.
S.no
Robustness parameter
Sacubitril Valsatran
Retention time
Tailing factor
Retention time
Tailing factor
Flow rate 0.8 ml 3.130 1.258 5.443 1.167 1.02ml 2.090 1.036 3.663 0.943 Wave
length
237 nm 2.513 1.222 4.380 1.088 241 nm 2.517 1.179 4.380 1.125
Assay
Figure 6: ASSAY Chromatogram.
Table 9: Assay Results.
SACUBITRIL VALSARTAN
Standard Area Sample Area Standard Area Sample Area
Injection-1 2334362 2344463 207967 212684
Injection-2 2323199 2351614 199968 209655
Injection-3 2337863 2337863 207039 207039
Injection-4 2331502 2334732 207632 210092
Injection-5 2328483 2341801 198197 210080
Average Area 2331082 2342095 2041606 209910
Standard deviation 6.48 6.45
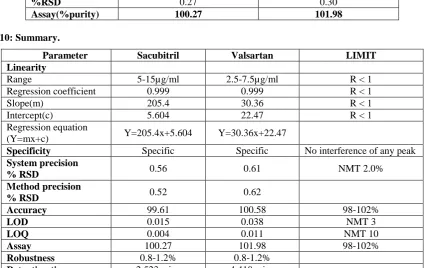
%RSD 0.27 0.30
Assay(%purity) 100.27 101.98
Table 10: Summary.
Parameter Sacubitril Valsartan LIMIT
Linearity
Range 5-15µg/ml 2.5-7.5µg/ml R < 1 Regression coefficient 0.999 0.999 R < 1
Slope(m) 205.4 30.36 R < 1
Intercept(c) 5.604 22.47 R < 1 Regression equation
(Y=mx+c) Y=205.4x+5.604 Y=30.36x+22.47
Specificity Specific Specific No interference of any peak
System precision
% RSD 0.56 0.61 NMT 2.0%
Method precision
% RSD 0.52 0.62
Accuracy 99.61 100.58 98-102%
LOD 0.015 0.038 NMT 3
LOQ 0.004 0.011 NMT 10
Assay 100.27 101.98 98-102%
Robustness 0.8-1.2% 0.8-1.2%
Retention time 2.523 mins 4.410 mins
CONCLUSION
This newly developed method for the simultaneous estimation of Sacubitril and Valsartan was found to be simple, precise, accurate and high resolution and shorter retention time makes this method more acceptable and
REFERENCES
1. Budavari S. The Merck index. 14th ed. Whitehouse Station. NJ Merck and Co. Press, 2006.
2. Neil MJ, Smith A, Heckelman PE, Kinneary JF. The Merck Index: An Encyclopedia of Chemicals. Edition. 14. Drugs and Biologicals, 2006; 1767. 3. Criscione L, Bradley W, Buhlmayer P, Whitebread
S, Glazer R, Lloyd P, Mueller P, et al.Clinical advantage of valsartan. Drug Rev, 1995; 13: 230-50. 4. The United States Pharmacopoeia. 31, National
Formulary, 26. Vol. 2 US Pharmacopoeia Convention, INC; Rockville M, 2008; 3496-8. 5. Kocyigit Kaymacoglu B, Unsalan S, Rollas S.
Determination and validation of Ketoprofen, Pantoprazole, and Valsartan together in human plasma by high-performance liquid chromatography. Pharmazie, 2006; 61: 586-9.
6. Daneshtalab N, Lewanczuk RZ, Jamali F. High performance liquid chromatographic analysis of angiotensin-II receptor antagonist Valsartan using a liquid extraction method. J Chromatogr B: Anal Technol Biomed Life Sci, 2002; 766: 345-59. 7. Gonzalez L, Lopez JA, Alonso RM, Jimenez RM.
Fast screening method for the determination of angiotensin II receptor antagonists in human plasma by high performance liquid chromatography with fluorimetric detection. J Chromatogr A, 2002; 8: 49-60
8. Koseki N, Kawashita H, Hara H, Niina M, Tanaka M, Kawai R, et al. Development and validation of a method for quantitative determination of valsartan in human plasma by liquid chromatography-tandem mass spectrometry. J Pharm Biomed Anal, 2007; 43: 1769-74.
9. Li H, Wang Y, Jiang Y, Tang Y, Wang J, Zhao L, et al. A liquid chromatography/tandem mass spectrometry method for the simultaneous quantification of valsartan and hydrochlorothiazide in human plasma. J Chromatogr B: Anal Technol Biomed Life Sci, 2007; 852: 436-42.
10. Macek J, Klima J, Ptacek P. Rapid determination of Valsartan in human plasma by protein precipitation and high-performance liquid chromatography. J Chromatogr B: Anal Technol Biomed Life Sci, 2006; 832: 169-72.
11. Satana E, Altinay S, Goger NG, Ozkan SA, Sentürk Z. Simultaneous determination of valsartan and hydrochlorothiazide in tablets by first-derivative ultraviolet spectrophotometry and LC. J Pharm Biomed Anal, 2001; 5: 1009-13.
12. Tatar S, Saglik S. Comparison of UV-and second derivative-spectrophotometric and LC methods for the determination of Valsartan in a pharmaceutical formulation. J Pharm Biomed Anal, 2002; 30: 371-5. 13. https://pubchem.ncbi.nlm.nih.gov/compound/98118
34.
14. Voors AA, Dorhout B, Van Der Meer P. The potential role of valsartan+AHU377 (LCZ696) in the treatment of heart failure. Expert Opin Investig Drugs, 2013; 22: 1041-7.
15. Novartis AG. Novartis’ new heart failure medicine LCZ696, now called Entresto, approved by FDA to reduce the risk of cardiovascular death and heat failure hospitalisation. Available from https://www.novartis.com/news/media-releases/ Novartis -new-heart-failure-medicine-lcz696-now-called-entrestotm-approved-fda.
16. Chunduri RHB, Dannana GS. Development and validation of a reliable and rapid LCMS/MS method for simultaneous quantification of sacubitril and valsartan in rat plasma and its application to a pharmacokinetic study. Biomed Chromatogr, 2016; 30: 1467–75.
17. Kena H Patel, Shailesh V, Luhar, Sachin B Narkhede. Simultaneous estimation of sacubitril and valsartan in the synthetic mixture by RP-HPLC method. J Pharm Sci Biosci Res, 2016; 6: 262-9. 18. ICH guidelines for the stability of new drug
substances and products. Q1A(R2) ICH, Geneva, 2005; 1-13
19. ICH guidelines for validation of analytical procedures: text and methodology. Q2(R1) ICH, Geneva, 2005; 1-14.
20. Bhatia MS and Kokil SU. Determination and validation of valsartan and its degradation products by isocratic HPLC. J Chem Met, 2009; 3: 1-12. 21. Parambi DT, Mathew M and Ganesan V. A
validated stability indicating HPLC methodfor the determination of valsartan in tablet dosage forms. J App Pharm Sci, 2011; 1: 97-99.
22. Ramachandran S, Mandal BK and Navalgund SG. Stability indicating HPLC method for the simultaneous determination of valsartan and ezetimibe in pharmaceuticals. TopJ Pharm Res, 2014; 13: 809-817.