www.fm.viamedica.pl
Address for correspondence: Maciej Równiak, Department of Comparative Anatomy, University of Warmia and Mazury in Olsztyn, Plac Łódzki 3, 10–767 Olsztyn, Poland, tel: +48 89 523 32 98, e-mail: [email protected]
INTRODUCTION
There are 2 types of investigative process used by neuroscientists to examine the amygdala (CA) and other brain structures. The first of these is qualita-tive research, which employs symbols and words to indicate the presence or absence of features or to categorise them into different types. This approach has been adopted by the overwhelming majority of investigations devoted to CA during the last century and has indeed given deep insight into the structure
A morphometric study of the amygdala
in the guinea pig
Maciej Równiak, Anna Robak, Stanisław Szteyn, Krystyna Bogus-Nowakowska,
Barbara Wasilewska, Janusz Najdzion
Department of Comparative Anatomy, University of Warmia and Mazury, Olsztyn, Poland
[Received 30 June 2005; Accepted 22 July 2005]
The characteristic features of guinea pig amygdala (CA), as shown by volumetric comparisons of the individual nuclei, are the poor development of the basolat-eral (BL) and latbasolat-eral olfactory tract (NLOT) nuclei as well as the strong formation of the lateral (LA) and basomedial (BM) nuclei. The central (CE), cortical (CO) and medial (ME) nuclei also appear to be well represented in this species. All these features are even more pronounced when the total number of neurons in the nuclei referred to was taken into consideration. A comparison of the densities of neurons in the individual nuclei with the mean numerical density of cells in the guinea pig CA indicates that the densities of neurons in LA, BL, BM, CE and CO are significantly lower than the mean (p < 0.05), whereas in the ME and NLOT these values are significantly higher than the mean (p < 0.05). It is noteworthy, that the densities of the neurons in CE and CO do not differ statistically from each other (p > 0.05) and are significantly higher than the respective values in LA, BL and BM (p < 0.05). Furthermore, a similar division of the guinea pig CA may to some extent be made using the size parameters of the amygdaloid neu-rons as a marker. Interestingly, the large neuneu-rons populate organised CA areas like LA, BL and BM less densely, whereas the small cells create ME and NLOT, where the neurons are densely arranged. CE and CO occupy intermediate posi-tions, with the neurons similar in size to the mean for the guinea pig CA.
Key words: amygdala, guinea pig, morphometric analysis, 3-D reconstructions
can sometimes lead to different and inconsistent conclusions [50]. The second type of investigative process is quantitative research, which employs nu-merical indicators to ascertain the relative sizes, num-bers and densities of the brain structures studied and their constituents. While qualitative methods can supply a greater depth of information about the nature of the brain structure studied, the quantita-tive methods can provide a high level of measument precision and statistical power. Since the re-sults reported from quantitative research are only in numerical form, direct comparisons can be made and the relationships between them statistically verified without difficulty. Moreover, since the results are statistically reliable, quantitative research can reli-ably determine the differences and similarities be-tween the brain structures investigated. For this rea-son quantitative data can be used successfully in comparative research on the brain structures in dif-ferent species [4, 20, 47, 50, 51].
In spite of all the advantages of the quantitative methods mentioned above, they have so far only occasionally been used in anatomical studies on CA. Hardly anything, for example, is known about the size of individual nuclei in CA of most of the species studied. The only detailed volumetric relationships between various amygdaloid regions were those re-ported by Maksymowicz [36] in the dog, by Śmiałowski [54] in the macaque and by Równiak et al. [46] in the common shrew. The size parame-ters of the basolateral amygdala were described by Breathnach and Goldby [4] in the porpoise and by Berdel et al. [1] in the developing brain of the rat. The comparative volumetric studies of Stephan et al. [50–52] in insectivora and primates are the most extensive to date, although they are restricted to the larger areas of CA and not to the single nuclei. Of the individual amygdaloid structures only NLOT and the large-celled portion of BL were taken into con-sideration. The quantitative aspects of the cellular populations in CA are even more obscure. For in-stance, detailed data concerning the density of neu-rons in individual amygdaloid nuclei have only been given for the common shrew [46] and they are, to the best of our knowledge, not available for other species. The total number of neurons in CA has been studied so far in the common shrew [46] and selected structures of the rat CA [48]. The only known detailed morphometric studies concerning the size of CA neu-rons have been those performed by Dziewiątkowski et al. [9] in the rabbit and, more recently, by Równiak et al. [46] in the common shrew.
The aim of our study, therefore, was to give the first detailed morphometric characteristics of CA in the guinea pig. These raw data on the morphomet-ric measurements of the amygdaloid nuclei and their neurons enable comparisons to be made with simi-lar data obtained in other laboratories from the same species. They can also be used in interspecific com-parisons [4, 50–52].
MATERIAL AND METHODS
A total of 6 brains were used to study the mor-phometric parameters of CA in the guinea pig. All efforts were made to minimise both animal suffer-ing and the number of animals used. The brains were removed from the skulls, embedded in paraffin and sectioned on the Leica microtome at a thickness of 50 µm in the coronal plane.All sections were analysed cytoarchitectonically and morphometrically with a calibrated image ana-lysis system consisting of a computer equipped with morphometric software (Multi-Scan 8.2, Computer Scanning Systems, Poland) and a light microscope coupled with a digital camera (CM40P, VideoTronic, Germany). The sequence of operations performed on a single animal is described in detail below.
3-D reconstruction of CA
The microscopic fields were viewed at low mag-nification through a 5-fold objective. The 512 × 512 pixel microscopic images of a single section were digitally recorded by means of a camera coupled to a microscope and a computer. The scans were subse-quently joined together to form larger areas compris-ing the whole CA and adjoincompris-ing structures (so-called “digital slices”). Every second section in the series of microtome scraps available was taken into account.
The digital slices were registered by means of TPS (USA) and Morpheus (USA) morphometric software according to the Generalized Procrustes Analysis (GPA) that superimposes the landmark configura-tions using least squares estimates for the transla-tion and rotatransla-tion parameters [2, 11, 43, 44]. For more detailed information concerning the recording pro-cess used in the present study see our previous pa-per in this series [46].
the individual amygdaloid nuclei were outlined in different colours by a mouse-driven cursor. All the out-lines were drawn under the control of the light micro-scope. The definite stack was then composed of the serially aligned raw images and the outlined structures of CA incorporated. With the help of IGL Trace software the 2-D outlines were transformed into 3-D slabs. The 3-D reconstruction of CA for a single animal was simply the sum of all the serially aligned slabs.
Volumetric analysis
In order to evaluate the volume of the individual amygdaloid nuclei, the volumes of slabs traced with the same colour were totalled according to the for-mula proposed by Cavaliero [12, 26]. The total CA volume presented in this study was the sum of the volumes of the 7 amygdaloid nuclei studied, namely the lateral, basolateral, basomedial, central, corti-cal, medial and lateral olfactory tract nuclei.
Numerical density counts
To evaluate the numerical density of cells in each of the amygdaloid nuclei, the optical dissector method was implemented using the guidelines described by West and Gundersen [56].
Evaluation of the total number of neurons The total number of neurons in each of the nu-clei studied was calculated by multiplying the vo-lume of the given nucleus by the numerical density of the cells in it [56].
The morphometric parameters of the neurons
In each of the individuals studied a morphomet-ric analysis of CA neurons was performed using Multi-Scan 8.2 morphometric software. Each neuron was characterised by a set of morphometric parameters: the length (the long axis of the soma), the width (the short axis of the soma), the size (the sum of both axes) and the shape factor (the ratio of both axes). The test frames were arranged so as to cover the total cross-sectional area of the nucleus studied. In the guinea pig 5 cross-sections per nucleus in the single animal were taken into account.
Statistical analysis
The statistical analysis was performed using CSS: Statistica v.5.0 (Statsoft, USA). The analysis of vari-ance (ANOVA) was performed followed by post hoc tests (Duncan’s post hoc analysis) and planned com-parison tests (Student’s paired t-test) between the consecutive pairs of means. The level of statistical significance was set at p < 0.05. In order to
evalu-ate the precision of all measurements, the coeffi-cient of error was calculated. Values below 0.1 were achieved for all the parameters examined.
RESULTS
The nuclear pattern of the guinea pig CA The position of the various amygdaloid nuclei in the guinea pig CA and the pattern of their delimita-tion are shown in Figures 1 and 2 respectively.
As in other mammalian species, CA of the guin-ea pig is rguin-eally 3 collections of nuclei. The largest and the best differentiated portion of CA is the ba-solateral nuclear group (BLC), consisting of the lat-eral (LA), basolatlat-eral (BL) and basomedial (BM) nu-clei. The second is the central group (CC), composed of the anterior amygdaloid area (AAA) as well as the central (CE) and intercalated nuclei (I). The third por-tion of CA is the corticomedial group (CMC), formed by the cortical (CO) and medial nuclei (ME) as well as the nucleus of the olfactory tract (NLOT) and the amygdalohippocampal area (AHA).
The general morphology and cellular structure of these different amygdaloid regions in the guinea pig CA and their parcellation into the finer parts are very similar to those of the other rodents [21, 49]. Briefly, on the basis of more subtle differences in the density and cell size within LA, BL and BM, they can be further subdivided into the anterior (LAa, BLa and BMa) and posterior (LAp, BLp and BMp) parts. Two subdivisions are also present within CE, although the boundaries between them are not as clear-cut as in the basolateral nuclei. The medial part (CEm) is located more rostrally and is composed of the larg-er, darker and more tightly-packed cells. The lateral part (CEl) contains the smaller, lighter and more loosely arranged neurons. In ME it is also possible to distinguish 2 regions, according to differences in the density and size of the cells. The anterior part (MEa) forms the rostral and main body of the nucleus, whereas the posterior part (MEp) constitutes the small thin caudal portion. Finally, CO consists of 3 distinct regions: the anterior cortical nucleus (COa), the periamygdaloid cortex (COc) and the posterior cortical nucleus (COp).
the present study. The minor difficulties which were encountered in delineating the boundary between BM and CO, as well as the rostral borders of ME and CE, were overcome by taking into consideration the bor-ders in the adjacent sections. Since all sections are serially aligned, the additional support in delineat-ing the obscure portions in the guinea pig CA pro-vided thick digital sections (200–300 µm) composed from single 50-µm scraps.
The morphometric parameters of CA of the guinea pig
The morphometric data concerning individual CA nuclei are listed in the respective rows of Table 1. The values for CA as a whole are presented in the last row.
Volume. The characteristic features of the guinea pig CA are poor development of BL and NLOT, while LA and BM are, in contrast, strongly formed.
CE, CO and ME also appear well preserved in this species. The smallest average volume in the guinea pig’s CA is that of NLOT, while the largest is that of LA. According to the raw volumetric measurements and percentages, almost all the nuclei studied are significantly different (p < 0.05), although CE does not differ statistically from ME (p > 0.05).
Numerical density. The density of neurons in the guinea pig CA is smallest in BL, while that in NLOT is the largest. Comparison of the densities of cells in the individual amygdaloid nuclei with the average for the total CA reveals that the densities of neurons in LA, BL, BM, CE and CO are significantly lower than the mean (p < 0.05), whereas in ME and NLOT these values are significantly higher than the mean (p < 0.05). It should be noted, however, that the density of neu-rons in CE does not differ significantly from that in CO (p > 0.05). The density of cells in ME is also statisti-cally similar to that in NLOT (p > 0.05).
The total number of neurons. The smallest num-ber of neurons in the guinea pig’s CA is in NLOT, whereas the largest cellular population is in LA. Ac-cording to the raw measurements and percentages, all the nuclei studied are indeed different (p < 0.05).
The morphometric parameters of neurons in the guinea pig CA
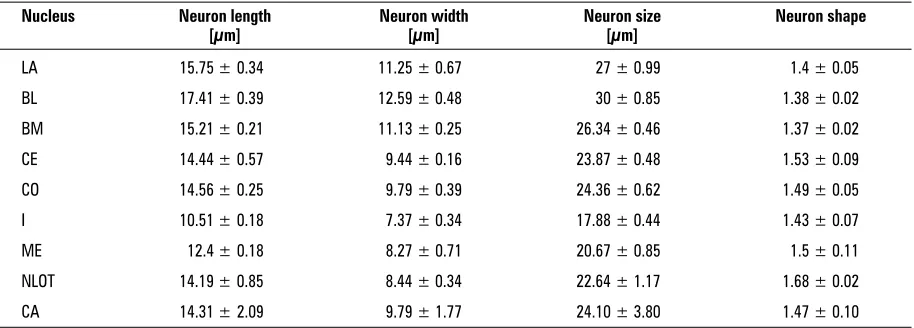
The morphometric parameters of neurons in par-ticular CA nuclei are listed in the respective rows of Table 2. The mean values for CA are presented in the last row.
Neuron length. The smallest average length of the soma in the guinea pig CA is displayed by the neurons located in the I, whilst the cells in BL are the longest. The average lengths of neurons in LA, BL, BM and CO are significantly higher than the length of the mean CA neuron (p < 0.05). This value in CE does not differ statistically from the mean (p > 0.21). In the remaining nuclei the average lengths of neu-rons are significantly lower than the mean (p < 0.05). According to this parameter, almost all the nuclei studied are significantly different (p < 0.05), although CE does not differ statistically from CO (p > 0.05).
Neuron width. The smallest average width of the soma in the guinea pig CA is displayed by the cells in the I, whereas the largest perikarya, accord-ing to this parameter, are present in BL. The average widths of neurons in LA, BL and BM are significantly higher than the width of the mean CA neuron (p < 0.05). This value in CO does not differ statisti-cally from the mean (p > 0.95). In the remaining nuclei these values are significantly lower than the mean (p < 0.05). According to this parameter al-most all the nuclei studied are significantly different (p < 0.05), although LA does not differ statistically from BM (p > 0.05), nor ME from NLOT (p > 0.05).
The average size of neurons. The size of a neu-ron in the guinea pig CA was expressed in the present
study as the sum of the length and width of the soma. The smallest size values in the guinea pig CA are found in the cells in the I. The neurons in BL are the largest. The average sizes of neurons in LA, BL and BM are significantly higher than the size of the mean CA neuron (p < 0.05). This value in CO does not differ statistically from the mean (p > 0.06). In the remaining nuclei the average sizes of the neurons are significantly lower than that of the mean CA neu-ron (p < 0.05). According to this parameter all the nuclei studied are significantly different (p < 0.05).
The shape of neurons. The shape of a neuron in the guinea pig CA was expressed in the present study as the ratio of the length and width of its soma (the shape factor). The smallest average value of this co-efficient was noted in BM, whereas the largest mean was observed in NLOT. The shape factor values in CE and NLOT are significantly higher than the mean value for the total guinea pig CA (p < 0.05). In CO
(p > 0.05) and ME (p > 0.22) these values do not differ statistically from the mean. In the remaining nuclei they are significantly lower than the mean (p < 0.05). According to this parameter, almost all the nuclei studied show significant differences (p < 0.05). However, LA does not differ statistically from the I (p > 0.05), nor the BM from LA and BL (p > 0.05) and ME from CE and CO.
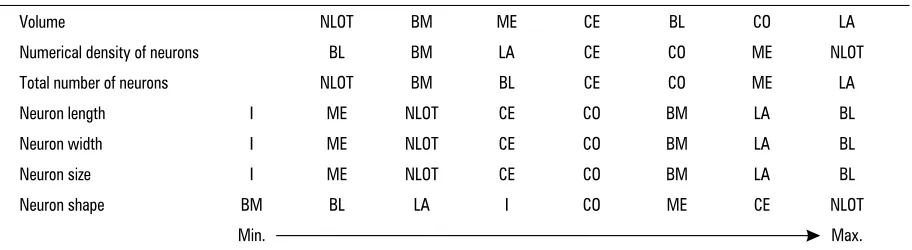
To summarise the data presented in this study the nuclei series of the guinea pig CA have been pre-sented according to the increasing values of the morphometric parameters (Table 3).
DISCUSSION
This is the first investigation that provides a de-tailed morphometric analysis of the 8 nuclei in the guinea pig CA. To our knowledge, no morphometric data have been available to date concerning the vol-umes of the various amygdaloid regions and the
Table 1. The morphometric parameters of the individual amygdaloid nuclei of the guinea pig CA
Nucleus Volume Percentage of volume Numerical density Total number of neurons Percentage of neurons
[mm3] (%) [N/mm3] [N] (%)
LA 2.76 ± 0.33 27.9 ± 1.1 75081.79 ± 1937.53 207182.5 ± 21766.86 24.31 ± 1.2
BL 1.53 ± 0.19 15.48 ± 0.97 49678.22 ± 1281.97 76092.36 ± 9393.15 8.93 ± 0.76
BM 0.96 ± 0.1 9.68 ± 0.17 66600.23 ± 1718.65 63752.51 ± 6425.22 7.48 ± 0.23
CE 1.4 ± 0.11 14.13 ± 0.68 90428.49 ± 2333.56 127667.8 ± 9853.41 15.01 ± 0.84
CO 1.7 ± 0.16 17.2 ± 0.62 91527.05 ± 2074.29 154063.7 ± 18224.75 18.06 ± 0.87
ME 1.28 ± 0.08 13.04 ± 0.93 144431 ± 3727.12 185700.3 ± 16336.36 21.84 ± 1.48
NLOT 0.25 ± 0.02 2.57 ± 0.14 146480.5 ± 3999.94 37076.39 ± 1887.17 4.36 ± 0.17
CA 9.89 ± 0.88 100 ± 0 94889.62 ± 804.13 851535.6 ± 69593.96 100 ± 0
Table 2. Morphometric parameters of the neurons in the individual amygdaloid nuclei of the guinea pig CA
Nucleus Neuron length Neuron width Neuron size Neuron shape
[µm] [µm] [µm]
LA 15.75 ± 0.34 11.25 ± 0.67 27 ± 0.99 1.4 ± 0.05
BL 17.41 ± 0.39 12.59 ± 0.48 30 ± 0.85 1.38 ± 0.02
BM 15.21 ± 0.21 11.13 ± 0.25 26.34 ± 0.46 1.37 ± 0.02
CE 14.44 ± 0.57 9.44 ± 0.16 23.87 ± 0.48 1.53 ± 0.09
CO 14.56 ± 0.25 9.79 ± 0.39 24.36 ± 0.62 1.49 ± 0.05
I 10.51 ± 0.18 7.37 ± 0.34 17.88 ± 0.44 1.43 ± 0.07
ME 12.4 ± 0.18 8.27 ± 0.71 20.67 ± 0.85 1.5 ± 0.11
NLOT 14.19 ± 0.85 8.44 ± 0.34 22.64 ± 1.17 1.68 ± 0.02
number, density and size of the neurons in the guinea pig CA.
Volume. All the nuclei observed in the guinea pig CA in the present study have also been described in the common shrew [46], mole [16], rat [21, 42], gerbil [49], guinea pig [15] rabbit [9, 14, 57], cat [17, 21, 40], dog [36], porpoise [4], bat [13], tree shrew [10], monkey [41, 50, 52, 54] and in humans [3, 7]. Moreover, the general morphology of these dif-ferent amygdaloid regions in the guinea pig CA and their parcellation into finer parts are most similar to those found by Krettek and Price [21] in the rat. On the other hand, there are some peculiar features in the size and in the degree of differentiation of the different nuclei in the guinea pig CA when they are compared to their counterparts in the other species. Attention is drawn to some of these peculiarities.
The volumetric comparisons of the 3 parts of the CA (basolateral, central and corticomedial) as they were defined in the common shrew [46] and guinea pig (present results) indicate the substantial progres-sion of the basolateral region in the guinea pig’s CA, whereas the central and corticomedial areas in this species have undergone a reduction, more or less marked. For example, the volume of the BLC increases from an average of 38.66% in the common shrew to 53.06% in the guinea pig, CC undergoes mild size regression from an average of 17.97% to 14.13%, while the volume of CMC is markedly reduced from 43.37% to 32.81%. The data for the common shrew are those previously reported by us [46]. It should be noted that the substantial enlargement of BLC in the guinea pig CA follows from LA and BM size pro-gression, since BL is notably reduced in this species (compare the present results and 46]. On the other hand, the decline of CMC area in the guinea pig CA is caused, first of all, by the strong regression of NLOT. In both species ME and CO demonstrate only mild reduction and seem to be fairly consistent in
their proportionate size (compare the present results and 46].
In the dog CA BLC is even larger than in the guinea pig CA, whereas CC and CMC demonstrate further marked reduction (compare the present re-sults and 36). Moreover, LA occupies proportionate-ly a much larger part of the dog CA in comparison with that of the guinea pig, whereas CE, ME and NLOT display further strong regression in this spe-cies. Since BL and BM were incorporated by Maksy-mowicz [36] into a single structure, there is no pos-sibility of evaluating the differences in size between the species. Interestingly, CO in both these species seems to be fairly constant in its proportionate size. When the CA of the guinea pig is compared with that of the macaque [54], the size progression of BLC in the latter is obvious, whereas CC and CMC are even smaller than in the dog (compare 36 and 54). BLC size progression, noted in the macaque, is espe-cially due to huge LA enlargement, although BL and BM also seem to be well developed in CA of this spe-cies [54]. On the other hand, CE as well as CO, ME and NLOT are considerably smaller than in the guinea pig CA, causing CC and CMC size regression (compare the present results and 54). It should be noted that CE, CO and NLOT are even smaller than in the dog (for com-parisons see 36 and 54).
According to Stephan et al. [52] the size progres-sion of the basolateral region of CA seems to reach its peak in humans, which corresponds well with the scheme of CA evolution presented above. However, direct comparisons between guinea pigs and humans are difficult to perform because there are no volu-metric data concerning individual CA nuclei in the latter [52]. Moreover, the basolateral region in the work of Stephan et al. [52] was incorporated into CO. To summarise, all these data when taken togeth-er, support the general impression reported by Cros-by and Humphrey [8] that “the lateral, basal and
Table 3. The guinea pig CA nuclei series according to the increasing values of the morphometric parameters
Volume NLOT BM ME CE BL CO LA
Numerical density of neurons BL BM LA CE CO ME NLOT
Total number of neurons NLOT BM BL CE CO ME LA
Neuron length I ME NLOT CE CO BM LA BL
Neuron width I ME NLOT CE CO BM LA BL
Neuron size I ME NLOT CE CO BM LA BL
Neuron shape BM BL LA I CO ME CE NLOT
accessory basal nuclei occupy proportionately a much larger part of the human amygdaloid area. On the contrary the medial nucleus and nucleus of the lat-eral olfactory tract are relatively considerably reduced in man”. CE and CO are fairly constant in their pro-portionate size in the shrew and in humans accord-ing to these authors [8].
Numerical density. Comparison of the density of neurons in the guinea pig CA with that in the common shrew [46] revealed a substantial decrease in cellular density in the former. The average density of neurons in the guinea pig CA is approximately only 2/5 that of the common shrew. The density de-crease is greater in the basolateral nuclei than in the corticomedial amygdaloid regions. The phenomenon of the negative correlation between the size of the brain structure and the density of cells in it has pre-viously been described by Morgane et al. [37] in the limbic cortex of several Cetacean species and by Ko-wiańska [20] in the claustra of various mammals. Interestingly, the pattern of density value distribu-tion in the guinea pig CA seems to be very conserva-tive, since it is almost identical with that found in the common shrew [46]. In the guinea pig CA, for example, the nuclei seriate, according to the increas-ing values of cell density, displays the followincreas-ing ar-rangement: BL, BM, LA, CE, CO, ME, NLOT. In the common shrew this arrangement is as follows: BL, BM, LA, CE, CO, NLOT, ME [46]. Moreover, in both these species LA, BL and BM form cellular regions in the CA characterised by density values significantly lower than the mean density of cells in CA. The ME and NLOT, in contrast, represent densely organised amygdaloid areas where the densities of the neu-rons are significantly higher than the mean. The den-sities of cells in CE and CO in CA of the guinea pig and common shrew lie between those of the two previously mentioned regions.
The total number of neurons. In spite of the substantial decrease in the density of neurons in the nuclei of the guinea pig CA, the total number of cells in each is greater and significantly higher than in their counterparts in the common shrew [46]. The average size of the cellular population in the guinea pig CA is about 5.3 times larger than that in CA of the common shrew [46]. It should be noted that the neuronal population size increases in the individual CA nuclei differ significantly, as shown by the per-centages of cells in each in relation to the total CA. Since the numbers of neurons in the individual CA nuclei are the products of two simultaneously oc-curring processes (the volume increase of the
and this phenomenon also seems to be present in the guinea pig CA.
Functional remarks. Since according to Stephan et al. [51] “the comparative neuroanatomical inves-tigations have demonstrated that the size of given brain structure is highly interrelated with the func-tional requirements of its habits” the question arises as to what the functional consequences are of the way in which CA is organised in the guinea pig?
LA is the major input region for the sensory re-lated thalamic and cortical inputs directed to CA and projects back to these areas as well [21, 33, 42, 53]. It appears to be the major site of convergence of all non-olfactory sensory modalities, the visual [25, 31], auditory [22, 24, 25, 29, 45] and somatosensory [23, 25, 55]. The BM, which also has strong interrelation-ships with the sensory related thalamic and cortical areas [6, 23, 42], seems to be more related to the contextual information [25, 27, 28]. Since both these nuclei are much better developed in the guinea pig CA in comparison with that of the common shrew [46], it is reasonable to state that non-olfactory in-formation processed by the cortex becomes more widely represented inside CA of this species. These circumstances may therefore suggest that CA of the guinea pig is probably less influenced by olfaction. That seems not to be the case. ME and CO, which include the secondary olfactory and vomeronasal areas [18, 19, 53], have in fact undergone only a slight reduction in size in the guinea pig CA in com-parison with the common shrew, so that olfaction would still appear to be very important in CA of this species. On the other hand, the sharp reduction in NLOT indicates that some olfactory regions, at least, are less important in the guinea pig CA.
REFERENCES
1. Berdel B, Moryś J, Maciejewska B, Dziewiątkowski J (1997) Volume and topographical changes of the ba-solateral complex during the development of the rat’s amygdaloid body. Folia Morphol, 56: 1–11.
2. Bookstein FL (1986) Size and shape spaces for land-mark data in two dimensions. Statistical Scie, 1: 181–222.
3. Braak H, Braak E (1983) Neuronal types in the basolateral amygdaloid nuclei of man. Brain Res Bull, 11: 349–365. 4. Breathnach AS, Goldby F (1954) The amygdaloid nuclei,
hippocampus and other parts of rhinencephalon in the porpoise (Phocaena phocaena). J Anat, 88: 267–291. 5. Caffe AR, van Leeuwen FW, Luiten PG (1987)
Vaso-pressin cells in the medial amygdala of the rat project to the lateral septum and ventral hippocampus. J Comp Neurol, 261: 237–252.
6. Canteras NS, Swanson LW (1992) Projections of the ventral subiculum to the amygdala, septum and
hy-pothalamus: A PHAL anterograde track-tracing study in the rat. J Comp Neurol, 324: 180–194.
7. Crosby EC, Humphrey T (1941) Studies on the verte-brate telencephalon. II. The nuclear pattern of olfactory nucleus, tuberculum olfactorium and the amygdaloid complex in adult man. J Comp Neurol, 74: 309–352. 8. Crosby EC, Humphrey T (1944) Studies on the
verte-brate telencephalon. III. The amygdaloid complex in the shrew (Blarina brevicauda). J Comp Neurol, 81: 285–305.
9. Dziewiątkowski J, Berdel B, Kowiański P, Kubasik--Juraniec J, Bobek-Bilewicz B, Moryś J (1998) The amygdaloid body of the rabbit — a morphometric study using image analyser. Folia Morphol, 57: 93–103. 10. Flugge G, Ahrens O, Fuchs E (1994) Monoamine
re-ceptors in the amygdaloid complex of the tree shrew (Tupaia belangeri). J Comp Neurol, 343: 597–608. 11. Gower JC (1975) Generalized Procrustes analysis.
Psy-chometrika, 40: 33–51.
12. Gundersen HJG, Jensen EB (1987) The efficiency of systematic sampling in stereology and its prediction. J Microsc, 147: 229–263.
13. Humphrey T (1936) The telencephalon of the bat. I. The non-cortical nuclear masses and certain pertiment fiber connections. J Comp Neurol, 65: 603–711. 14. Jagalska-Majewska H, Dziewiątkowski J, Wójcik S,
Luczyńska A, Kurlapska R, Moryś J (2001) The amygda-loid complex of the rabbit — a morphological and his-tochemical study. Folia Morphol, 60: 259–280. 15. Johnson TN (1957a) Studies on the brain of a guinea
pig. I. The nuclear pattern of certain basal telencepha-lic centers. J Comp Neurol, 107: 353–477.
16. Johnson TN (1957b) The olfactory centers and connec-tions in the cerebral hemisphere of the mole (Scalonus aquaticus machrinus). J Comp Neurol, 107: 379–425. 17. Kamal AM, Tombol T (1975) Golgi studies on the
amygda-loid nuclei of the cat. J Hirnforsch, 16: 175–201. 18. Kevetter GA, Winans SS (1981) Connections of the
Corticomedial Amygdala in the Golden Hamster. I. Efferents of the “Vomeronasal Amygdala”. J Comp Neurol, 197: 81–98.
19. Kevetter GA, Winans SS (1981) Connections of the Corticomedial Amygdala in the Golden Hamster. II. Efferents of the “Olfactory Amygdala”. J Comp Neurol, 197: 99–111.
20. Kowiańska J (1997) Anatomia porównawcza przed-murza wybranych gatunków ssaków. PhD Thesis, Medical University, Gdańsk, pp. 1–107.
21. Krettek JE, Price JL (1978b) A description of the amygdaloid complex in the rat and cat with observa-tions on intra-amygdaloid axonal connecobserva-tions. J Comp Neurol, 178: 255–280.
22. LeDoux JE, Farb C, Ruggiero DA (1990b) Topographic organization of neurons in the acoustic thalamus that project to the amygdala. J Neurosci, 10: 1043– –1054.
23. LeDoux JE, Cicchetti P, Xagoranis A, Romanski LM (1990a) The lateral amygdaloid nucleus: sensory in-terface of the amygdala in fear conditioning. J Neuro-sci, 10: 1062–1069.
audi-tory processing areas of the thalamus and cortex. Neu-rosci Lett, 134: 139–144.
25. LeDoux JE (2000) Emotion circuits in the brain. Annu Rev Neurosci, 23: 155–184.
26. Mayhew TM (1992) A review of recent advances in stereology for quantifying neural structures. J Neuro-cytol, 21: 313–328.
27. Majidishad P, Pelli DG, LeDoux JE (1996) Disruption of fear conditioning to contextual stimuli but not to a tone by lesions of the accessory basal nucleus of the amygdala. Soc. Neurosci. Abstr. 22: 1116.
28. Maren S, Fanselow MS (1995) Synaptic plasticity in the basolateral amygdala induced by hippocampal formation stimulation in vivo. J Neurosci, 15: 7548– –7564.
29. Mascagni F, McDonald AJ, Coleman JR (1993) Corti-coamygdaloid and corticocortical projections of the rat temporal cortex: a Phaseolus vulgaris leucoagglu-tinin study. Neuroscience, 57: 697–715.
30. McDonald AJ (1985) Morphology of peptide-contain-ing neurons in the rat basolateral amygdaloid nucle-us. Brain Res, 338: 186–191.
31. McDonald AJ, Jackson TR (1987) Amygdaloid connec-tions with posterior insular and temporal cortical areas in the rat. J Comp Neurol, 262: 59–77.
32. McDonald AJ, Pearson JC (1989) Coexistence of GABA and peptide immunoreactivity in non-pyramidal neu-rons of the basolateral amygdala. Neurosci. Lett, 100: 53–58.
33. McDonald AJ, Mascagni F, Guo L (1996) Projections of the medial and lateral prefrontal cortices to the amygdala: A Phaselous vulgaris leucoaggulutinin study in the rat. Neuroscience, 71: 55–75.
34. Mcdonald AJ (1996) Glutamate and aspartate immu-noreactive neurons of the rat basolateral amygdala: colocalization of excitatory amino acids and projections to the limbic circuit. J Comp Neurol, 365: 367–379. 35. McDonald AJ, Mascagni F (2001) Colocalization of
cal-cium-binding proteins and GABA in neurons of the rat basolateral amygdala. Neuroscience, 105: 681–693. 36. Maksymowicz K (1963) Amygdaloid complex of the
dog. Acta Biol. exp. Vars, 23: 63–73.
37. Morgane PJ, McFarland WL, Jacobs MS (1982) The lim-bic lobe of the Dolphin brain: A quantitative cytoar-chitectonic study. J. Hirnforsch, 23: 465–552. 38. Moga MM, Gray TS (1985) Peptidergic efferents from
the intercalated nuclei of the amygdala to the parabra-chial nucleus in the rat. Neurosci Lett, 61: 13–18. 39. Moryś J, Berdel B, Jagalska-Majewska H, Luczynska A
(1999) The basolateral amygdaloid complex — its de-velopment, morphology and functions. Folia Morphol, 58: 29–46.
40. Pare D, Smith Y (1993) Distribution of GABA immu-noreactivity in the amygdaloid complex of the cat. Neuroscience, 57: 1061–1076.
41. Pitkänen A, Amaral DG (1994) The distribution of GABA-ergic cells, fibers, and terminals in the monkey amygdaloid complex: An immunohistochemical and in situ hybridization study. J Neurosci, 14: 2200–2224. 42. Pitkänen A, Jolkkonen E, Kemppainen S (2000) Ana-tomical heterogeneity of the rat amygdaloid complex. Folia Morphol, 59: 1–23.
43. Rohlf FJ, Slice DE (1990) Extensions of the Procrustes method for the optimal superimposition of landmarks. Systematic Zool, 39: 40–59.
44. Rohlf FJ (1999) Shape statistics: Procrustes superim-positions and tangent spaces. J Classification, 16: 197–223.
45. Romanski LM, LeDoux JE (1993) Information cascade from primary auditory cortex to the amygdala: Corti-cocortical and corticoamygdaloid projections of tem-poral cortex in the rat. Cereb Cortex, 3: 515–532. 46. Równiak M, Szteyn S, Robak A (2004) The
morpho-metric study of the amygdala in the common shrew. Folia Morphol, 63: 165–176.
47. Równiak M (2002) Cytoarchitektonika i analiza jąder ciała migdałowatego u wybranych gatunków ssaków łożyskowych. PhD Thesis, Medical University of Gdańsk, pp. 1–95.
48. Salmenperä T, Kälviäinen R, Partanen K (2000) MRI volumetry of the hippocampus, amygdala, entorhinal cortex, and perirhinal cortex after status epilepticus. Epilepsy Res, 40: 155–170.
49. Salter CF (1975) A morphological study of the lateral olfactory areas of the telencephalon in the Mongolian Gerbil, Meriones unguiculatus. J Hirnforsh, 16: 223–244.
50. Stephan H, Andy OJ (1977) Quantitative comparisons of the amygdala in insectivores and primates Acta Anat, 98: 130–153
51. Stephan H, Frahm H, Baron G (1981a) New and re-vised data on volumes of brain structures in insecti-vores and primates Folia Primatol, 35: 1–29
52. Stephan H, Frahm H, Baron G (1987) Comparisons of brain structure volumes in insectivora and primates. VII Amygdaloid body J Hirnforsh, 28: 571–584 53. Swanson LW, Petrovich GD (1998) What is the amygdala?
Trends Neurosci, 21: 323–31.
54. Śmiałowski A (1965) Amygdaloid complex of the macaque. Acta Biol. Exp Vars, 25: 77–89.
55. Turner BH, Zimmer J (1984) The architecture and some of the interconnections of the rat’s amygdala and la-teral periallocortex. J Comp Neurol, 227: 540–557. 56. West MJ, Gundersen HJG (1990) Unbiased
sterologi-cal estimation of the number of neurons in the hu-man hippocampus. J Comp Neurol, 296: 1–22. 57. Young MW (1936) The nuclear pattern and fiber