FRANK B. FEIGERT is retired regents professor of Political Science at the University of North Texas; DAWN MILLER is a doctoral candidate at Pennsylvania State University; KENDA CUN-NINGHAM is teaching in Georgia; RACHEL BURLAGE is a masters candidate at the University of North Texas. Special thanks go to Cece Hannah, Fran Feigert, and Brandy Grey for their assistance in data collection.
The American Review of Politics, Vol. 24, Summer, 2003: 183-196 ©2003 The American Review of Politics
Texas: Incipient Polarization?
Frank B. Feigert, Dawn Miller, Kenda Cunningham, and Rachel Burlage
Population changes are leading Texas to becoming a majority-minority state, especially with the increase of Hispanics. Texas has become a GOP stronghold, and the GOP is increasingly cohesive, and conservative, winning all statewide offices in both 1998 and 2002, plus control of the legislature in 2002. Religious fundamentalism is clearly evident in the GOP, but many distance themselves from the Christian right. Ideological differences between the parties have increased, largely because Democrats are more liberal. GOP activists are upbeat, while Democrats appear dis-pirited, although less so than in 1991.
Introduction
The 1990s were a decade of great success for Texas Republicans. At the start of the decade, Democrats controlled the governorship, a substantial majority of the state legislative seats, one of the two U.S. Senate seats, and 70 percent of the U.S. House seats. By the end of the decade, Republicans held the governorship, one of two houses of the state legislature, both U.S. Senate seats, and nearly one-half of the U.S. House seats. This major change in Texas politics, which had begun earlier, affected the political party organizations in the state, including the grassroots organizations. The acti-vists who were leaders in the county party organizations were surveyed in 1991 and 2001, and the data reveal changes in their behavior and attitudes, changes that may both reflect the electoral trends of that time period and have contributed to the trends.
Continuing Contextual Change
The Population Context
second largest state, at 20.8 million, with 91 percent in urban areas. Signifi-cant changes have also taken place in the ethnic composition of the state. The Anglo population in 1980 comprised 78.7 percent; in 1990 it was 75.2 percent; and by 2000 it was 52.4 percent. African-Americans in 1980 were 12.0 percent, but by 2000 they had dropped to 11.5 percent. The change in the Hispanic population was the most notable, growing from 21 percent in 1980 to 26 percent in 1990. By 2000 they were at 32 percent,“projected to become an absolute majority within the next quarter-century” (Martinez 2002). In short, by this latest census, Texas was on the verge of becoming a majority-minority state.
The Political Context
Once a stalwart of the Democratic Solid South, Texas has been slowly changing to becoming a major Republican stronghold not only in the South, but for the entire nation as well. The nominal start of this transformation can be readily attributed to the 1961 “Tower Election,” when John Tower won the Senate seat vacated by Lyndon Johnson on winning the vice presidency a year earlier. With his election, Tower legitimized the idea of Republicans being electorally viable, and certainly at least as conservative as Democrats, who were increasingly identified with their more liberal brethren elsewhere. This election caught the state Democratic Party completely “unprepared to respond effectively,” as the party coffers were empty and it was in debt (Posler and Ward 1997, 312).
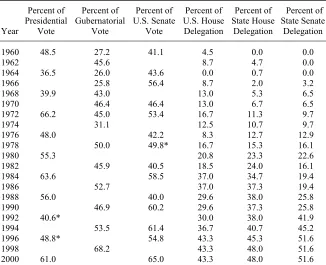
Table 1. Republican Strength in Texas, 1960-2000
Percent of Percent of Percent of Percent of Percent of Percent of
Presidential Gubernatorial U.S. Senate U.S. House State House State Senate
Year Vote Vote Vote Delegation Delegation Delegation
1960 48.5 27.2 41.1 4.5 0.0 0.0
1962 45.6 8.7 4.7 0.0
1964 36.5 26.0 43.6 0.0 0.7 0.0
1966 25.8 56.4 8.7 2.0 3.2
1968 39.9 43.0 13.0 5.3 6.5
1970 46.4 46.4 13.0 6.7 6.5
1972 66.2 45.0 53.4 16.7 11.3 9.7
1974 31.1 12.5 10.7 9.7
1976 48.0 42.2 8.3 12.7 12.9
1978 50.0 49.8* 16.7 15.3 16.1
1980 55.3 20.8 23.3 22.6
1982 45.9 40.5 18.5 24.0 16.1
1984 63.6 58.5 37.0 34.7 19.4
1986 52.7 37.0 37.3 19.4
1988 56.0 40.0 29.6 38.0 25.8
1990 46.9 60.2 29.6 37.3 25.8
1992 40.6* 30.0 38.0 41.9
1994 53.5 61.4 36.7 40.7 45.2
1996 48.8* 54.8 43.3 45.3 51.6
1998 68.2 43.3 48.0 51.6
2000 61.0 65.0 43.3 48.0 51.6
Notes: *Won, despite absence of majority. In 1992, Republican George Bush won the state with 52.1 percent of the two-party vote. In 1996, Republican Robert Dole won the state with 51.2 percent of the two-party vote. The last three columns give the percent Republican following the specified election (e.g., after the 1994 election, Republicans held 45.2 percent of the state senate seats). Sources: America Votes (Washington, DC: Congressional Quarterly, 1960-1990) and Statistical Ab-stract of the United States (Washington, DC: Government Printing Office, 1960-1992), various edi-tions. The 1992-2000 figures were provided by the Texas Secretary of State.
Further setting the stage for GOP dominance over Texas politics, the first Republican governor since Reconstruction was elected in 1978 and, after some alternation, this office was captured by George W. Bush in 1994 with 53.5 percent, beating the popular incumbent Ann Richards. That she was defeated in the same month that she had a 61 percent public approval rating may say something either about the nature of party organization or about personality politics. Reelected in 1998 with a smashing majority of 68 percent, Bush’s coattails proved quite long, as Republicans held every statewide elective office.
winning 41 percent of its vote in the 1992 presidential election and 56 per-cent in 1988. It then helped send his son, George W. Bush, to the White House, with 59 percent of the vote. The GOP also held both Senate seats, was the locus of significant power in the House, and was tightening its grip on state politics as well.
The Status of Party Organization
Given this background, one might expect the state Democratic party organization to be disheartened if not moribund, but this was far from the case. In a very real sense, it had no place to go but up. And, to some extent, they were helped by the inevitable passage of time. Senator Gramm an-nounced in September, 2001 that he would not seek reelection. He was joined in this three months later by Majority Leader Armey. While Armey’s seat was safe Republican, Gramm’s retirement set off a flurry in the Demo-cratic Party. The next year, 2002, offered a window of opportunity for the Democrats that they had not expected so soon. The incumbent Governor, Rick Perry, had succeeded to office when Bush was elected President. Lack-ing the visibility of his predecessor, he was seen as vulnerable. Millionaire Tony Sanchez quickly emerged as the leading Democratic candidate, and the state party all but embraced him as their choice in the primary, which he went on to win in March, 2002. That he had contributed $300,000 to George Bush’s earlier campaigns (Martinez 2002) did not seem to hinder his candi-dacy, perhaps because this was seen as a chance that he might appeal to GOP voters. The possibility of a “rainbow” or “dream team” ticket was raised by party officials, as Dallas Mayor Ron Kirk, an African-American, won the senatorial primary in April, 2002. Kirk was regarded as the GOP’s favorite Democrat, as he had been a pro-business office-holder. The winner of this primary was to face the former state Attorney-General, John Cornyn, who was also seen as vulnerable by the Democrats.
state government. This was the first time since Reconstruction that Republi-cans held such control. If this left the GOP in charge, it also put the onus of governance on them, as they had to deal with a two-year projected budgetary shortfall in the neighborhood of $10 billion. In a state that is proud to have no income taxes, they were faced with how to cut state services and improve revenue, a bitter pill to swallow.
Texas may be somewhat unique, inasmuch as, at the time of the survey, both of its major party chairs are women. Although each was the first woman elected to this post within her party, there is little else in common between them. After long-time incumbent Bob Slagle was forced to step down in 1995 (Posler and Ward 1997, 314), following Bush’s first guberna-torial victory, Molly Beth Malcolm, a former Republican and public school teacher, was elected Democratic Party state chair in 1998. A tireless worker, she publicized the progressive achievements of her party and worked at fund-raising and publicizing the party in a manner that had not been seen by Democrats in many years. However, as we have seen, this met with little or no electoral success, and she was unsuccessfully pressured to step down in the post-election period.
Her opposite number, Susan Weddington, was elected in 1997. Identi-fying with the pro-life faction, she came from the more conservative wing of her party. Thus, she faced the difficulties of dealing with success. First, hav-ing helped the party to a position of total dominance in the executive branch of Texas government, she had to defend those seats. Also, she was faced with the inevitable factionalism that can arise as a party becomes so domi-nant that multiple candidates are inevitably attracted to the leading party’s label. As an example, within weeks of Majority Leader Armey’s announce-ment, there were six GOP contenders for his seat. Where the Republicans once had trouble filling their slate with nominees, there now seemed to be an abundance of candidates for many slots. Factionalism of a personalistic nature also emerged within the GOP following their sweep of statewide offices in the 2002 elections, in terms of who was to blame for the budget crisis alluded to above.
Both parties have made major strides at the state level in terms of cam-paigning. Republicans employ sophisticated phone bank technologies that enable them to provide important information to candidates, local organiza-tions, and voters at lower cost. The Democrats have new systems on-line that allow them secure communications between all levels of the party, and extensive voter files are maintained to enable better targeting of campaigns at all levels (Posler and Ward 1997, 314).
At the state level, the GOP website, TexasGOP.org, was named the best state party website for two years in a row by Campaigns and Elections
section titled ‘Grassroots Growth’ that instructs people how to raise money, turn out voters, start their own auxiliary GOP chapter, donate, volunteer or register to vote” (Republican Party 2002). This can be taken as a measure of the technical sophistication one of the two parties has achieved. At a lower level, this emphasis on technology is reflected in the presence, if not always great sophistication, of web pages for numerous county organizations in both parties.
The Texas Activists
We now examine our data on Texas grassroots party activists, with a focus on the changes that have taken place both within each party and be-tween the parties, from the time of our first survey in 1991 to the more recent 2001 study.
Social Characteristics
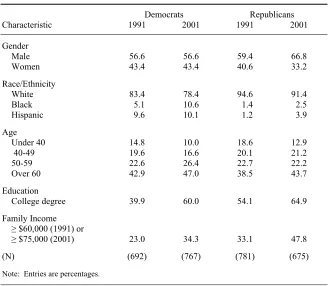
Despite the presence of women at the head of each state party, there is a notable drop of women in our total sample, as shown in Table 2. In the Democratic Party, running counter to the trend, 37 percent of the county chairs are women, a slight increase since 1991. However, the proportion of women party activists has fallen in the other three categories—Democratic members, Republican chairs, and, most notably, GOP members. While these differences are not especially large, they run counter to the generally in-creased activism of women at other levels in politics, and we see no easy answer as to why this is so. However, if this is not idiosyncratic, there is a danger that the grass roots of both state parties could be on the threshold of returning to a “good old boys” club of exclusivity. Certainly, it suggests that neither party has been especially effective at recruiting or retaining women.
Table 2. Demographic Characteristics of Texas Party Activists, 1991 and 2001
Democrats Republicans
Characteristic 1991 2001 1991 2001
Gender
Male 56.6 56.6 59.4 66.8
Women 43.4 43.4 40.6 33.2
Race/Ethnicity
White 83.4 78.4 94.6 91.4
Black 5.1 10.6 1.4 2.5
Hispanic 9.6 10.1 1.2 3.9
Age
Under 40 14.8 10.0 18.6 12.9
40-49 19.6 16.6 20.1 21.2
50-59 22.6 26.4 22.7 22.2
Over 60 42.9 47.0 38.5 43.7
Education
College degree 39.9 60.0 54.1 64.9
Family Income
≥ $60,000 (1991) or
≥$75,000 (2001) 23.0 34.3 33.1 47.8
(N) (692) (767) (781) (675)
Note: Entries are percentages.
The educational level in both parties shows a marked increase over the 10 year period. Those with a high school degree or less have gone from 15 percent to 6 percent. At the opposite end of the scale, the proportion with a graduate degree has increased from 26 percent to 35 percent. Given that Texas is a state where significant emphasis is placed on public versus private college education, this may reflect the efforts of the state to achieve higher graduation rates at all levels, particularly at the college or university levels.
usual finding that Republican activists are much more likely to be in the highest category.
Our report on the 1991 sample concluded, in regard to social character-istics, that “. . . our samples reflect earlier findings of higher status for politi-cal activists at the precinct and higher levels,” which is consistent with ear-lier research (Conway and Feigert 1968; Cotter et al. 1984). We also wrote that in 1991 “Texas party activists are fairly described as white, Protestant, well-educated, of high income. . . . Age and gender differences are insignifi-cant, suggesting that for Texas at least, party activity is not simply a place for older white males” (Feigert and McWilliams 1995, 80). Essentially, the same analysis holds, with the notable exceptions of declining female but increased minority participation in county and local parties.
Religion and Intra-Party Factionalism
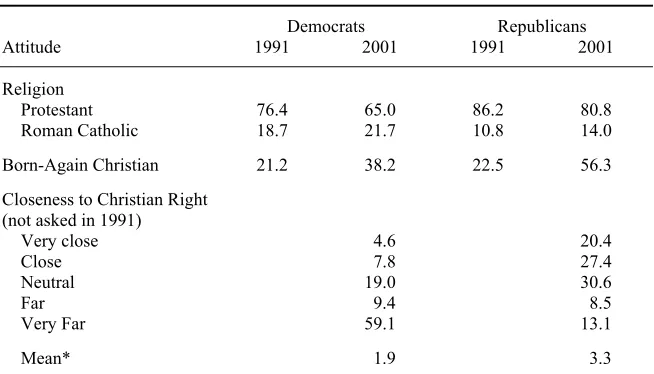
Texas activists continue to reflect a Protestant domination (Table 3), although less so than in 1991, when 81.6 percent were adherents of a Pro-testant faith. As before, this is more likely the case for Republicans, although they show a slight decline of roughly 5 percent in this regard. Increases of a marginal nature are noted for Roman Catholics and Jews. Democratic
Table 3. Religion and Related Attitudes of Texas Party Activists, 1991 and 2001
Democrats Republicans
Attitude 1991 2001 1991 2001
Religion
Protestant 76.4 65.0 86.2 80.8
Roman Catholic 18.7 21.7 10.8 14.0
Born-Again Christian 21.2 38.2 22.5 56.3
Closeness to Christian Right (not asked in 1991)
Very close 4.6 20.4
Close 7.8 27.4
Neutral 19.0 30.6
Far 9.4 8.5
Very Far 59.1 13.1
Mean* 1.9 3.3
activists are more likely to claim “other” or “none” than are Republicans, but this is still less than 10 percent. Differences in terms of Protestant affiliation are more striking when we probe for measures that are more likely to be reflected in politics. While the concept of “born-again Christian” is often associated in the popular mind with Republicans, more than 20 percent of the 1991 Democratic sample professed to be born-again Christians, scarcely less than the Republicans. Ten years later this had increased to more than 38 percent. An even more significant change took place among Republicans, in that more than 56 percent now identify themselves as “born-again.” This change might simply be dismissed as an artifact of the expansion of religious fundamentalism throughout Texas, the South, or the nation for that matter. However, it is reflected in another and perhaps more politically relevant sense when we examine adherence to the Christian Right. While we did not ask that question in 1991, the 2001 results are revealing, if not unexpected. Certainly, there are and always have been conservative strands among Texas Democrats, as there have been among Republicans. What is compelling are the differences between the two parties. Moreover, while almost half of the GOP activists identify themselves as “close” or “very close” to the Christian Right, about one-fifth say that they are “far” or “very far” from this move-ment.
Inter-Party Issue and Ideological Differences
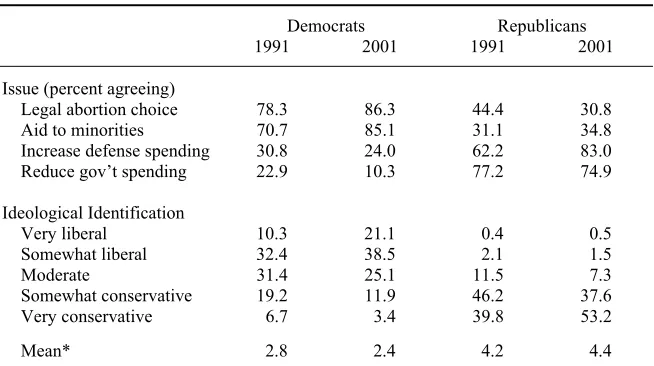
The extent to which issue and ideological differences exist between and within parties is shown in Table 4. That there are differences between the parties comes as no surprise, although there is a widely held view that both parties are dominated by conservatives. In our sample of activists, the differ-ences on specific issues are profound, and increasingly so. For example, while Democrats are normally identified as the “pro-choice” party, they increased their support of this position from 78 percent in 1991 to 86 percent in 2001. Republican activists decreased their support from 44 percent to 31 percent. Substantial differences exist over time within and between the parties on the question of government aid to minorities as well. Democrats are even more likely now to favor such programs than they were in 1991. While there has been some slow acceptance of this within the GOP, such that more than a third are supportive of these programs, the difference be-tween the two parties increased from 1991 to 2001.
On two issues dealing with government spending, the differences have also increased substantially. Democrats were slightly less likely to support increases in defense spending than they had been ten years earlier. But, GOP activists are much more likely to favor such increases. Hence, the gap be-tween the two parties has widened considerably. On the more general issue
Table 4. Issues and Ideological Orientations of Texas Party Activists, 1991 and 2001
Democrats Republicans
1991 2001 1991 2001
Issue (percent agreeing)
Legal abortion choice 78.3 86.3 44.4 30.8
Aid to minorities 70.7 85.1 31.1 34.8
Increase defense spending 30.8 24.0 62.2 83.0
Reduce gov’t spending 22.9 10.3 77.2 74.9
Ideological Identification
Very liberal 10.3 21.1 0.4 0.5
Somewhat liberal 32.4 38.5 2.1 1.5
Moderate 31.4 25.1 11.5 7.3
Somewhat conservative 19.2 11.9 46.2 37.6
Very conservative 6.7 3.4 39.8 53.2
Mean* 2.8 2.4 4.2 4.4
of reducing government spending, about 10 percent of Democrats favor this, while almost three-quarters of Republicans take this position. The difference between the parties in 2001 is the greatest of the four issues we examined.
These differences are reflected in underlying ideological orientations. If there is a middle ground among party workers, it has been among Demo-crats, but this is down from 31 percent in 1991 to 25 percent in 2001. If anything, the differences between the parties at the grassroots level are ap-proaching polarization. In 2001, 43 percent of Democrats described them-selves as “somewhat” or “very” liberal. By 2001, this had increased to 60 percent. On the other hand, 86 percent of Republicans were self-described conservatives in 1991, but this increased to 91 percent ten years later. Each party moved somewhat toward the poles over 10 years. The difference was more pronounced among Democrats, who clearly rejected, for themselves at least, the centrist position adopted by former President Clinton. On the other hand, there is not much room for the GOP to move toward the right, given the substantial proportion taking a “very conservative” position. Polarization has established itself at the grassroots level in Texas. It remains to be seen if this is reflected in the parties in government as well as the electorate.
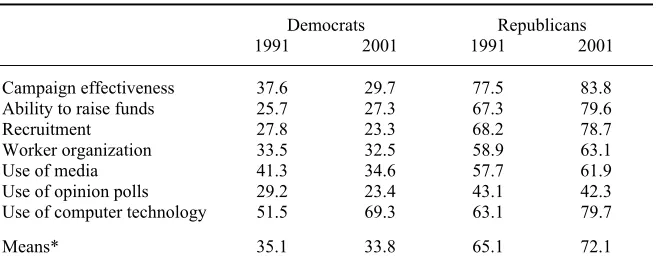
Perceptions of Organizational Vitality
Table 5. Perceptions of Organizational Vitality Among Texas Party Activists, 1991 and 2001
Democrats Republicans
1991 2001 1991 2001
Campaign effectiveness 37.6 29.7 77.5 83.8
Ability to raise funds 25.7 27.3 67.3 79.6
Recruitment 27.8 23.3 68.2 78.7
Worker organization 33.5 32.5 58.9 63.1
Use of media 41.3 34.6 57.7 61.9
Use of opinion polls 29.2 23.4 43.1 42.3
Use of computer technology 51.5 69.3 63.1 79.7
Means* 35.1 33.8 65.1 72.1
Note: Entries are the percent who reported significantly stronger (1) and stronger (2) responses. *Mean scores are based on a five point scale: stronger (1, 2), little change (3), weaker (4, 5).
from their Republican counterparts as to how to put a spring in the step of those activists who might be going door-to-door, conveying their party’s message.
Role Orientations and Activities
Before these foot soldiers of the parties actually go to work, it is neces-sary to consider how they see themselves in the larger picture. Here the picture for the Democrats is not as grim as we have just seen, but there are still significant inherent GOP advantages (Table 6).
One signal advantage enjoyed by the Democrats lies in their stress on supporting the party’s candidate, even if that person is not altogether to their liking. In a like vein, despite their national reputation for being a fractious lot, Democrats are also more likely to stress party unity than are Republi-cans, a factor that may reflect the tendency toward the ideological right noted above. Of some interest, as well, is the increased Democratic agree-ment on local activities, up 18.8 percent. Perhaps reflecting their leadership in Austin, there is a much stronger orientation toward and approval of activi-ties of their state party organization than there had been ten years earlier. In this respect, the two parties, each looking inward, are not that far apart.
Table 6. Role Orientations and Activities of Texas Party Activists, 1991 and 2001
Democrats Republicans
1991 2001 1991 2001
Role Orientations (percent agreeing)
Support candidate 62.6 61.1 36.3 35.6
Party unity most important 43.8 43.2 27.5 31.9
Candidate values 86.0 65.4 91.8 58.2
Controversial issues 43.7 37.1 35.7 35.2
Remain neutral 47.3 41.1 46.0 29.9
Local activities 64.9 83.7 63.3 79.0
State activities 30.7 86.4 64.4 85.8
Activities (percent important)
Voter contact 84.6 92.6 86.0 90.6
Raising money 41.4 58.5 45.8 46.4
Voter registration 88.9 91.3 82.2 87.6
Campaigning 70.6 80.6 71.3 77.2
Public Relations 72.5 75.5 70.4 73.3
Policy Formulation 53.0 65.2 55.5 67.0
County organizational work 67.1 75.7 60.5 64.9
Information to voters 79.4 87.9 83.1 86.9
Local candidate recruitment 55.0 67.1 63.0 61.6
Notes: Entries for role orientations are the percent agreeing or strongly agreeing. Entries for activi-ties are the percent saying that it is an important aspect of their position.
dispirited above in terms of local organizational effectiveness, they at least claim to place greater emphasis on practical activities, those associated with generating more potent campaigns. Little change is noted among Republi-cans, although there is a greater stress on policy formulation in 2001 as com-pared to 1991. Although the difference between the GOP and Democrats is negligible, this may reflect the increasing ideological tone within each party, in the sense that activists are increasingly driven by issues and ideological positions. In order of increasing distinction between the parties, the 2001 study showed two factors that could play to a Democratic advantage, doing county organizational work (10.8 percent more than Republicans), and fund-raising (12.1 percent more).
Conclusion
in-creasing inclusiveness in the larger Texas society, this is not quite reflected in the makeup of either Republican or Democratic Party workers, although the latter stood ready to work on behalf of a state ticket headed by an His-panic for governor and an African-American for U.S. Senator. That this ticket failed may be attributed to other factors brought out in the campaign.
The success of their statewide party in capturing all statewide offices had the GOP in the position of attempting to defend this remarkable achieve-ment, one that would have been all-but-unthinkable just a few years earlier. Two successive gubernatorial victories by George W. Bush, who had very long coattails, left the party in an invigorated state. This is reflected by GOP activists, who held positive views about their state and local parties. On the other hand, despite a vigorous state headquarters, Democratic activists were less likely to think well of their local parties. Yet, if weight can be placed on their answers, they stood as ready as their GOP counterparts to engage in the kinds of aggressive local activities that can generate a good turnout and vote. In one respect as well, we must update and modify a finding of the 1991 study, in which we said “Republicans evince a strong tendency toward the conservative side of the spectrum, while the Democrats are much more normally distributed” (Feigert and McWilliams 1995, 89). While the con-servatism of the Republicans is both apparent and increasing, what is notable is how Texas Democratic activists have shifted left in their issue stances and self-professed ideology. The two parties, as reflected by their activist base, are further apart than they were before. Given an apparent religious influ-ence, in terms of identification with the Christian Right, if electoral success lies in appealing to the broad middle, the views held by the activists had best be held in check.
REFERENCES
Conway, M. Margaret, and Frank B. Feigert. 1968. Motivation, Incentive Systems, and
Political Party Organizations. American Political Science Review 62:1169-1183.
Cotter, Cornelius P., James L. Gibson, John F. Bibby, and Robert J. Huckshorn. 1984.
Party Organizations in American Politics. New York: Praeger.
Feigert, Frank B., and Nancy L. McWilliams. 1995. Texas: Yeller Dogs and Yuppies. In
Southern State Party Organizations and Activists, eds. Charles D. Hadley and
Lewis Bowman. Westport, CT: Praeger.
Key, V.O. 1949. Southern Politics in State and Nation. New York: Knopf.
Martinez, Andres. 2002. In Texas, the Republican Party’s Sure Thing Faces un Gran
Problema. New York Times, March 12, p. A28.
Posler, Brian D., and Daniel S. Ward. 1997. Texas. In State Party Profiles, eds. Andrew
M. Appleton and Daniel S. Ward. Washington, DC: Congressional Quarterly. Republican Party. 2002. TexasGOP.org named best in nation—again! Texas Republican