Influence of substrate type and properties on root electrical capacitance**
Imre Cseresnyés1*, Eszter Vozáry2, Sándor Kabos3, and Kálmán Rajkai11Department of Soil Physics and Water Management, Institute for Soil Sciences and Agricultural Chemistry, Centre for Agricultural Research, Hungarian Academy of Sciences,H-1022 Budapest, Herman Ottó út 15, Hungary
2Department of Physics and Control, Szent István University, H-1118 Budapest, Somlói út 14-16, Hungary 3Department of Statistics, Eötvös Loránd University, H-1117 Budapest, Pázmány Péter stny. 1/A, Hungary
Received May 2, 2019; accepted September 5, 2019
*Corresponding author e-mail: [email protected] **This work was financed by NKFIH (K-115714), GINOP-2.3.2-15-2016-00028 and a János Bolyai Research Scholarship from the Hungarian Academy of Sciences (2018-2021).
A b s t r a c t. Three pot experiments were performed on cucum-ber, maize, soybean and wheat plants to investigate the effects of various substrate types, namely pumice, arenosol and chernozem soil (Exp. 1), of substrate salinity (Exp. 2) and of soil water con -tent (SWC; Exp. 3) on the electrical capacitance measured in root-soil systems. The data were evaluated according to the basic principle of the two-dielectric capacitor model. Statistical analysis indicated that the capacitance measured in root-soil systems was determined by the capacitance of the root system for each com -bination of plant species and substrate. Furthermore, the results showed that substrate impedance had a negligible influence on the capacitance measured in root-soil systems. Substrate salinity had no direct effect on capacitance measured in root-soil systems, but salt-induced physicochemical changes in plant tissues could have influenced its dielectric properties. Capacitance measured in root-soil systems increased exponentially with root-soil water content (it ranged from 10 to 48 v/v %), indicating that the measured capaci -tance was more sensitive to variability in moisture content at high rather than at low water saturation levels. This is not consistent with the general consensus that the capacitance method is unre-liable in dry soil and should be used at soil water content close to field capacity. The present results will contribute to the more effective application of the root capacitance technique.
K e y w o r d s: root electrical capacitance, root-soil system, soil salinity, soil water content, two-dielectric capacitor model
INTRODUCTION
The measurement of electrical capacitance in root-soil
systems (CRSS) is a promising non-destructive approach in
the estimation of root size and activity. The method is based on experimentally established correlations between CRSS
and the mass, length or surface area of the whole root
sys-tem (Chloupek, 1972; Cseresnyés et al., 2017). Capacitance
is conventionally detected using an LCR meter at ~1 kHz
current frequency between a ground electrode inserted into the substrate and a plant electrode (clamp or needle) fixed on the stem base (Aulen and Shipley, 2012; Postic and Doussan, 2016). This in-situ technique is suitable for moni -toring ontogenetic changes in the root traits of the same
plant cultivar. Since fine, absorbing roots make a substan
-tially higher contribution to the CRSS value than suberized
coarse roots, the capacitance response offers an insight into
root system activity (Dalton, 1995).
The CRSS value recorded is very sensitive to the
elec-trode protocol and substrate properties, so the data are only comparable when the same species is cultivated in the same soil (substrate) type with the same soil water con
-tent (SWC) (Chloupek et al., 2010; Aulen and Shipley, 2012). An increase in the distance of the plant electrode from the substrate surface leads to a hyperbolic decrease
in CRSS, pointing to the need for consistent electrode
place-ment on the stem (Dalton, 1995; Ellis et al., 2013). The capacitance obtained was shown to be influenced by the size and shape of the ground electrode (Kormanek et al.,
2016). Furthermore, SWC was previously reported to have
a marked effect on CRSS (Chloupek, 1977; Dietrich et al.,
2013). On the basis of an experiment with a single tomato plant, Dalton (1995) suggested that root capacitance should be consistently detected at a SWC corresponding to field capacity, this became the general consensus for measure
-ment procedures for many years (Beem et al., 1998; Postic and Doussan, 2016).
The first electrical model (Dalton, 1995) considered the root system to be cylindrical capacitors connected in parallel. The root membranes act as an imperfect dielectric
in the capacitor, separating the two low-resistance con- duits, i.e. the plant’s internal medium and the soil
solu-tion. The polarizable root-soil interface stores electrical charges, exhibiting a capacitance proportional to the sur
-face area. Dalton’s model contains simplifications, e.g. wet
soil is assumed to be purely conductive (with ohmic resist
-ance only), although Chloupek (1977) formerly defined
the capacitive character of loam soil and quartz sand. Therefore, Rajkai et al. (2005) recommended a two-dielec
-tric capacitor model (TCM) consisting of series-connected
root and soil dielectrics. According to the physical laws
for capacitors connected in series (i.e. the reciprocal of the effective capacitance is the sum of the reciprocal of
indi-vidual capacitances), if the soil capacitance (CSoil) is much
higher than the root capacitance (CRoot), CRSS is determined
by the root system (Rajkai et al., 2005; Dietrich et al.,
2013). A subsequent study provided experimental support for the concept of TCM (Kormanek et al., 2016), and the high capacitances detected for various types of substrates at field capacity also meet the model’s criteria (Dietrich et al.,
2013; Ellis et al., 2013; Cseresnyés et al., 2017).
Assuming the validity of TCM, the purpose of the
first pot experiment (Exp. 1) was to evaluate the extent to
which the measured CRSS value represents CRoot for
differ-ent combinations of plant species and substrates. Although the soil ion content was considered by several authors (Chloupek, 1977; Ozier-Lafontaine and Bajazet, 2005) to be an influential factor in determining CRSS, its effect on
the capacitance response has not yet been tested. In Exp.
2 it was hypothesized that if the electrical capacitance
and conductance of the substrate were much higher than those of the root system, then increasing substrate salin
-ity would have no considerable effect on CRSS, specifically
on the parameters of regression between CRSS and root dry
mass (RDM). The objective of Exp. 3 was to statistically
evaluate the relationships between CRSS and SWC, and to
compare the magnitude of CRSS and CSoil under a wide range
of soil moisture conditions. These results may be impor
-tant for the field application of the capacitance technique.
Overall, the aim was to provide practical recommendations for using the CRSS method under various substrate condi
-tions, thereby contributing to the enhanced reliability of the
measurements.
MATERIALS AND METHODS
Exp. 1, which was focused on the study of the influ
-ence of substrate type, was randomized in complete blocks with four plant species, cucumber (Cucumis sativus L. cv.
Perez), maize (Zea mays L. cv. DC488), soybean (Glycine max L. Merr. cv. Martina) and spring wheat (Triticum
aes-tivum L. cv. TC33), and three substrates, pumice, arenosol
and chernozem soil (Table 1), with 30 replicates. The
germinated seeds were planted, one per 3.75 dm3 (16 cm
height and 18 cm upper diameter) plastic pot filled with
dried, coarsely sieved media. The plants were cultivated in a growth room at 28/18 °C with a 16h photoperiod and PAR
of 500 μmol m-2 s-1. All pots were watered daily to field
capacity (17.9-35.9 v/v%) on a balance (±1 g). SWC was checked with a IMKO-HD2 portable TDR meter attached to a Pico32 probe with 110 mm rod length (IMKO GmbH, Ettlingen, Germany). The pumice was fertilized weekly
with 100 cm3 of Hoagland’s solution.
After watering the plants to field capacity, the pots were transported to the laboratory to adjust the temperature, 23±0.5°C. Then CRSS values with a dissipation factor (DRSS;
the ratio of dielectric losses to energy storage) were meas
-ured using a GW-8101G LCR meter (GW Instek Co. Ltd., Taiwan) set to a parallel equivalent circuit at 1 kHz and
1 V AC. The ground electrode was a stainless steel rod,
18 cm long and 0.6 cm i.d. (303S31; RS Pro GmbH, Gmünd, Austria) inserted into the substrate to a 15 cm depth 8 cm from the stem (avoiding direct contact with the pot). The plant electrode was clamped precisely 10 mm above the
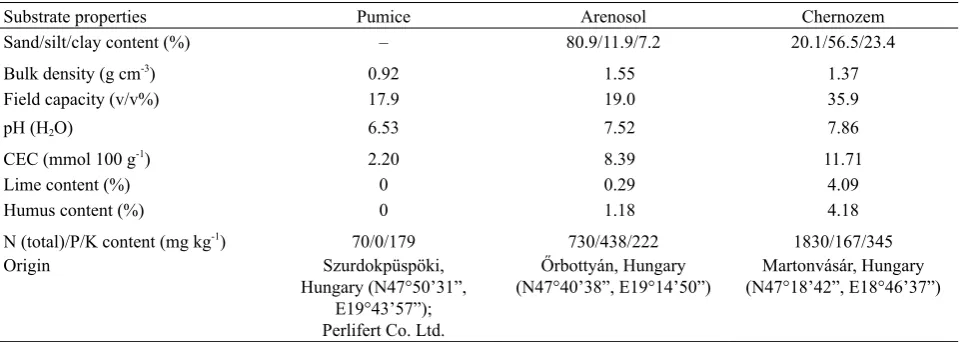
Table 1. Characterization of the substrates used for the pot experiments
Substrate properties Pumice Arenosol Chernozem
Sand/silt/clay content (%) – 80.9/11.9/7.2 20.1/56.5/23.4
Bulk density (g cm-3) 0.92 1.55 1.37
Field capacity (v/v%) 17.9 19.0 35.9
pH (H2O) 6.53 7.52 7.86
CEC (mmol 100 g-1) 2.20 8.39 11.71
Lime content (%) 0 0.29 4.09
Humus content (%) 0 1.18 4.18
N (total)/P/K content (mg kg-1) 70/0/179 730/438/222 1830/167/345
Origin Szurdokpüspöki,
Hungary (N47°50’31”, E19°43’57”); Perlifert Co. Ltd.
Őrbottyán, Hungary
substrate surface through a 5-mm-wide aluminium strip
wrapped around the stem. Conductivity gel was smeared
under the strip. Before measuring the root-substrate system, the dielectric responses of the substrates (CSoil and DSoil)
were detected in all pots between two identical ground elec
-trodes inserted 8 cm apart. One plant from each block was subjected to measurement daily over a 30-day period (plant age: 6-35 days) in order to obtain a wide RDM range for
data evaluation. Directly after the measurements, the stems
were cut at the substrate surface. The roots were carefully washed free of substrate over a 0.2-mm sieve followed by root flotation, after which they were oven-dried (70°C) to a constant weight in order to determine RDM (±0.001 g).
The CRoot values were calculated according to Eq. (12)
(see Appendix), based on the TCM principle. Linear regres -sion was used to relate CRSS or CRoot to RDM. The F-test
was performed to compare the CRSS-RDM and CRoot-RDM
relationships for each plant-substrate system, assuming the
equality in slope and y-intercept of the two regressions. The
statistical significance was assessed at p < 0.05 in each case.
Exp. 2 was performed to investigate salinity-alkalinity
stress, it was carried out using spring wheat (composite cross population) seedlings planted in 1.25 dm3 (13 cm
height and 11.5 cm upper diameter) plastic pots. Pumice was
chosen as the rooting media due to its low cation exchange
capacity (1.78 mmol 100 g-1). Four alkaline treatments with
24 replicates were applied, including a control (CON), as well as 0.5 g (S1), 1 g (S2) and 2 g (S3) Na2CO3 kg–1 sub
-strate concentrations, with a sub-strate pH of 6.44, 7.76, 8.63 and 9.35, respectively. Each pot was irrigated before
planting with 200 cm3 of distilled water (CON) or aqueous
Na2CO3 solution (S1-S3). The growth conditions, plant irri
-gation and nutrition were similar to those in Exp. 1. All of the plants were grown until the 42nd day, when CRSS and CSoil were recorded in each pot. The
measure-ment procedure was the same as in Exp. 1, except for the
10-cm insertion depth and 4 cm distance (from the stem) of
the ground electrode due to the small size of the pot. The plants were then harvested to determine RDM. The effect of salinity on CSoil was evaluated using the unpaired t test.
CRSS-RDM linear regressions were established for each
treatment, after which the F-test was applied to assess the
quality of the model parameters.
The aim of Exp. 3 was to study the effect of SWC,
spring wheat (cv. TC33) seedlings were planted in 1.25 dm3
(13 cm height and 11.5 cm upper diameter) pots. Chernozem soil (different from that used in Exp.1) was used to simulate field conditions in response to SWC. The soil was watered to field capacity. A total of 12 replicates were obtained by
planting one seedling at a time three times a week for four weeks to ensure a wide range of RDM values at the
termi-nal harvest. The plants were grown as described in Exp. 1.
Two days after the last planting, watering was suspended
to reduce SWC to near wilting point (9.7 v/v%) in all pots.
SWC was checked regularly with a TDR meter. When the
wilting point was approached (plant age: 12-28 days), the
SWC around the roots was precisely detected, after which CRSS and CSoil were recorded in each pot (see Exp. 1).
Thereafter, the pot drain holes were closed, and 50 cm3 of
distilled water was poured over the soil. An hour later, soil
moisture and capacitance were measured again (the elec
-trodes were left in place throughout the experiment). The irrigation and measurement steps were repeated (ten times altogether) until the soil became fully water-saturated (47.6 v/v%). Finally, RDM was determined after the harvest.
All of the SWC values were converted to relative water
saturation (θrel). A CRSS-θrel function (n = 10) was established
for each of the 12 plants; R2 was calculated using the
lin-earized ln(CRSS) = ln(a) + b θrel formula (Quinn and Keough,
2002). For a given specimen, all CRSS data were divided
by the capacitance value detected in water-saturated soil (θrel = 1) to obtain the relative capacitance, Crel. A linearized
Crel – θrel model was applied, and the F statistic was used
to test the hypothesis of equal model parameters. As the
y-intercepts proved to be significantly different, Spearman’s
rank correlation analysis was conducted to measure the
strength of monotonic association between the y-intercept and the plant age (day) or RDM.
RESULTS
In Exp. 1, CSoil was found to be 6.93±0.06 nF (mean ±
SE; n = 120), 29.7±0.18 nF and 17.9±0.10 nF for pumice,
arenosol and chernozem soil, respectively, with correspond-ing DSoil values of 30.2±0.12, 23.1±0.13 and 15.5±0.15. The
CRSS values detected ranged from 0.363 to 14.9 nF, depend
-ing on the species, plant age and substrate type. DRSS was
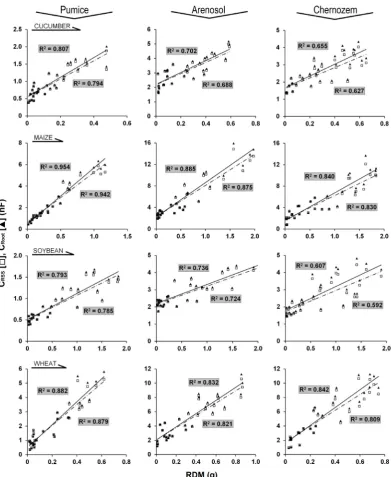
between 2.45±0.12 (mean ± SE; n = 30) and 3.92±0.12 for the various plant–substrate systems. Different plants exhibi-ted 0.009–1.974 g RDM. All of the CRSS-RDM regressions
proved to be highly significant (p < 0.001; n = 30) with R2
ranging from 0.592 to 0.942, and with large differences in slopes (0.573-11.1 nF g-1 RDM; Fig. 1). The regressions
between the calculated CRoot and RDM showed very
simi-lar R2 values (0.607-0.654) and 5.7-14.6% steeper slopes
(0.612-12.5 nF g-1 RDM) compared to the corresponding
CRSS-RDM relationships. The F-test revealed no significant
difference in slope and y-intercept between the CRSS–RDM
and CRoot-RDM regressions for any plant-substrate system
(F2.56: 0.318-1.93; p: 0.154-0.729).
In Exp. 2, CSoil increased with salinity, with values of
6.70±0.16 nF (mean ± SE; n = 24), 7.01±0.18 nF, 7.18±0.20 nF and 7.43±0.18 nF for the CON, S1, S2 and S3 treat -ments, respectively. However, the difference only proved
to be significant between the CON and S3 plants (t = 2.97; p < 0.01). Increasing alkalinity resulted in a consistent
reduction in CRSS with values of 5.68±0.11 nF (mean ± SE;
± 0.012 g, 0.405 ± 0.008 g and 0.297 ± 0.007 g in the same treatments. A close linear correlation was found between
CRSS and RDM (R2: 0.579-0.663; p < 0.001; n = 24) at
each salinity level (Fig. 2). Hypothesizing the equality of both slopes and y-intercepts, the difference was significant across the four lines (F6.88 = 2.33; p = 0.039), but was insig
-nificant across the S1, S2 and S3 regressions (F4.88 = 0.253;
p = 0.907). As no significant difference was found between
the four regressions when the equality of slopes was tested
(F3.88 = 0.015; p = 0.998), the aforementioned significance
was clearly due to differences in the y-intercept between the CON and S1-S2-S3 groups.
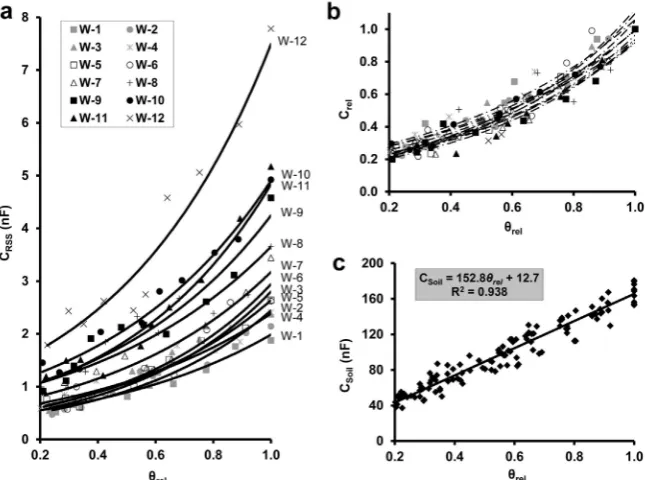
In Exp. 3, wheat plants of different ages exhibited CRSS
values ranging from 1.88 to 7.79 nF in water-saturated
soil, with RDM ranging from 0.030 to 0.635 g. A strong
correlation (p < 0.001; n = 10) between CRSS and θrel was
observed for each specimen, with R2 ranging from 0.870
to 0.955 when applied to the linearized form (Fig. 3a). As
and slope were within the ranges of 0.141-0.214 and
1.51-1.98, respectively. The Crel-θrel functions were significantly
different (F22.96 = 1.72; p = 0.039), but proved to be statis
-tically equivalent in terms of their slopes (F11.96 = 0.823;
p = 0.617). Although the parameter estimation was made after linearization (logarithmic scale), the R2 values were
calculated using the original (exponential) scale. According
to Spearman’s rank correlation analysis, the y-intercept
was significantly negatively correlated with plant age (S = 474; r = -0.657; p = 0.024), and only weakly correlated with RDM (S = 450; r = -0.573; p = 0.055). At any SWC,
CSoil was at least an order of magnitude higher than CRSS
(Fig. 3c), and showed a strong positive linear correlation
with θrel (R2 = 0.938; p < 0.001; n = 120).
DISCUSSION
The close relationships between CRSS and RDM (Exp. 1)
demonstrate that the capacitance detected was a reliable pre -dictor of root system size for various species and growing media. The large differences in the regression parameters
were consistent with previous observations (Beem et al.,
1998; Aulen and Shipley, 2012; Cseresnyés et al., 2017),
and showed the relative nature of CRSS measurement. The
regression fit (R2) decreased with increasing substrate
complexity (pumice < arenosol < chernozem) due to the dielectric behaviour of the variably charged soil colloids, including clay minerals and organic materials (Hilhorst, 1998), which cause interference with the plant response (Ozier-Lafontaine and Bajazet, 2005; Postic and Doussan, 2016). In each case, CSoil and DSoil were found to be consid
-erably higher than CRSS and DRSS, respectively. Therefore,
the calculated CRoot value was a good approximation of the
measured CRSS, as indicated by statistical equivalence of the
parameters between the CRSS-RDM and the corresponding
CRoot-RDM regressions obtained for each plant-substrate
system. These results suggest that the plant-substrate impedance response is influenced jointly by resistance and
Fig. 2. Relationship between the electrical capacitance of the root-substrate systems (CRSS in nanofarads, nF) and root dry mass (RDM; g) for wheat plants exposed to various levels of alkalinity. CON: control; S1, S2 and S3: 0.5, 1 and 2 g Na2CO3 kg–1 pumice substrate, respectively.
capacitance (not only by resistance), and that substrate impedance has a negligible effect on plant response. These findings are in accordance with the basic assumptions of TCM, because – due to the high CSoil values – the roots
rep-resented the main capacitance term for the plant-substrate
system. Ellis et al. (2013) also found soil impedances to be principally resistive, thus having little influence over CRSS
measurements.
Substrate alkalization (Exp. 2) had no effect on the slope of the empirical correlations between CRSS and
RDM, but, irrespective of the salinity level, it signifi -cantly increased the y-intercept compared to the control plants. As the high mean CSoil increased further with salt
concentration, and was only significant between the CON and S3 treatments, it was surmised that the above result was not due to altered soil electrical properties, but was attributable rather to salt-induced changes in the plant, including physicochemical alterations in root membranes and morpho-anatomical modifications in the root system and stem base (Bernstein, 2013; Cseresnyés et al., 2018a). According to the revised model suggested by Dietrich et al.
(2013), a positive regression intercept may be attributed to the capacitance of plant stem tissues between the substrate
surface and the plant electrode. The equal slopes of the four lines, the lack of a trend in the y-intercept with increasing
alkalinity, and the weakly significant (p = 0.039) difference between the control and salinized plants all suggest that substrate salinity has little influence on CRSS.
Exp. 3 demonstrated that CSoil increased with SWC.
Since water has a much higher relative permittivity (εr
~ 80 at 1 kHz) than solid soil constituents (εr < 5) or air
(εr ~ 1), the water dielectric response becomes dominant
as the soil becomes wetter (Hilhorst, 1998). A similar rela
-tionship was observed for potting compost and loam soil (Dietrich et al., 2013). The exponential Crel-θrel functions
were statistically equal in terms of slope, but the y-intercept showed a negative correlation with plant age. This is
pre-sumably due to age-dependent histological changes in the roots and stem base, which influence the dielectric response by altering the proportion of apoplastic to symplastic cur
-rent pathways (Cseresnyés et al., 2018a). This finding seems to be dependent on the plant species, as previous investigations concerning soybean and maize did not show such an effect (Cseresnyés et al., 2018b). Dalton (1995)
and Dietrich et al. (2013) stated that a decrease in SWC
caused a reduction in the root surface area in contact with soil pore water and thus a reduction in the measured capaci-tance. In contrast, Ellis et al. (2013) suggested that, as the
root surface area is much larger than the electrode surface area, decreasing capacitance in a drying soil was more like-ly due to reduced electrode-soil contact. The exponential
relationship between CRSS and θrel was inconsistent with the
results of Dalton (1995), who found the SWC effect to be
minimal at θrel from 0.35 to 0.85 and thus recommended
this SWC range (primarily field capacity) for CRSS
meas-urements. However, the results presented show that CRSS
became increasingly sensitive to SWC as water saturation
increased, suggesting that identical moisture conditions are even more important for the comparison of capacitance data at high water saturation levels. In accordance with
this finding, a closer correlation was demonstrated between
CRSS and canola root traits before rather than after substrate
irrigation (Wu et al., 2017). A previous study also revealed that RDM could be reliably estimated by CRSS when SWC
was close to the wilting point (Cseresnyés et al., 2018b).
Although CRSS was found to be considerably lower than
CSoil at any SWC (i.e. the CRSS detected was determined by
the root system in the case of series-connected root and soil
dielectrics), this relationship should to be verified for the actual combination of plant species and rooting medium
tested.
CONCLUSIONS
1. Taking into account the fundamental physical
prin-ciple of TCM, the above experiments provided statistical
evidence supporting the fact that CRSS was dominated by
root capacitance, irrespective of the plant species and sub -strate type.
2. The results suggest that CRSS is not directly influenced
by substrate salinity. However, further experiments with revised statistics will be necessary to draw more reliable
conclusions.
3. The exponential increase in CRSS with SWC clearly
shows that the accuracy of the capacitance method is more
sensitive to variability in moisture content when the meas -urements are made at a high soil water level, i.e. at the
conventionally recommended field capacity. Moreover, the results support the ability of the method to estimate root size efficiently in dry soil environments, which could be particularly relevant for field application.
Conflict of interest: The authors declare that they have
no conflict of interest.
REFERENCES
Aulen M. and Shipley B., 2012. Non-destructive estimation of root mass using electrical capacitance on ten herbaceous species. Plant Soil, 355, 41-49.
https://doi.org/10.1007/s11104-011-1077-3
Beem J. van, Smith M.E., and Zobel R.W., 1998. Estimating root mass in maize using a portable capacitance meter. Agron. J., 90, 566-570.
https://doi.org/10.2134/agronj1998.00021962009000040021x Bernstein N., 2013. Effects of salinity on root growth. In: Plant
Roots: The Hidden Half (Eds A. Eshel, T. Beeckman). CRC Press, Boca Raton, FL, USA, 36/1-18.
https://doi.org/10.1201/b14550-42
Chloupek O., 1977. Evaluation of the size of a plant’s root system using its electrical capacitance. Plant Soil, 48, 525-532. https://doi.org/10.1007/bf02187258
Chloupek O, Dostál V., Středa T., Psota V., and Dvořáčková O., 2010. Drought tolerance of barley varieties in relation to their root system size. Plant Breeding, 129, 630-636. https://doi.org/10.1111/j.1439-0523.2010.01801.x
Cseresnyés I., Kabos S., Takács T., Végh R.K., Vozáry E., and Rajkai K., 2017. An improved formula for evaluating elec-trical capacitance using the dissipation factor. Plant Soil, 419, 237-256. https://doi.org/10.1007/s11104-017-3336-4 Cseresnyés I., Rajkai K., Takács T., and Vozáry E., 2018a.
Electrical impedance phase angle as an indicator of plant root stress. Biosyst. Eng., 169, 226-232.
https://doi.org/10.1016/j.biosystemseng.2018.03.004 Cseresnyés I., Szitár K., Rajkai K., Füzy A., Mikó P., Kovács R.,
and Takács T., 2018b. Application of electrical capacitance method for prediction of plant root mass and activity in field-grown crops. Front. Plant Sci., 9, 93.
https://doi.org/10.3389/fpls.2018.00093
Dalton F.N., 1995. In-situ root extent measurements by electrical capacitance methods. Plant Soil, 173, 157-165.
https://doi.org/10.1007/bf00155527
Dietrich R.C., Bengough A.G., Jones H.G. and White P.J., 2013. Can root electrical capacitance be used to predict root mass in soil? Ann. Bot., 112, 457-464.
https://doi.org/10.1093/aob/mct044
Ellis T., Murray W., Paul K., Kavalieris L., Brophy J., Williams C., and Maass M., 2013. Electrical capacitance as a rapid non-invasive indicator of root length. Tree Physiol., 33, 3-17. https://doi.org/10.1093/treephys/tps115 Hilhorst M.A., 1998. Dielectric characterisation of soil. Ph.D.
Thesis, Wageningen Agricultural University, The Netherlands. Kormanek M., Głąb T., and Klimek-Kopyra A., 2016.
Modification of the tree root electrical capacitance method under laboratory conditions. Tree Physiol., 36, 121-127. https://doi.org/10.1093/treephys/tpv088
Ozier-Lafontaine H. and Bajazet T., 2005. Analysis of root growth by impedance spectroscopy (EIS). Plant Soil, 277, 299-313. https://doi.org/10.1007/s11104-005-7531-3 Postic F. and Doussan C., 2016. Benchmarking electrical
meth-ods for rapid estimation of root biomass. Plant Methmeth-ods, 12, 33. https://doi.org/10.1186/s13007-016-0133-7
Quinn G.P. and Keough M.J., 2002. Experimental design and data analysis for biologists. Cambridge University Press. Rajkai K., Végh R.K., and Nacsa T., 2005. Electrical
capaci-tance of roots in relation to plant electrodes, measuring frequency and root media. Acta Agron. Hung., 53, 197-210. doi:10.1556/AAgr.53.2005.2.8
According to our concept, the electrical impedance of the root–soil system (ZRSS) is the sum of the soil and the root impedance: ZRSS = ZSoil + ZRoot. Both of these impedances can be represented by a parallel-connected resistor (R) and capacitor (C) connected in parallel. In this model, Z = R/(1+iωRC), where i is the imaginary unit and ω = 2πf, f is the AC frequency. The electrical impedance is a complex number, which is determined by the real part (ReZ) and the imaginary part (ImZ), as Z = ReZ + iImZ. Our precision LCR meter allows us to measure not only the real and imaginary part of impedance, but also the other two impedance parameters. If we consider our sample as a parallel RC circuit, we can measure the value of C directly and the dissipation factor, D, which is the ratio of the real to the imaginary part of impedance. In this work, the parallel C value and D were chosen for measurement, because C is dependent on the root system size during plant development.
The two-dielectric capacitor model considers the root–soil system (RSS) as series-connected root and soil dielectrics, both of which are lossy capacitors (parallel RC circuits).
For a parallel RC circuit, D = 1/(ωCR). The real (Eq. 1–3) and imaginary (Eq. 4–6) part of electrical impedance for RC circuits may be expressed using D and C, as:
2
Soil Soil Soil D 1 C D
, Root
2Root
Root D 1 C D
, RSS
2RSS
RSS D 1 C D
(1, 2, 3)
2
Soil
Soil1 D
C 1
, CRoot
1 D2Root
1
, CRSS
1 D2RSS
1
(4, 5, 6)
The sum of the real parts for the soil and root circuits is equal to the real part for the RSS circuit (Eq. 7), and this is also true for the imaginary parts (Eq. 8):
2
RSS RSS RSS 2 Root Root Root 2 Soil Soil Soil D 1 C D D 1 C D D 1 C D
(7)
2
RSS RSS 2 Root Root 2 Soil
Soil C 1 D
1 D 1 C 1 D 1 C 1
(8)
As CSoil, DSoil, CRSS and DRSS were measured instrumentally in the experiment, CRoot and DRoot may be determined by first transforming Eq. (7) and (8) into Eq. (9) and (10), respectively (to express the real and imaginary parts for the root circuit), and then calculating DRoot by dividing Eq. (9) by Eq. (10), obtaining Eq. (11):
2
Soil Soil Soil 2 RSS RSS RSS 2 Root Root Root D 1 C D D 1 C D D 1 C D
(9)
2
Soil Soil 2 RSS RSS 2 Root
Root C 1 D
1 D 1 C 1 D 1 C 1
(10)
2
RSS RSS 2 Soil Soil 2 RSS RSS Soil 2 Soil Soil RSS Root D 1 C D 1 C D 1 C D D 1 C D D (11)
Then CRoot can be calculated as (Eq. 12):