Overall, total body water physiologically decreases with age, from 75% in new-borns to 56% and 47% in men and women older than 50, respectively (EFSA, 2010). In adults, it is reported that the deficit of 1–2% of body water decreases physical and mental perfor-mance by 20% (EFSA, 2010; Gopinathan, Pichan, & Sharma, 1988).
Dehydration is especially common and dangerous for infants, young children and older adults. Children have a higher proportion of body water compared to adults; they are also less heat tolerant and more sus-ceptible to dehydration (British Nutrition Foundation, 2016). Older people have, thanks to a combination of lower total body water content and decreased thirst sensitivity, increased risk of developing dehydration. Additionally, age-related poor renal function and the increased prevalence of kidney and urinary tract dis-eases are likely to increase dehydration risk (Hooper, Bunn, Jimoh, & Fairweather-Tait, 2014; National Academies of Sciences, Engineering, and Medicine, 2016). The risk of dehydration can also be enhanced with increased physical activity, especially in hot climates. Adequate intakes of water for the elderly,
Introduction
Adequate hydration status is essential for health and life. Water is the most abundant component in the human body. Fluids fill virtually every space in cells and between them. Many biochemical reactions occur in water solutions and water participates directly in some reactions (Kleiner, 1999). The quantity of ingested fluid is critical for a constant internal environment, the volume of the vascular bed, thermoregulation, and the digestion and substrate transport, as well as a multitude of other physiological processes (Amstrong, 2007; European Food Safety Authority [EFSA], 2010; Malisova, Bountziouka, Panagiotakos, Zampelas, & Kapsokefalou, 2013). Moreover, proper hydration is important for optimal cognitive functioning, as it plays a vital role in neural conductivity (Kleiner, 1999; Suhr, Hall, Patterson, & Niinistö, 2004).
* Address for correspondence: Iva Klimešová, Department of Natural Sciences in Kinanthropology, Faculty of Physical Cul-ture, Palacký University Olomouc, třída Míru 117, 771 11 Olo-mouc, Czech Republic. E-mail: [email protected]
Hydration status in Czech elderly adults: Gender and physical activity differences
Iva Klimešová*, Julie Wittmannová, and Liběna Kováčová
Faculty of Physical Culture, Palacký University Olomouc, Olomouc, Czech Republic
Copyright: © 2018 I. Klimešová et al. This is an open access article licensed under the Creative Commons Attribution License (http://creativecommons.org/licenses/by/4.0/).
Background: Dehydration is the most common fluid and electrolyte problem among elderly people. The elderly lead-ing an active lifestyle may be a risk group vulnerable to dehydration. Objective: The goals of the study were: to assess hydration status and the fluid intake, to determine gender differences in hydration status and fluid intake, and to determine the role of physical activity on hydration status in free-living elderly people. Methods: The research sample included 105 participants aged 67.2 ± 3.7 years (52% women) living independently in their own homes. Urine spe-cific gravity (USG) was used to evaluate the hydration status (dehydration was defined as USG ≥ 1.020 and serious dehydration as USG > 1.030). A 4-day food record was used to monitor fluid intake, and the International Physical Activity Questionnaires – Short Form was used to assess physical activity. Results: The prevalence of dehydration was 45.7% with a lower prevalence in women. Serious dehydration was prevalent in two participants. Average daily beverage intake was 1144.4 ± 445.2 ml. There was no gender difference in total fluid intake. However, only 27.3% of women and 4.0% of men fulfilled the recommended daily fluid intake. Participants with moderate or high levels of physical activity had a better hydration status compared to their low-physical activity peers. Conclusions: These results indicate that almost half of elderly adults are dehydrated. The study suggests that being physically active can contribute to better fluid replenishment.
therefore, should not be based solely on observed intakes, but should take into account the decrease in renal concentrating capacity with age and the decrease in thirst sensitivity.
Although most Europeans have access to good qual-ity drinking water, many studies reveal that inadequate fluid intake is no exception. For example, a large study ANIBES, conducted among a representative sample of 2285 healthy participants aged 9–75 years in Spain, demonstrated that more than 75% of participants had inadequate total water intake (Nissensohn et al., 2016). The findings of ANIBES study indicate that neither men nor women consumed adequate total water intake, according to EFSA adequate intakes reference values. Furthermore, a number of studies have shown that the water intake decreased with age. In simple terms, older adults are at risk of dehydration due to reduced fluid intake compared to younger adults (EFSA, 2010; Ferry, Hininger-Favier, Sidobre, & Mathey, 2001; Goodman et al., 2013; Haveman-Nies, de Groot, & Van Staveren, 1997; Nissensohn et al., 2016; Stookey, 2005).
Available data about gender differences in hydra-tion status are insufficient and inconsistent. On the one hand, there are works which have shown that women are more vulnerable to insufficient fluid intake (Ferry et al., 2001; Haveman-Nies et al., 1997), on the other hand, recent studies have shown increased risk of dehydration in men (Drywień & Galon, 2016; Nissensohn et al., 2016). The data from the Third National Health and Nutrition Examination Survey (NHANES III), which evaluated dehydration by serum osmolality, demonstrated that dehydration was more common in men of all ages (23% in men aged 20–90 years) than women of the same age range (16%; Stookey, 2005).
Under normal conditions, the thirst sensation is a sufficient stimulus for adequate fluid ingestion and maintenance of normal body water balance from day to day. However, thirst is actually a sign of existing dehydration (Amstrong, 2007; Matějovská, 2012). The thirst drive does not stimulate drinking until water loss reaches 1% to 2% of body weight (Greenleaf, 1992). In spite of the powerful benefits of physical activity (PA) and optimal hydration status, there are only a few studies analysing both fluid intake and PA in elderly populations. Age-related reduced thirst sensitivity can cause that the elderly leading an active life may be a risk group vulnerable to dehydration; hence we assume that the monitoring may be needed. Because healthy older adults are a sizeable and growing segment of the Czech population, it is important to better appreciate the full spectrum of health promotion among older adults.
The aims of the study were as follows: to assess hydration status and the fluid intake, to determine
gender differences in hydration status and fluid intake, and to determine the role of physical activity on hydra-tion status in free-living elderly people.
Methods
Ethics
The local ethics committee approved the study. Written informed consent was obtained prior to the study from the participants. The participation in this study was vol-untary and unpaid. All study participants were provided with individual feedback on results, together with rec-ommendations for health-promoting fluid intake.
Selection of participants and data inclusion criteria
A total of 120 elderly people (54 men and 66 women) from 7 randomly selected seniors clubs were recruited through printed advertisements. The seniors clubs were selected from all 20 clubs in the city of Olomouc, the Czech Republic. The data were collected during May/June 2016 and May/June 2017 under compa-rable daily climate conditions. The inclusion criteria were men or women aged 60 and over with no upper age limit in eligibility, being able to provide informed consent, absence of metabolic diseases (6 exclusions), and not currently taking diuretic (2 exclusions) or other medications that affect the water content in the body (0 exclusions). Further criteria for inclusion in the analyses were full information on anthropometric (weight and height) measures (0 exclusions), collect-ing all four urine samples (5 exclusions) and completed 4-day food weighed records (2 exclusions for missing data). After exclusions, data for 50 men and 55 women were available for analysis. The total sample age was 67.2 ± 3.7 years. The sample body mass index was 26.6 ± 3.8 kg/m2, and 29% of the participants were
categorized as in the healthy weight range, 55% over-weight, and 16% obese.
Instrument and procedures
Anthropometric measures
For anthropometric (body weight and height) measure-ments, the participants wore light clothing without shoes. Body weight and height were measured with a portable scale and stadiometer (Tanita WB-3000; Tanita, Tokyo, Japan). Body mass index was calculated as kilo-grams per square meter. Weight status (healthy weight/ overweight/obese) was determined using criteria of the World Health Organization [WHO] (2018) standard. Hydration status
collected separately for each specific type of activity. The data processing methodology was done accord-ing to the original recommendations for the question-naire (IPAQ, 2005). Based on the IPAQ-SF, the energy output (MET-minutes/week) of each participant was calculated. This questionnaire identifies the physical activity and inactivity performed in the last seven days and categorizes PA as low, moderate and high.
According to the PA levels, the participants were divided into three categories:
1. Low PA: those individuals who do not meet criteria for categories moderate or high PA.
2. Moderate PA: 3 or more days of vigorous activity of at least 20 minutes per day; or 5 or more days of moderate-intensity activity or walking of at least 30 minutes per day; or 5 or more days of any com-bination of walking, moderate-intensity or vigorous intensity activities achieving a minimum of at least 600 MET-minutes/week.
3. High PA: vigorous-intensity activity on at least 3 days achieving a minimum of at least 1500 MET-minutes/week; or 7 or more days of any combina-tion of walking, moderate-intensity or vigorous intensity activities achieving a minimum of at least 3000 MET-minutes/week.
The criteria used follow the current findings that 30 minutes of moderate exercise activity performed most days during the week has a key preventive role in car-diovascular disease, type 2 diabetes, obesity, and some cancers (WHO, n.d.).
Data analysis
All statistical analyses were conducted using STA-TISTICA (Version 12.0; StatSoft, Tulsa, OK, USA). Descriptive data (means, standard deviations, median, minimum and maximum values) were calculated for all variables. The Lilliefors normality test showed non-nor-mal data distribution. We categorised participants as either euhydrated or dehydrated according to the afore-mentioned cut-offs based on their USG. Differences between groups (euhydrated and dehydrated; men and women) were evaluated by the non-parametric Mann– Whitney U test. Additionally, we calculated effect size coefficient (r) according the formula: r = Z/√N. Value range for effect size was: .1 < r < .3 – small effect, .3 < r < .5 – medium effect, r > .5 – strong effect (Cohen, 1988). Pearson’s chi-squared test was used to assess the relationship between hydration status (euhy-drated and dehy(euhy-drated) and physical activity (low/ moderate/high). The values were considered to be sig-nificantly different if p < .05.
The participants received 4 sterile urine containers for the collection of their first morning urine sample for the following days.
The participants collected the urine samples within 4 days of the fluid records. USG was measured with a handheld refractometer (ATAGO SUR-NE, Tokyo, Japan) in duplicate. Between sample readings, the refractometer was recalibrated using distilled water. In order to reduce the risk of inter-rater error, the same researcher conducted all analyses. The par-ticipants were classified as euhydrated or dehydrated based on the criteria for hydration status in adults (USG ≥ 1.020; Kavouras, 2002; Sawka et al., 2007). The criterion for serious dehydration was USG > 1.030 (Kavouras, 2002; Sawka et al., 2007). The USG value is based on the density of the water and is therefore given a dimensionless number. The daily average hydra-tion status was calculated as the average of these 4 days measurements.
4 days food record
The daily average intakes of beverages and soups were assessed, using the method of 4 days of weighed records, including three weekdays and one weekend day. The recorded period was always from Sunday to Wednesday or from Wednesday to Saturday to acquire fluid intake during weekend and working days. Prior to recording consumption, the survey participants were trained on how to adequately describe the soups and beverages. At the end of the recording period, the record was thoroughly reviewed with the subject to make records more accurate by clarifying the entries and by adding any omitted items and amounts. The records were evaluated only in terms of consump-tion of beverages, soups, and total fluid intake from beverages plus soups. For the assessment of adequate beverage intake, we followed the EFSA (2010) recom-mendations. Even though EFSA did not make a for-mal recommendation on drinks, only on total water (2.5 L/day in men and 2 L/day in women), EFSA assumed 20% of total water in the diet is supplied by foods. For this reason, we used a value of 1.6 L/day for women and 2 L/day for men as a criterion of sufficient amount of fluids taken from only beverages. The same criteria were set out in Hooper et al. (2014).
Physical activity level
Results
Hydration status
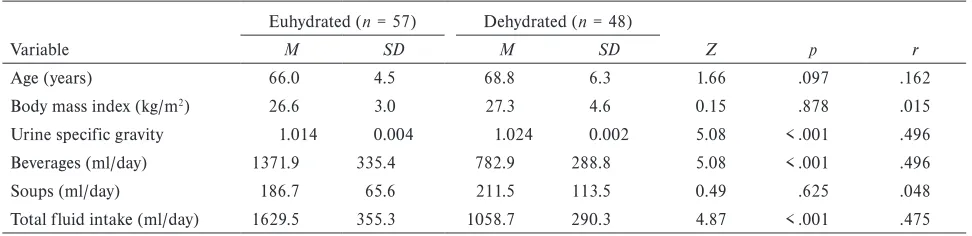
The sample mean for USG was 1.018 ± 0.005, thus in the euhydration range. Hydration assessment, based on the 4 day’s average first morning USG, showed that 45.7% (48 out of 105) of the participants were dehy-drated (Table 1). Serious dehydration was prevalent in two men (USG 1.036, 1.032). Women had statisti-cally significantly lower USG values compared to men (Table 2). Higher prevalence of dehydration occurred in men (p < .001), there were 15 women (27.3%) and 29 men (58.0%) dehydrated in the overall sample.
No statistically significant differences in age and body mass index were found between euhydrated and dehydrated groups (Table 1).
Daily fluid intake
Reported 4-day food recordshowed that average daily intake was 1144.4 ± 445.2 ml for the total sample. The average total fluid intakes showed a large variabil-ity: 250.0–2467.5 ml/day for men and 680.0–1775.0 ml/day for women. Only 15 women (27.3%) and 2 men (4.0%) met the set criteria for minimum beverages (1.6 L/day for women and 2 L/day for men). When compar-ing fluid intake in euhydrated and dehydrated partici-pants, we found significantly higher beverage and total
fluid intake in the euhydrated group (p < .001; Table 1). The group of euhydrated participants had a higher total fluid intake from beverages and soups by 571 ml than the dehydrated participants. There was no difference in soups intake between euhydrated and dehydrated par-ticipants (Table 1). We found no gender difference in beverages, soups and total fluid intake (Table 2).
PA level and hydration status
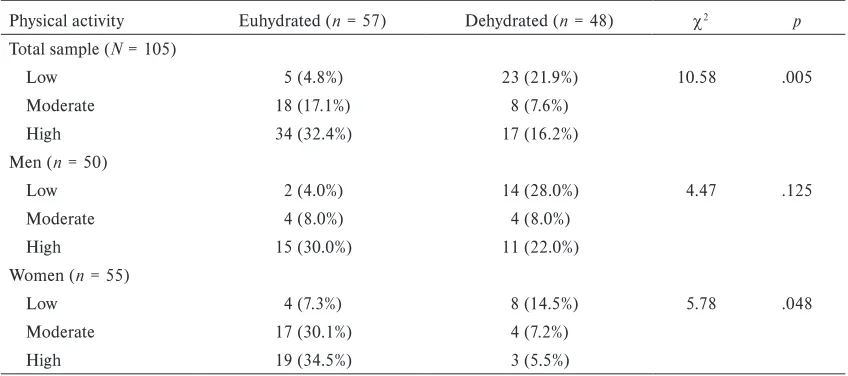
Assessment of PA level demonstrated that 26.7% par-ticipants were characterised as low active, 24.8% met the recommendations for moderate PA, and 48.6% were characterised as high active. There was a statistically sig-nificant difference in the PA rate between the groups of the euhydrated and dehydrated participants (p = .005; Table 3). In the group of euhydrated participants, only 8.8% (5 out of 57) had low PA, while 47.9% (23 of 48) were in the dehydrated group. The highest number of euhydrated participants (32.4%, 34 out of 105) was found in the subgroup of high active. On the one hand, subgroup analysis revealed that the beneficial effect of PA on hydration status was not seen in male participants (p = .125), and for women, the difference between sub-groups of low, moderate and high active was at the cho-sen significance level (p = .048). On the other hand, the highest numbers of optimally hydrated men and women were found in high active subgroups (Table 3).
Table 1
Characteristics of the sample stratified by hydration status (N = 105)
Variable
Euhydrated (n = 57) Dehydrated (n = 48)
Z p r
M SD M SD
Age (years) 66.0 4.5 68.8 6.3 1.66 .097 .162
Body mass index (kg/m2) 26.6 3.0 27.3 4.6 0.15 .878 .015
Urine specific gravity 1.014 0.004 1.024 0.002 5.08 < .001 .496
Beverages (ml/day) 1371.9 335.4 782.9 288.8 5.08 < .001 .496
Soups (ml/day) 186.7 65.6 211.5 113.5 0.49 .625 .048
Total fluid intake (ml/day) 1629.5 355.3 1058.7 290.3 4.87 < .001 .475
Table 2
Characteristics of the sample stratified by gender (N = 105)
Variable
Men (n = 50) Women (n = 55)
Z p r
M SD M SD
Age (years) 67.6 5.3 66.8 5.3 –0.54 .592 .053
Body mass index (kg/m2) 26.8 3.8 26.8 3.5 0.36 .722 .035
Urine specific gravity 1.020 0.006 1.017 0.005 –2.45 .014 .239
Beverages (ml/day) 1020.1 434.4 1213.4 412.7 1.70 .088 .166
Soups (ml/day) 212.0 106.6 185.0 56.7 –0.49 .451 .048
Discussion
Adequate hydration is an essential component of health at every stage of life, especially in elderly population since older adults are at higher risk of developing dehy-dration for various physiological reasons. The aims of this study were to determine hydration status, fluid intake, gender differences, and the relation between hydration status and the level of PA in free-living older adults, based on USG measurement and classification of participants according IPAQ-SF into three groups as low, moderate and high active.
Evaluation of average USG from first morning urine, which was tested over 4 consecutive days, proved that 45.7% of the elderly were in the dehydration zone. As for gender differences, data analysis revealed lower USG values in women compared to men, 27.3% of women were dehydrated and 58.0% of men in our research sample. These findings are consistent with the findings from large NHANES III cohort. The study NHANES III (Stookey, 2005) revealed that 40% people in the 70–90 age group were at risk of dehy-dration. Similarly, an English cross-sectional study has described that 46% of 186 people aged 65–106 years were at risk of dehydration (Siervo, Bunn, Prado, & Hooper, 2014). Blood plasma osmolality was used to evaluate the hydration status in both studies. Con-trary to our findings, a Polish study, involving 138 volunteers aged 60–90 recruited from Universities of the Third Age, describes a higher risk of dehydration in this population group (Drywień & Galon, 2016). There were 51% of women and 75% of men threatened with dehydration because they had an insufficient fluid intake. The Polish research sample was comparable to our sample not only by age but also by higher level
of PA, when 80% of participants reported regular PA. However, the limit of this Polish study is that the risk of dehydration was assessed only with using the method of 3-day food and beverage records. No physiological markers were used to define hydration status.
Daily fluid intake is predominantly fulfilled by con-sumption of drinking water and beverages (70–80%), plus the water contained in food (20–30%). The foods with the highest content of water include fruit and vegetables, where water content is usually more than 80%, while in case of bakery products the water con-tent is usually below 40% (EFSA, 2010). Authorities have produced varying reference values for total water intake. The adequate intake values for water from beverages and foods according to the US Institute of Medicine are 3.7 L/day for adult men and 2.7 L/day for adult women (Institute of Medicine of the National Academies, 2005), while the WHO recommended values significantly lower – 2.9 L/day for men and 2.2 L/day for women (WHO, 2005). Guidelines issued by the EFSA specify that the total adequate water intakes for adults at a moderate intensity work and mild out-door temperature should be 2.5 L/day for men and 2.0 L/day for women (EFSA, 2010). All these recommen-dations include water from all beverages and foods.
A large variability of total fluid intakes observed in men and women in our research sample was compa-rable to the findings from the population studies used by EFSA (2010). The EFSA Comprehensive Euro-pean Food Consumption Database showed range of 917–1895 ml/day for women and 1027–1585 ml/day for men. A similar range was observed in an analysis of recent surveys conducted in twelve European countries (Nissensohn, Castro-Quezada, & Serra-Majem, 2013) Table 3
Physical activity level of the participants stratified by hydration status
Physical activity Euhydrated (n = 57) Dehydrated (n = 48) c2 p
Total sample (N = 105)
Low 5 (4.8%) 23 (21.9%) 10.58 .005
Moderate 18 (17.1%) 8 (7.6%)
High 34 (32.4%) 17 (16.2%)
Men (n = 50)
Low 2 (4.0%) 14 (28.0%) 4.47 .125
Moderate 4 (8.0%) 4 (8.0%)
High 15 (30.0%) 11 (22.0%)
Women (n = 55)
Low 4 (7.3%) 8 (14.5%) 5.78 .048
Moderate 17 (30.1%) 4 (7.2%)
or in large ANIBES study in which more than 75% of 2285 healthy people aged 9–75 years had inadequate water intake (Nissensohn et al., 2016).
We did not find any statistically significant differ-ences between men and women in reported total fluid intake, beverage intake and/or soup intake. On the other hand, analysis of the 4-day food record revealed that only 27.3% of women and 4.0% of men met the established criteria for minimum fluid intake. Since the men had a reported intake of fluids comparable with women, it is understandable that men had a higher prevalence of dehydration than women. Moreover, we have to take into account that almost half of our partici-pants (48.6%) had a high level of PA and therefore their fluid intake should be higher than the recommended minimum. The detected low fluid intake is in contrast to only 45.7% of participants characterized as urinary dehydrated in our sample. This contradiction could be explained by the fact that the data found in the food records gave a distorted view of the fluid intake, despite the participants having been properly trained in com-pleting the food records.
It is logical that PA increases fluid output and those with higher levels of PA could theoretically be more at risk of dehydration as compared to those with lower PA. Nevertheless, the results of our study sug-gest that people with poor PA are more often dehy-drated compared to people with sufficient or high PA. Higher fluid intake in people with sufficient physical activity was demonstrated in de Francisco, Mar-tínez Castelao, and Grupo Investigador Bahía 2008 (2010) – the people with high PA levels drank more fluids compared with those with low PA levels. The study confirmed on the sample of 6508 participants aged > 18 years that the greater the physical activity, the greater the beverages consumption. Finally, the same pattern was found in a Spanish study involving 433 non-institutionalized older adults aged 55–88 years (Aparicio-Ugarriza et al., 2016). It is therefore probable that people with regular PA have an overall healthier lifestyle, including better fluid replenish-ment. As Warburton (2006) confirmed, regular physi-cal activity has been shown to be associated with an improvement in health status and overall quality of life. The positive influence of PA on the subjective percep-tion of the life quality in elderly adults (aged 65–89 years) suggests also recent Wittmannová, Klimešová, and Piňosová’s (2018) work. In connection with this, there is scientific evidence that being physically active can help you lead a healthier lifestyle, including better fluid replenishment.
As in any paper, the results of our study should be considered with respect to the limitations of the study. We are aware that hydration status is affected
by a number of external and internal factors. The most important external factors are weather and seasons. The hydration status was evaluated during May/June period. Collecting data on hot summer days would probably have reached different results. Another limitation is that we used self-reported data for the evaluation of fluid intake and physical activity level. However, these tools are standard in the mea-surement of screen-based behaviour. We are aware of another possible distortion of the results due to the use of the IPAQ-SF. The verification of this tool in a Central European population was done on a sample of the participants aged 15–69 (Sigmund et al., 2009). Higher proportion of the participants in our sample with high level of PA (49%) does not correspond to the results of Pelclová et al. (2008), where the clas-sification for high PA reached 20.3% of Czech partici-pants aged 55–69 years. The involvement of subjects over 69 years old in our sample may have distorted the data due to possible differences in the perceived terms of PA intensity. As respondents aged, they could have a tendency to perceive low intensity PA as moderate and even high intensity activity. On the other hand, there were only 18.1% (19 out of 105) of participants aged over 69 in our research sample.
The important strength is the methodology of eval-uation of hydration status used in this study. Although there is currently no consensus on a ‘gold standard’ for hydration status markers, refractometry measurement of USG is considered to be a method having good accu-racy and being non-invasive and inexpensive (Baron, Courbebaisse, Lepicard, & Friedlander, 2015).
Conclusions
Analysis of a 4 day average of first morning USG values showed that 45.7% of elderly adults were dehydrated, the lower prevalence of dehydration was in women compared to men. There were no gender differences in beverages, soups and total fluid intake. Reported 4 day’s fluid intake was very low, only 27.3% women and 4.0% men met the set criteria for minimum beverages intake. Most of the participants met the criteria for suf-ficient PA level. The data showed that elderly adults with sufficient or high PA level have better hydration status than those whose PA is low.
Acknowledgments
Conflict of interest
There were no conflicts of interest.
References
Amstrong, L. (2007). Assessing hydration status: The elusive gold standard. Journal of the American College of Nutrition, 26, 575–584.
Aparicio-Ugarriza, R., Luzardo-Socorro, R., Palacios, G., del Mar Bibiloni, M., Julibert, A., Tur, J. A., & González-Gross, M. (2016). Impact of physical activity and seden-tarism on hydration status and liquid intake in Spanish older adults. The PHYSMED study. Nutrición Hospital-aria,33(3), 21–22.
Baron, S., Courbebaisse, M., Lepicard, E. M., & Friedlander, G. (2015). Assessment of hydration status in a large popu-lation. British Journal of Nutrition, 113, 147–158.
British Nutrition Foundation. (2018). Hydration for children. Retrieved from https://www.nutrition.org.uk/healthyliv-ing/hydration/hydration-for-children.html
Cohen, J. (1988). Statistical power analysis for the behav-ioral sciences (2nd ed.). Hillsdale, NJ: Lawrence Erlbaum Associates.
Craig, C. L., Marshall, A. L., Sjöström, M., Bauman, A. E., Booth, M. L., Ainsworth, B. E., … Oja, P. (2003). Interna-tional physical activity questionnaire: 12-country reliabil-ity and validreliabil-ity. Medicine & Science in Sports & Exercise, 35, 1381–1395.
de Francisco, A. L. M., Martínez Castelao, A., & Grupo Investigador Bahía 2008. (2010). The Bahía 2008 Study: Hydration barometer in the Spanish population. Nefrolo-gia,30, 220–226.
Drywień, M. E., & Galon, K. (2016). Assessment of water intake from food and beverages by elderly in Poland. Roc-zniki Państwowego Zakładu Higieny, 67, 399–408.
European Food Safety Authority. (2010). Scientific opinion on dietary reference values for water. EFSA Journal, 8, 1459–1506.
Ferry, M., Hininger-Favier, I., Sidobre, B., & Mathey, M. F. (2001). Food and fluid intake of the SENECA population residing in Romans, France. Journal of Nutrition, Health and Aging, 5, 235–237.
Goodman, A. B., Blanck, H. M., Sherry, B., Park, S., Nebel-ing, L., & Yaroch, A. L. (2013). Behaviors and attitudes associated with low drinking water intake among US adults. Food Attitudes and Behaviors Survey, 2007. Pre-venting Chronic Disease,10(1), E51.
Gopinathan, P. M., Pichan, G., & Sharma, V. M. (1988). Role of dehydration in heat stress induced variations in mental performance. Archives of Environmental Health an International Journal, 43, 15–17.
Greenleaf, J. E. (1992). Problem: Thirst, drinking behavior, and involuntary dehydration. Medicine & Science in Sports & Exercise, 24, 645–656.
Haveman-Nies. A., de Groot, L. C., & Van Staveren, W. A. (1997). Fluid intake of elderly Europeans. Journal of Nutri-tion, Health and Aging, 1, 151–155.
Hooper, L., Bunn, D., Jimoh, F. O., & Fairweather-Tait, S. J. (2014). Water-loss dehydration and aging. Mechanisms of Ageing and Development, 136–137, 50–58.
Institute of Medicine of the National Academies. (2005). Dietary reference intakes for water, potassium, sodium, chlo-ride, and sulfate. Washington, DC: The National Acad-emies Press.
International Physical Activity Questionnaire. (2005). Guide-lines for data processing and analysis of the International Physical Activity Questionnaire (IPAQ) – short and long forms (revised in November 2005). Retrieved from https:// sites.google.com/site/theipaq/scoring-protocol
Kavouras, S. A. (2002). Assessing hydration status. Cur-rent Opinion in Clinical Nutrition and Metabolic Care, 5, 519–524.
Kleiner, S. M. (1999). Water: An essential but overlooked nutrient. Journal of the American Dietetic Association, 99, 200–206.
Malisova, O., Bountziouka, V., Panagiotakos, B., Zampelas, A., & Kapsokefalou, M. (2013). Evaluation of seasonality on total water intake, water loss and water balance in the general population in Greece. Journal of Human Nutrition and Dietetics, 26(Suppl. 1), 90–96.
Matějovská, H. (2012). Návrat k vodě [Back to water]. Med-icína pro Praxi, 9, 302–306.
National Academies of Sciences, Engineering, and Medicine. (2016). Meeting the dietary needs of older adults: Exploring the impact of the physical, social, and cultural environment: Workshop summary. Washington, DC: The National Acad-emies Press.
Nissensohn, M., Castro-Quezada, I., & Serra-Majem, L. (2013). Beverage and water intake of healthy adults in some European countries. International Journal of Food Sciences and Nutrition, 64, 801–805.
Nissensohn, M., Sánchez-Villegas, A., Ortega, R., Aranceta-Bartrina, J., Gil, Á., González-Gross, M., … Serra-Majem, L. (2016). Beverage consumption habits and association with total water and energy intakes in the Spanish popula-tion: Findings of the ANIBES Study. Nutrients, 8, 232–250. Pelclová, J., Vašíčková, J., Frömel, K., Djordjevic, I., Bláha,
L., Feltlová, D., … Šebrle, Z. (2008). Vliv demografických faktorů na pohybovou aktivitu a sezení u obyvatel České republiky ve věku 55–69 let [Influence of socio-demo-graphic and environmental factors on physical activity of inhabitants of the Czech Republic aged 55–69]. Tělesná kultura, 31(2), 109–119.
Sawka, M. N., Burke, L. M., Eichner, E. R., Maughan, R. J., Montain, S. J., & Stachenfeld, N. S. (2007). Exercise and fluid replacement. Medicine & Science in Sports & Exercise, 39, 377–390.
Siervo, M., Bunn, D., Prado, C., & Hooper, L. (2014). Accu-racy of prediction equations for serum osmolarity in frail older people with and without diabetes. American Journal for Clinical Nutrition, 100, 867–876.
Stookey, J. D. (2005). High prevalence of plasma hypertonic-ity among communhypertonic-ity-dwelling older adults: Results from NHANES III. Journal of the American Dietetic Association, 105, 1231–1239.
Suhr, J. A., Hall, J., Patterson, S. M., & Niinistö, R. T. (2004). The relation of hydration status to cognitive per-formance in healthy older adults. International Journal of Psychophysiology, 53, 121–125.
Warburton, D. E. R. (2006). Health benefits of physical activity: The evidence. Canadian Medical Association Jour-nal,174, 801–809.
Wittmannová, J., Klimešová, I., & Piňosová, L. (2018). Impact of physical activity on quality of life in Czech older adults. Journal of Exceptional People, 1(12), 25–36. World Health Organization. (n.d.). Global strategy on diet,
physical activity and health. Retrieved from https://www. who.int/dietphysicalactivity/factsheet_adults/en/
World Health Organization. (2005). Nutrients in drinking water. Geneva. Switzerland: Author.