HPLC method development and validation for simultaneous determination of lamivudine and tenofovir in tablet dosage
9
0
0
Full text
(2) Vishnumanikandan N. et al / Int. J. of Pharmacy and Analytical Research Vol-4(3) 2015 [193-201]. Both Lamivudine and Tenofovir active substances interfere with enzymes used by HIV and thereby blocking the reproduction of the virus. Antiviral medicines used for HIV infection are known as antiretrovirals. To prevent the virus from becoming resistant, Lamivudine and Tenofovir Disoproxil Fumarate tablets should always be given in combination with other antiretrovirals when treating HIV. Literature survey reveals different methods for their analysis in formulations [2-10]. Our present plan is to develop a new, simple, precise RP-HPLC method and validated the same as per ICH norms [11-12].. phosphoric acid of AR Grade supplied by Rankem, were used during the study. BUFFER PREPARATION Accurately weighed 1.41gm of sodium dihydrogen ortho phosphate in a 1000mL of volumetric flask, add about 900mLof HPLC grade Water and sonicate for few minute to degas and finally make up the volume with HPLC water and then the pH was adjusted to 4.0 with dil.ortho phosphoric acid. STANDARD PREPARATION Accurately Weighed and transferred 30mg of Lamivudine and Tenofovir working Standards into a 10mL-1 clean dry volumetric flask separately, add 3/4 th amount of diluent, sonicated for 30 minutes and make up to the final volume with diluents. From the above stock solution, 1 mL-1 was pipette out in to a 10 mL-1 volumetric flask and then make up to the final volume with diluents.. EXPERIMENTAL MATERIALS AND METHODS APPARATUS AND SOFTWARE Chromatography measurements were achieved using waters alliance equipped with a waters 2695 separations module, and waters 2996 PDA detector. The system was controlled through a system controller. The data acquisition was performed by the empower-2 software. The mobile phase was degassed using power sonic sonicator (Hwashin technology, seoul, korea). Absorbance spectra were recorded by using an UV visible spectrophotometer (Model UV-1800, Japan) employing quartz cell of 1.00 cm of path length (Fig 2). The rest of the calculations for the analysis were performed by use of micro soft excel 2007software (Microsoft,USA).. SAMPLE PREPARATION Prepare standard stock solutions of both the drugs as given above. Locally available marketed formulations contain 300mg of Lamivudine and 300mg of Tenofovir Disoproxil Fumarate was taken. From the formulation prepare the sample stock solution of 1.5mgmL-1 .Further 0.5 mL was taken from the sample stock solution into a 10mL volumetric flask and made up with diluents. CHROMATOGRAPHIC CONDITIONS Chromatographic separations were achieved using C18 analytical Column, Hypersil BDS (250x4.6mm,5). The mobile phase consists of Phosphate Buffer (pH4.0±0.5) and Acetonitrile taken in the ratio 50:50. The injection volume of sample was 10L. The mobile phase was degassed by ultra sonication before pumping into HPLC system. The flow rate was set at 1.0mLmin-1 and the wavelength 260nm was selected for detection and the corresponding UV-overlay spectrum was shown in the fig.2. The column temperature was maintained at 30ºC.. CHEMICALS AND REAGENTS Working standard of LMV and TNF were donated by Pharma Analytical labs, Puducherry. Tablet dosage form was procured from local market with the brand name Lamivir HBV containing 300mg of Lamivudine by cipla and 300mg of Tenofovir with the brand name Viread by Gilead Sciences. HPLC Grade Water and Acetonitrile were of HPLC grade supplied by Merck, sodium dihydrogen ortho phosphate and ortho. 1.60. 1.40. 270.8. 1.20. AU. 1.00. 0.80. 0.60. 260.2 0.40. 0.20. 0.00 220.00. 240.00. 260.00. 280.00. 300.00 nm. 320.00. 340.00. 360.00. 380.00. Fig.2: UV- Overlay Spectrum of LMV and TNF www.ijpar.com. ~194~.
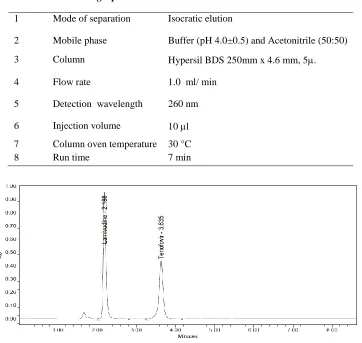
(3) Vishnumanikandan N. et al / Int. J. of Pharmacy and Analytical Research Vol-4(3) 2015 [193-201]. Lamivudine and 3.63 for Tenofovir. Table.No:1 shows the best optimum separation condition and the corresponding chromatograms shown in Fig. 3.. METHOD DEVELOPMENT Several trials were performed for the method development and the best peak with least fronting factor was found to be the seventh trail with RT for 2.18. Table 1: Optimum chromatographic separation conditions Sl. No.. Chromatographic conditions. 1. Mode of separation. Isocratic elution. 2. Mobile phase. Buffer (pH 4.0±0.5) and Acetonitrile (50:50). 3. Column. Hypersil BDS 250mm x 4.6 mm, 5.. 4. Flow rate. 1.0 ml/ min. 5. Detection wavelength. 260 nm. 6. Injection volume. 10 l. 7 8. Column oven temperature Run time. 30 °C 7 min. Fig. 3: Chromatogram corresponding to synthetic mixtures of LMV and TNF METHOD VALIDATION Validation of final assay condition was carried out by analyzing the synthetic mixtures of two analyzed drugs based on the principles of validation described in the ICH guidelines “Text on Validation of Analytical Procedures and Q2B”,” Validation of Analytical Procedures: Methodology”. Key analytical parameters, including specificity, accuracy, precision, linearity, detection limit and quantitation limit were evaluated [12].. SYSTEM SUITABILITY System suitability tests are an integral part of liquid chromatographic method. These tests are used to verify that the chromatographic system is adequate for the intended analysis. The system suitability test was performed for theoretical plates (not less than 2000) and tailing factor (less than 2), the results were within the acceptable limit are summarized in Table 2.. www.ijpar.com. ~195~.
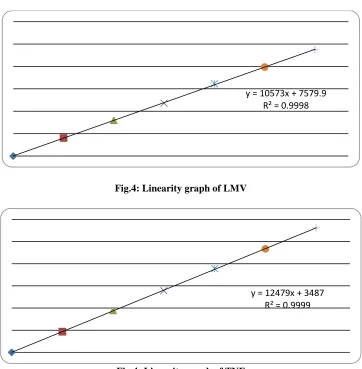
(4) Vishnumanikandan N. et al / Int. J. of Pharmacy and Analytical Research Vol-4(3) 2015 [193-201]. Table 2: System Suitability data of LMV and TNF Sl. No Parameters. Lamivudine Tenofovir Acceptable criteria. 1. Tailing Factor. 1.30. 0.89. Less than 2. 2. Theoretical plates 5200. 6834. Not less than 2000. 3. Retention Time. 2.183. 3.643. Less than 10. 4. Average Area. 4497652. 3171539. -. 0.37. 0.63. Less than 2 %. % RSD. were found to be linear in the range of 75-450 ppm for Both LMV and TNF. The regression equation of calibration curves were y=10573x+7579.9 for LMV and y=12479x+3487 for TNF respectively and the corresponding calibration graphs were shown in fig.4.. LINEARITY AND CALIBRATION CURVE The linearity of an analytical procedure is its ability (within a given range) to obtain test results which are directly proportional to the concentration (amount) of analyte in the sample. Linearity experiments were performed for both the components and the response. y = 10573x + 7579.9 R² = 0.9998. Fig.4: Linearity graph of LMV. y = 12479x + 3487 R² = 0.9999. Fig.4: Linearity graph of TNF www.ijpar.com. ~196~.
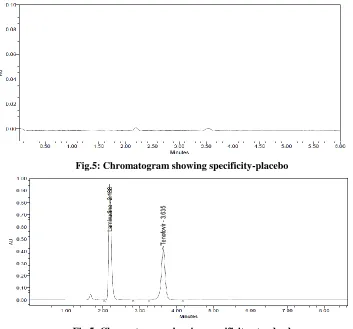
(5) Vishnumanikandan N. et al / Int. J. of Pharmacy and Analytical Research Vol-4(3) 2015 [193-201]. of standard and sample are identical with nearly same retention time. No interference due to placebo, mobile phase and sample at the retention time of analyte which shows that the method was specific [Fig.5].. SPECIFICITY Specificity is the ability to assess unequivocally the analyte in the presence of components, which may be expected to be present. In this study, the chromatograms. Fig.5: Chromatogram showing specificity-placebo. Fig.5: Chromatogram showing specificity-standard different levels: intra-day and inter-day precisions. Precision data representing the % CV values for both intra-day and inter-days were less than 2.0%, this indicates that the proposed method is precise [Table.3].. PRECISION Precision is the measure of the degree of repeatability of an analytical method under normal operation, and is normally expressed as the percent coefficient of variation (%CV). Precision may be performed at two. Table 3: Inter-day and Intra-day Precision data of LMV and TNF S.No. Parameters. Inter day. Intraday. LMV. TNF. LMV. TNF. 1 2. Retention time Avg. peak area. 2.188 4480415. 3.607 3151162. 2.183 4490319. 3.585 3163663. 3 4. SD %RSD. 13158 0.3. 11343.9 0.4. 4984.2 0.11. 17908.5 0.56. www.ijpar.com. ~197~.
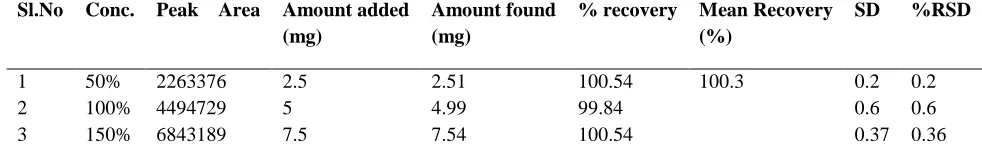
(6) Vishnumanikandan N. et al / Int. J. of Pharmacy and Analytical Research Vol-4(3) 2015 [193-201]. formulation. The % recovery of analytes at each concentration (n = 3) and mean % recovery (n = 9) for each analyte were determined. In this respect, the mean recovery (n = 3) at each concentration should be within the acceptance criteria of bias, ±2% [Table 4].. ACCURACY The accuracy of the method was determined by recovery experiment. Accuracy was determined by performing the recovery experiment at 50%, 100% and 150% of the target analyte concentration in the commercial. Table 4: Showing accuracy data of LMV and TNF Accuracy for LMV Sl.No. Conc.. Peak Area. Amount added (mg). Amount found (mg). % recovery. Mean Recovery (%). SD. %RSD. 1 2 3. 50% 100% 150%. 2263376 4494729 6843189. 2.5 5 7.5. 2.51 4.99 7.54. 100.54 99.84 100.54. 100.3. 0.2 0.6 0.37. 0.2 0.6 0.36. Accuracy for TNF Sl.No.. Conc.. Peak Area. Amount added (mg). Amount found (mg). % recovery. Mean Recovery (%). SD. %RSD. 1 2 3. 50% 100% 150%. 1600504 3167098 4764721. 2.5 5 7.5. 2.52 4.98 7.5. 100..82 99.7 100.06. 100.19. 0.2 0.09 0.05. 0.2 0.09 0.05. standard solutions were found to be 2.79µg.mL-1 and 7.17µg.mL-1 respectively.. LIMIT OF DETECTION Limit of Detection (LOD) is the lowest concentration of an analyte in a sample that can be detected but not quantified. LOD is expressed as a concentration at a specified signal to noise ratio. The LOD will not only depend on the procedure of analysis but also on the type of instrument. In chromatography, detection limit is the injected amount that results in a peak with a height at least twice or thrice as high as baseline noise level. The LOD for LMV and TNF standard solutions were found to be 0.92µg.mL-1 and 2.37µg.mL-1 respectively.. ROBUSTNESS The robustness of an analytical procedure is a measure of its capacity to remain unaffected by small, but deliberate variations in method parameters and provides an indication of its reliability during normal usage. In the present work Robustness of the method was determined by making slight changes in the composition of mobile phase ± 2 %, flow rate by ±0.2 mL-1 and temperature by ± 2ºC. It was observed that were no marked changes in the retention time and area of the chromatograms and the % RSD was less than 2 %, which demonstrated that the RP-HPLC method developed was robust.. LIMIT OF QUANTIFICATION Limit of Quantification (LOQ) is defined as lowest concentration of analyte in a sample that can be determined with acceptable precision and accuracy and reliability by a given method under stated experimental conditions. LOQ is expressed as a concentration at a specified signal to noise ratio. In chromatography, limit of quantification is the injected amount that results in a peak with a height, ten times as high as base line noise level. The LOQ for Moxifloxacin and Bromofenac. RESULTS AND DISCUSSIONS The last step of the present study was to check method’s validation for specificity, linearity, accuracy, intra/interday precision, and robustness. All the validation parameters were found to be well within the acceptance criteria, Table 5. The system suitability parameters also. www.ijpar.com. ~198~.
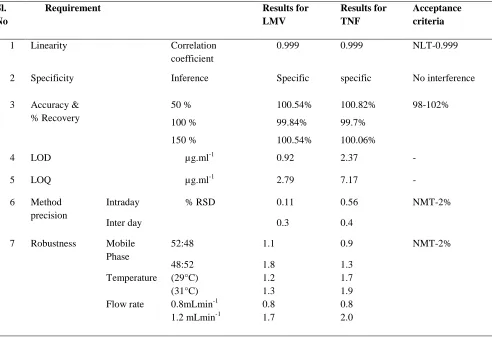
(7) Vishnumanikandan N. et al / Int. J. of Pharmacy and Analytical Research Vol-4(3) 2015 [193-201]. reveals that the values within the specified limit for the proposed method. Theoretical plates and tailing factor for LMV and TNF were found to be NLT 2000 and NMT 2.0 respectively. The developed HPLC method was specific in relation to the placebo. All placebo chromatograms showed no interference peaks. An excellent linearity was established at six levels in the range of 75-450 µgmL-1 for both LMV & TNF with R2 of more than 0.999 for both the analytes. The LOD and LOQ were estimated as 0.92 and 2.79 µgmL-1 for LMV, 2.37 and 7.17 µgmL-1 for TNF respectively. Accuracy (n = 9), assessed by spike recovery, were found to be 100.03 and 100.19 % for LMV and TNF respectively, which were within acceptable ranges of 100 ± 2%. The intra and inter-assay precision (n = 6) was confirmed. since, the %C.V. were well within the acceptable limit of ≤ 2 and ≤ 3, respectively. Robustness study reveals that small changes did not alter the retention times, retention factor and resolution more than 2% and therefore it would be concluded that the method conditions are robust. From the above results, it was concluded that, the method was accurate, reproducible, repeatable, linear, precise and selective, proving reliability of method. The run time is relatively short i.e., 4.0 min which enables rapid quantitation of many samples in routine quality control analysis. These results show the method could find practical application as a quality control tool for estimation of the LMV and TNF in quality control laboratories.. Table 5: VALIDATION PARAMETERS FOR LMV AND TNF Sl. No. Requirement. Results for LMV. Results for TNF. Acceptance criteria. 1. Linearity. Correlation coefficient. 0.999. 0.999. NLT-0.999. 2. Specificity. Inference. Specific. specific. No interference. 3. Accuracy & % Recovery. 50 %. 100.54%. 100.82%. 98-102%. 100 %. 99.84%. 99.7%. 150 %. 100.54%. 100.06%. -1. 0.92. 2.37. -. 4. LOD. µg.ml. 5. LOQ. µg.ml-1. 2.79. 7.17. -. 6. Method precision. Intraday. % RSD. 0.11. 0.56. NMT-2%. 0.3. 0.4. Robustness. Mobile Phase. 7. Inter day. Temperature Flow rate. 52:48. 1.1. 0.9. 48:52 (29°C) (31°C) 0.8mLmin-1 1.2 mLmin-1. 1.8 1.2 1.3 0.8 1.7. 1.3 1.7 1.9 0.8 2.0. NMT-2%. assayed by the proposed HPLC method. 5 tablets were weighed and calculate the average weight of each tablet then the weight equivalent to 5 tablets was transferred. APPLICATION OF THE METHOD Commercial products Lamivir HBV (300mg) (LMV) and Viread (300mg) (TNF) with the brand name were. www.ijpar.com. ~199~.
(8) Vishnumanikandan N. et al / Int. J. of Pharmacy and Analytical Research Vol-4(3) 2015 [193-201]. into a 250 ml volumetric flask, 200ml of diluent added and sonicated for 30 min, further the volume made up with diluent and filtered. From the filtered solution 0.5ml was pipetted out into a 10 ml volumetric flask and made upto 10ml with mobile phase. The solution was injected through 10μl loop system and chromatograms were obtained at flow rate of 1.0 mLmin-1. The concentrations of both solutions were measured at. 260nm and representative chromatograms are presented in (Fig.6). The percentage of drug content was calculated for MOX and BRO, which showed a Good agreement between the assay results and the label claim of the product. The %C.V. for both formulations was < 2, indicating the precision of the analytical methodology.. Fig.6: Assay of Lamivudine and Tenofovir proposed method. The LMV and TNF analytes were well resolved and separated within 4 min. Hence this method can be applied for the simultaneous quantification of both LMV and TNF in tablet dosage form in routine analysis. This presentation in conjugation with the articles written on the subject hopefully provides a reasonably clear depiction of the current state of the art in development and validation of RP-HPLC method for the estimation of LMV and TNF.. CONCLUSION The evaluation of obtained values suggests that the proposed method is simple, fast and cost effective for the simultaneous estimation of LMV and TNF tablet dosage form. The mobile phase is simple to prepare and economical. The proposed method was validated for the various experimental parameters according to ICH guidelines. Influence of the mobile phase, column oven temperature and flow rate was evaluated for the. REFERENCES 1.. 2. 3. 4. 5. 6. 7. 8. 9.. Bojja Soumya, Thimmaraju Manish Kumar and Nerella Raghunandhan. Simultaneous Determination of Tenofovir disoproxil fumarate and Lamivudine by UV Spectro photometric Method. International Journal of Pharmacy and Pharmaceutical Science Research, 2012; 2(1): 9-15. Anandakumar Karunakaran et al., An Eurasian Journal of Analytical Chemistry, Vol 7, issue 2, page 56-66, 2012. Bojja Soumya et al, an International Journal of Pharmacy and Pharmaceutical Science Research, Vol 2, issue 1, 2012. Goud et al., an International Journal of Pharmacy and Pharmaceutical Sciences, Vol 5, Suppl 3, page 215-218, 2013. Anandakumar Karunakaran, Der Pharmacia Lettre, Vol 2, issue 5, 2010. Hymavathi.K, an International Journal of Applied Pharmaceutical Sciences and Biomedical Sciences, Vol 1, isuue 3, pages 277-284, July-Sept2012. Ashok Gorja, an International Journal of Advanced Research in Pharmaceutical and Bio Sciences, Vol 2, issue 1, page 22-32, 2012. Panzade P.S., Asian Journal of Biomedical and Pharmaceutical Sciences, Vol 3, issue 16, page 27-30, 2013. Vajrapu et al, an International Journal of Pharmacy, Vol 4, issue 1, page 175-182, 2014. www.ijpar.com. ~200~.
(9) Vishnumanikandan N. et al / Int. J. of Pharmacy and Analytical Research Vol-4(3) 2015 [193-201]. 10. P. Chandra et al, Journal of Chilean Chemistry Society, Vol 56, No 2, page 702-705, 2011.. 11. Synder K.L, Krikland J.J and Glajch. J.L: Practical HPLC Method Development 2nd Edn, Wiley-Interscience Publication, USA, 1983; 1-10.. 12. International conference on harmonization “Validation of Analytical Procedures Methodology”, 14, Federal Register Nov.1996; 1-8.. www.ijpar.com. ~201~.
(10)
Figure
+2
Related documents
Patients with inflammatory bowel disease (IBD) may have increased risk of developing CDI, along with worse outcomes, higher rates of colectomy and higher rates of recurrence
AGDL: Agglomerative clustering on a directed graph; AGMFit: Affiliation graph model fitting; CD: Community discovery; CDlib: Community discovery library; CDTB: Community
attenuated virus, as it is clear from the tissue culture studies that this virus replicates well; direct comparisons in which the two isolates are used to infect a compatible cell
In contrast, PAM incubated 1 h with EPI300 (pMCH-vtaA8 pEGFP) or EPI300 (pMCH-vtaA9 pEGFP) showed a lower percentage of macrophages with fluores- cent bacteria than the control with
Prenatal signs typically associated to PCH were reported in 10 children: microcephaly was detected in 4 children by cranial ultrasound at a gestational age between 32 and 35 weeks, in
This study was conducted to examine the difference in shape of male and female upper and lower dental arches, as well as the difference in their transversal and longitu- dinal
Similarly, in a purposive sample of 12 written decisions of the Ontario Consent and Capacity Board (CCB) in which there were conflicts between phy- sicians and substitute
We are focusing in this sections on the different ways we can create links of social networks directly derived from the analysis of the video data.. Most of the following networks
