Vol. 5, No. 2 (2015): 1002-1006 Research Article
Open Access
I
ISSSSNN:: 22332200--66881100
Bioanalytical Method Development and Validation
for the Quantitation of Nevirapine in Human K2 EDTA
Plasma by using LC-MS/MS
Rajesh Kumar Suvvaru*, K. Madhusudhan, D. Ramesh, K. Suresh and O. Durga Suresh
ClinSync clinical Research Pvt. Ltd., Hayatnagar, Hyderabad, India.
* Corresponding author: Rajesh Kumar Suvvaru; e-mail: [email protected]
ABSTRACT
A simple and sensitive liquid chromatography Tandem mass spectroscopy LCMS/MS method for the determination of Nevirapine in human plasma was developed and validated to support the pharmacokinetic studies. Nevirapine D5 is used as internal standard and liquid liquid extraction (LLE) was employed as the extraction technique with the sample volume of 5 μl. 10 mM ammonium acetate buffer and methanol in the ratio of 10:90 was used as mobile
phase using Purospher RP- C18 (5µm); 100×4.6mm column for chromatographic separation. ESI/MSMS in the positive mode with the mass transitions (m/z) of 267.1/226.1 for Nevirapine was used for detection. The method
linearity range was established as 50 to 10000 ng/ml for Nevirapine with the weighting factor of 1/X2. The method
was validated as per the regulatory guidelines and the results of the method validation were in compliance to the
acceptable limits specified by the regulatory guidelines confirming the method readiness for the pharmacokinetic
studies.
Keywords:
Human plasma, LC/MS/MS, Linearity range, Liquid-Liquid Extraction, Nevirapine, Recovery, Validation.1. INTRODUCTION
Nevirapine 200 mg tablet is indicated for the treatment of HIV-1 infection [1] in combination with other antiretroviral agents. Nevirapine 200 mg is not indicated for use in patients with clinically significant hypersensitivity to Nevirapine or to any of the components contained in the formulation. It is recommended that therapy is given only on the advice of an HIV experienced physician
Nevirapine was the first member of the non-nucleoside reverse transcriptase inhibitor class to be approved for
the treatment of HIV infection. It binds directly to the allosteric site on the reverse transcriptase and inhibits the activity of both RNA- and DNA-dependent DNA Polymerases.
Analytical methods [2-15] so far reported for quantification of Nevirapine by using HPLC and LCMS/MS is limited to some range 10 to 5000 ng/ml, Nevirapine with 200mg dose has Cmax about 2.2 to 3µg/mL [16, 17] including both fasting and fed conditions, in order to develop a method for all the doses of Nevirapine including 400mg we have developed a method with extended linearity range of 50 to 10000ng/mL
No analytical method was reported with range of 50 to 10000ng/mL We now report the high Sensitive LC-MS-MS method developed and validated for Nevirapine in human plasma with Nevirapine D5 as internal standard using Liquid-Liquid Extraction.
2. MATERIALS AND METHODS
Nevirapine (C15H14N4O) commercially procured from Clearsynth. All the solvents used are HPLC grade, Formic acid, MTBE, Water and Methanol were obtained from Merck. Ammonium Acetate is GR grade obtained from Merck. Drug free and healthy plasma was obtained from ASK diagnostics and laboratories, Hyderabad.
2.1 Data processing:
Chromatograms were acquired on API4000 Tandem mass spectrometry equipped with electro spry ionization (ESI) and connected to PC run with the standard software “Analyst” version 1.6.2. The calibration curve is constructed by weighted 1/x2 least-square linear regression analysis of the peak area ratio (drug/ISTD).
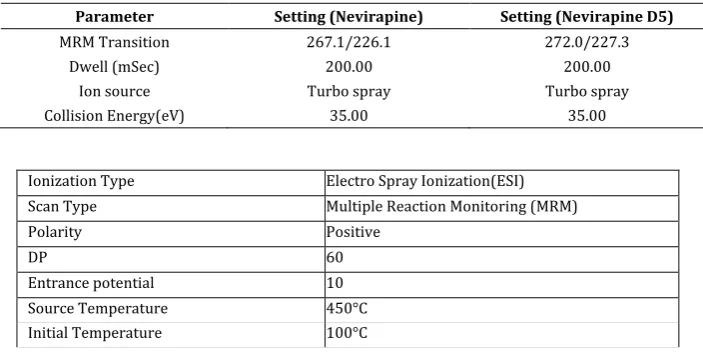
Table 1: Instrument Parameters
Parameter Setting (Nevirapine) Setting (Nevirapine D5)
MRM Transition 267.1/226.1 272.0/227.3
Dwell (mSec) 200.00 200.00
Ion source Turbo spray Turbo spray
Collision Energy(eV) 35.00 35.00
2.2 Standard solutions preparation 2.2.1 Stock solution preparation:
10.0263mg of Nevirapine is weighed and dissolved in 2ml of methanol then final volume is adjusted to 5ml with methanol in 5ml volumetric flask.
2.2.2 Preparation of Internal standard solution: Preparation of ISTD Stock Solution (200µg/mL): 1.1445mg of “Nevirapine-D5”is weighed and dissolved in 0.5ml of methanol and volume adjusted to 5ml in volumetric flask of 5ml.the final concentration of solution is approximately 200µg/ml
Preparation of ISTD working solution (5.0µg/mL): Take 0.625ml of ISTD stock solution (200µg/ml) pipetted out into 25 mL volumetric flask and made up the volume with the Diluent and the solution was mixed well.
2.2.3 Preparation of calibration curve standards and quality control samples:
In order to prepare the working standard solution in the range of 12ng/mL, appropriate dilutions of the stock solutions with diluents were made. All the solutions were stored in a refrigerator between 2 to 8°C. Calibration standards and Quality control samples were prepared in the range of 50- 10000ng/mL Assessment of Accuracy and precision, Quality control and Stability were done by spiking 0.200ml of drug free plasma with appropriate volume of working solution.
2.2.4 Sample preparation:
Retrieve the frozen CC, QC samples from the deep freezer and thaw in water bath maintained at room temperature. Vortex to mix the samples. Into the
pre-labeled Ria vials aliquot 200µL of CC and QC samples. Add 50µL of internal standard to followed by 100µL of 1% Formic acid solution. Now add 2.5mL of extraction solvent methyl tert.-butyl ether (MTBE) Vortex all the samples and centrifuge at 4500rpm at 4°C for 5mins. Separate the supernatant solution into other vials and evaporate to dryness under 20 psi pressure at 45°C and reconstitute in 1ml Mobile phase of (90:10) Methanol: 10mM Ammonium acetate.
RESULTS AND DISCUSSION
3.1 Chromatographic and mass conditions
LCMS/MS system of API 4000 with Electro Multi Detector is used for analysis. The instrument is operated in the positive mode. The precursor [M.H]+ ions at m/z 267.1,272.0 for Nevirapine and ISTD are selected by the first quadrapole (Q1), After collision-induced fragmentation in Qz, the product ions at m/z 226.1,227.3 for Nevirapine and ISTD are monitored in Q3. A resolution of one unit (at half peak height) is used for both Q1 and Q3.
3.2 Assay validation
The main objective of the validation of this analytical procedure is to demonstrate that it is suitable for its intended purpose.
3.3 Specificity and selectivity
SOBM of the LC-MS/MS method was established by screening the standard blanks of different lots of commercially available human plasma. Ten different lots of plasma were screened for the SOBM experiment. Out of Ten, six batches were of intended anticoagulant plasma (In-house ID: hpm/14/002, hpm/14/003, Ionization Type Electro Spray Ionization(ESI)
Scan Type Multiple Reaction Monitoring (MRM)
Polarity Positive
DP 60
Entrance potential 10
Source Temperature 450°C
hpm/14/004, hpm/14/005, hpm/14/006, hpm/14/007, two of hemolytic plasma (In-house ID: hpm/14/015, hpm/14/016) and two of Lipidemic plasma (In-house ID: hpm/14/017, hpm/14/018). All the investigated human plasma lots were found to be free of significant interferences at the retention time of drug and ISTD (i.e. area of the peak at the retention time of drug in standard blank samples was ≤ 20.00 % of the area of the drug in the extracted LLOQ sample; area of the peak at the retention time of ISTD in standard blank samples was ≤ 5.00 % of the area of the ISTD in the extracted LLOQ sample) Plasma lots (In-house ID: hpm/14/002, hpm/14/003, hpm/14/004 and hpm/14/005) were pooled and used as a blank matrix to prepare calibration curve standards and quality control samples.
3.4 Linearity
The relationship between the experimental response value and the analytical concentration from which the concentrations of QC samples and unknown samples may be determined.
The linearity experiment was performed using Calibration curve standards and plotted a curve between experimental response and the analytical concentration
• The correlation coefficient (r) was observed to be ≥ 0.9981 during the course of validation. • The overall % mean accuracy for the CC
standards was found to be in between 93.9-106.1%.
• Overall precision was ≤ 3.6 %.
3.5 Recovery
The % mean recoveries were determined by measuring the responses of the extracted plasma quality control
samples against post extracted quality control samples at HQC, MQC, and LQC levels. The % mean recovery for Nevirapine at HQC, MQC and LQC levels was found to be 100.5, 108.5 and 98.9 % respectively. Over all % CV at all QC levels was 2.0 and the % mean recovery for Internal Standard was found to be 92.2%.
3.6 Precision and accuracy Within Batch Precision
The % CV of back calculated concentrations for all quality control samples of LQC, MQC and HQC concentration levels were ranged from 0.60 to 4.97 % and the % CV of back calculated concentrations for all the samples of LLOQ QC were ranged from1.94to 7.1%.
Between Batch Precision
The % CV of back calculated concentrations for all quality control samples at LQC, MQC and HQC concentration levels were ranged from 1.60 to 3.56 % and the % CV of back calculated concentrations for all the samples of LLOQ QC were found to be 5.21 %.
Within Batch Accuracy
The % mean accuracy of back calculated concentrations for all quality control samples at LQC, MQC and HQC concentration levels were ranged 97.04 to 104.95 % and the % mean accuracy of back calculated concentrations for all the samples of LLOQ QC were ranged from 96.52 to 101.53 %.
Between Batch Accuracy
The % mean accuracy of back calculated concentrations for all quality control samples at LQC, MQC and HQC concentration levels were ranged from 97.75 to 103.08 % and the % mean accuracy of back calculated concentrations for all the samples of LLOQ QC was found to be 100.13 %.
Table 2: Results of Precision and Accuracy
HQC MQC LQC LLOQQC
Nominal conc. Nevirapine (ng/mL) 8501.400 4534.647 145.109 49.337 Intra-day accuracy (%) (day 1) 99.02 104.59 104.95 96.51 Intra-day precision (%) (day 1) 1.24 1.10 4.97 1.94 Intra-day accuracy (%) (day 2) 97.19 101.95 101.48 102.36 Intra-day precision (%) (day 2) 2.07 1.77 2.65 3.63 Intra-day accuracy (%) (day 3) 97.04 102.70 101.93 101.53 Intra-day precision (%) (day 3) 2.22 0.57 1.58 7.05
Overall accuracy (%) 97.75 103.08 102.78 100.13
Overall precision (%) 1.13 1.32 1.84 3.15
Number of determinations 18 18 18 18
3.7 Stability
3.7.1 Short Term Stock Solution Stability (STSS) for Analyte and ISTD
Short term stock solution stability for the Nevirapine was determined for period of 08hours 01 minutes at room temperature. Stability was assessed by comparing against the fresh stock concentration. The % mean accuracy for ULOQ and LLOQ was found to be 98.82 and 95.83. And the Short term stock solution stability for the ISTD was determined for period of 08
hours 03 minutes at room temperature. The Stability was assessed by comparing against the fresh stock concentration. The % mean accuracy for ISTD dilution was found to be 101.3.
3.7.2 Long Term Stock Solution Stability for Analyte and Internal Standard
comparing against the freshly weighed stock concentration. The % mean accuracy for ULOQ and LLOQ was found to be 97.6 and 101.5. And the Long term stock solution stability for the ISTD was determined for a period 6 days 5 hours and 15 minutes at 5 ± 3 °C. Stability was assessed by comparing against the freshly weighed stock concentration. The % mean accuracy for ISTD dilution was found to be 102.4.
3.7.3 Freeze Thaw Stability for Analyte
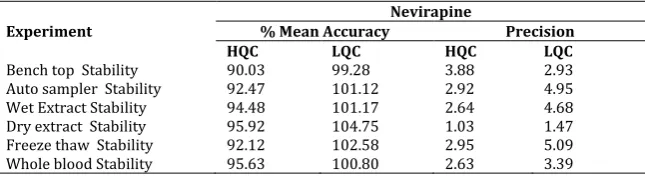
Freeze thaw stability of the spiked quality control samples was determined after 5 freeze thaw cycles stored at -30 °C ± 10 °C. Stability was assessed by comparing them against the freshly spiked calibration standards and quality control samples. The % mean accuracy for HQC and LQC was found to be 92.12 and 102.58% respectively.
3.7.4 Bench Top Stability for Analyte
Bench top stability of the spiked quality control samples was determined for a period of 10hours 49 min stored at room temperature. Stability was assessed by comparing them against the freshly spiked calibration standards and quality control samples. The % mean accuracy for HQC and LQC was found to be 90.03 and 99.28 % respectively.
3.7.5 Auto sampler Stability for Analyte
Auto sampler stability of the processed quality control samples was determined for a period of 45 hours 39 minutes by storing them in Auto sampler maintained at temperature 5 ±3 °C. Stability was assessed by
comparing against the freshly spiked calibration standards and quality control samples. The % mean accuracy for HQC and LQC was found to be 92.47 and 101.12 % respectively.
3.7.6 Wet Extract Stability at Room Temperature Wet extract stability of the spiked quality control samples was determined for a period of 18hours 02min by storing them at room temperature. Stability was assessed by comparing them against the freshly spiked calibration standards and quality control samples. The % mean accuracy for HQC and LQC was found to be 94.48 and 101.17% respectively.
3.7.7 Dry Extract Stability
Dry extract stability of the spiked quality control samples was determined for a period of 22 hours54min by storing them at -30 ±10 °C. Stability was assessed by comparing the stability samples against the freshly spiked calibration standards and quality control samples. The % mean accuracy for HQC and LQC was found to be 95.92 and 104.75 % respectively.
3.7.8 Analyte Stability in blood
Stability of analyte in blood was determined at room temperature for a period of 6 hours and 5 minutes. Stability was assessed by comparing them against the freshly prepared samples in blood. The % mean accuracy for HQC and LQC was found to be 95.63 and 100.80 % respectively.
Table 3: Stabilities Experiments
Experiment % Mean Accuracy Nevirapine Precision
HQC LQC HQC LQC
Bench top Stability 90.03 99.28 3.88 2.93 Auto sampler Stability 92.47 101.12 2.92 4.95 Wet Extract Stability 94.48 101.17 2.64 4.68 Dry extract Stability 95.92 104.75 1.03 1.47 Freeze thaw Stability 92.12 102.58 2.95 5.09 Whole blood Stability 95.63 100.80 2.63 3.39
4. CONCLUSION
Based on the experiments done during the course of validation, it is concluded that the intended method is validated for the estimation of Nevirapine in human plasma over the concentration range of 49.947 – 10152.769ng/mL using Nevirapine D5 as internal standard. The precision and mean accuracy are within the acceptable limits. Consistent recoveries are observed for HQC, MQC and LQC. The method is specific enough in the presence of K2EDTA anticoagulant. The method is precise and accurate enough to dilute the samples, if necessary. Based on the stability experiments carried out during the course of validation, it is concluded that the intended analyte is stable in all the performed experiments and the stability experiments performed are within the acceptance limits. This method is rugged on different column, different equipment and by different analyst.
5. Acknowledgements:
The authors are thankful to Quality Assurance manager, Dr. Raghunath Reddy and the management of ClinSync Clinical Research Pvt Ltd, Hyderabad, India for providing infrastructure, facility to carry out this work.
6. REFERENCES
1. Nevirapine Drug Profile-www.drugbank.ca/drugs/DB00495 2. M.Sathish Babu (2013), Development and Validation of a
Sensitive LCMS/MS method for the Determination of Stavudine, Lamivudine, Nevirapine in human plasma, International Journal Of Pharmaceutical Research and Bioscience, Volume 2(4).
3. Ghosh C, Gaur S, Singh A, Shinde CP, Chakraborty BS (2011) Estimation of Nevirapine from Human Plasma by ESI-LC-MS/MS: a Pharmacokinetic Application. J Bioequiv Availab 3: 020-025. doi:10.4172/jbb.1000052
nevirapine in human plasma by RP-LC. J. Pharm Biomed Anal. 29: 1081-1088.
5. Silverthorn CF, Parsons TL (2005) A validated new method for nevirapine quantitation in human plasma via high-performance liquid chromatography. Biomed. Chromatogr. 20: 23-27.
6. Kabra V, Agrahari V, Karthikeyan C, Trivedi P (2009) Simultaneous quantitative determination of zidovudine and nevirapine in human plasma using isocratic, reverse phase high performance liquid chromatography Trop. J Pharm Res. 8: 79-86.
7. van Heeswijk RP, Hoetelmans RM, Meenhorst PL, Mulder JW, Beijnen JH (1998) Rapid determination of nevirapine in human plasma by ion-pair reversed-phase high-performance liquid chromatography with ultraviolet detection. J Chromatogr B Biomed Sci Appl. 25: 395-399.
8. Ramachandran G, Hemanthkumar AK, Kumaraswami V, Swaminathan S (2006) A simple and rapid liquid chromatography method for simultaneous determination of zidovudine and nevirapine in plasma. J Chromatogr B 843: 339-344.
9. Venkata Kumar CH, Ananth Kumar D, Rao JVLNS (2010) A New Validated RPHPLC Method for the Determination of Nevirapine in Human Plasma. E-Journal of Chemistry 7: 821-826.
10. Kappelhoff BS, Rosing H, Huitema ADR, Beijnen JH (2003) Simple and rapid method for the simultaneous determination of the non-nucleoside reverse transcriptase inhibitors efavirenz and nevirapine in human plasma using liquid chromatography. J Chromatogr B 792: 353-362.
11. Zhou Li, Ding C, Qinghua G, Zhou Z, Zhi X, et al. (2010) Simultaneous determination of lamivudine, stavudine and nevirapine in human plasma by LC–MS/MS and its
application to pharmacokinetic study in clinic. Biomed Chromatogr.24: 926-934.
12. Notari S, Mancone C, Alonzi T, Tripodi M, Narciso P, Ascenzi P (2008) Determination of abacavir, amprenavir, didanosine, efavirenz, nevirapine, and stavudine concentration in human plasma by MALDI-TOF/TOF. J Chromatogr B 863: 249-257. 13. Chi J, Jayewardene AL, Stone JA, Aweeka FT (2003) An
LC-MS-MS method for the determination of nevirapine, a non-nucleoside reverse transcriptase inhibitor, in human plasma. J Pharm Biomed Anal 31: 953-959.
14. Laurito TL, Santagada V, Caliendo G, Oliveira CH, Barrientos-Astigarraga RE, et al.(2002) Nevirapine quantification in human plasma by high-performance liquid chromatography coupled to electrospray tandem mass spectrometry. Application to bioequivalence study. J Mass Spectrom 37: 434-441.
15. Pav JW, Rowland LS, Korpalski DJ (1999) HPLC-UV method for the quantitation of nevirapine in biological matrices following solid phase extraction. J Pharm Biomed Anal 20: 91-98.
16. Aspen Nevirapine 200 mg (Aspen), HA280; WHOPAR part 6 12/2006, version 1.0.
17. Nevirapine Tablets 200 mg (Aurobindo), HA287, WHOPAR part 6 12/2006, version 1.0.
*****
© 2015; AIZEON Publishers; All Rights Reserved