191
Effect of Corporate Taxation on the Profitability of Firms in NIGERIA
Olaoye, Clement Olatunji, Alade, Elizabeth Oluwatoyin
Department of Accounting, Faculty of Management Sciences, Ekiti State University, Ado-Ekiti, Nigeria [email protected], [email protected]
Abstract: The paper examined the effect of corporate taxation on the profitability of some selected firms in Nigeria from 2007 to 2016 using secondary data which was sourced from various publications of the firms’ financial report. The study employed pooled ordinary least square as the estimation technique. The analytical results revealed that the coefficient of corporate tax on profit after tax was positive with the value of 2.418830 and its P-values were 0.0000, the coefficient of value-added tax was 14.51298 and its p-value was 0.0000. Equally, the coefficient of withholding tax was positive with the value of 7.256489 with p-value 0.0000. Furthermore, education tax result depicts that the coefficient is 36.28245 and it p-value is 0.0000. However, the study concluded that corporate tax rate and education tax as the major taxes paid by companies have positive and significant effects to influence profit after tax. It is also clinched that value-added tax rate and withholding tax being used as other variables that could have effects on profit after tax equally revealed positive and significant effects on profit after tax. Therefore, the study recommended that the government and relevant tax authorities should improve in the administration of corporate taxes to avoid non-compliance
Keywords: Taxation, Corporate Taxation, Profit after Tax, Education Tax
1. Introduction
The engagement of government in providing social amenities in developmental projects is a compulsory phenomenon for the improvement of standard of living of the citizenry (Madugba, Ekwe & Kalu, 2015). This however necessitated the government to source for fund from various sources where corporate taxes are not left out. (Madugba, et al., 2015) defined tax as compulsory levies impose by the government of a nation on the income, profit and properties of both individuals and corporate bodies for the administration of the government which has no compensatory benefits. Taxation can either be direct or indirect paid by firm impact heavily on their performance (Nwaobia & Jayeoba, 2016). The direct taxes borne by companies can be company income tax, petroleum profit tax, capital gain tax, education tax, withholding tax etc. equally, the indirect taxes borne by the final consumer for the consumption of goods or services includes value-added tax, and custom and excise duties. However, corporate tax is charged on the profits generated by companies, public corporations and unincorporated associations such as industrial and provident societies, clubs and trade associations (Raza, Ali & Abassi, 2011).
In Nigeria, companies are mandated by law to pay company income tax on profit earned with 30%, education tax of 2%, withholding tax of 10% and value-added tax of 5% in the year/period preceding assessment. Relevant tax authorities includes Federal Inland Revenue Service, State Internal Revenue Service and Local Government Revenue Committee which collect taxes and other charges on behalf of Federal, State and Local government respectively (Madugba, et al., 2015). Corporations embark on corporate tax planning in other to mitigate tax liability legally. This is however expected to result in a positive impact on firm’s cash flow and increase its after-tax returns (Nwaobia & Jayeoba, 2016). Heavy tax burdens exerted negative impact on firm’s performance. And equally, Afuberoh and Okoye (2014) opined that revenue derived from taxation has been very low and no physical development has actually take place. Kiabel (2009) is of the view that the shocks from oil price contributes to the reduction of revenue generated by government in the recent years, this prompted the urgent need for government to generate revenue through taxation particularly corporate taxes. However, this study designed to examine the effects of corporate taxation on the profitability of some selected firms in Nigeria
2. Conceptual Issues
192
money by a civic authority for public determinations and prosperity. Whereas, Ojo (2008) stressed that taxation is a concept and the science of imposing a tax on citizens of a nation. Afuberoh and Okoye (2014) also considered taxation as a civic duty of the citizenry.
Corporate Tax: Corporate taxes are taxes regulated by companies income tax act (CITA, 1977). Corporate taxes are taxes directly paid by companies periodically to the government of a particular country or nation where it operates. The government imposes corporate taxes on the net profit of the corporations. Aransiola (2013) is of the view that corporate taxes are taxes paid by corporations based on the amount of profit generated. Corporate taxes are taxed on companies, public incorporations and unincorporated associations such as industrial and provident societies, clubs and trade associations Raza, Ali and Abassi (2011). The incidence of corporate tax on companies reduces the fund available for expansion, dividends re-investment, thereby decreases the goods or services produced by such company and also serves as a disincentive to the investing public Ezugwu and Akubo (2014).
Empirical Review: In the study of Riedel and Dischinger (2008), they examined corporate taxes and the location of intangible assets within multinational firms using Multinational Enterprises in Europe. The study found that the lower a subsidiary’s tax rate relative to other affiliates of the multinational group, the higher is its level of intangible asset investment. This effect is statistically and economically significant, even after controlling for subsidiary size and accounting for a dynamic intangible investment pattern. Arnold and Schwellnus (2008) examined the effects of corporate taxes on productivity and investment using a stratified sample of firms across OECD economies over the period 1996- 2004. The study found that corporate taxes have a negative effect on productivity at the firm level. The effect is negative across firms of different size and age classes except for the small and young, which may be attributable to the relatively low profitability of small and young firms. Raza, Ali and Abassi (2011) investigated the effect of corporate income tax and firms' size on investment: evidence by Karachi stock exchange using multiple regression analysis as a statistical technique for Panel financial Data on an annual basis gathered for the period of six years from 65 sample manufacturing companies.
Their results revealed that there is a negative relationship exists between corporate income tax and investment while firm size and investment reveals a positive relationship with each other. Furthermore, Beigi, Rafat and Panah (2013) investigated the analysis of the effect of the tax on profitability indices in listed companies of Tehran Stock Exchange using approach applied descriptive-analytic and the data of 28 companies listed in Tehran Stock Exchange from 2004 to 2010. The results pointed out a negative significant effect on various profitability indices. It equally indicated that the debts ratio to asset and the type of the industry showed a negative effect on profitability and capital ratio to asset and the size of the company indicated positive significant effects on profitability index. Gatsi, Gadzo and Kportorgbi (2013) investigated the effect of corporate income tax on the financial performance of listed manufacturing firms in Ghana. The study used panel data methodology covering ten listed manufacturing firms for over seven years. Their result revealed that there is a significant negative relationship between corporate income tax and financial performance. On the other hand, firms’ size, age of the firm and growth of the firm show a significant positive relationship with financial performance.
193
Conclusively, several studies have been conducted by previous researchers from developed and developing countries such as Raza, Ali and Abassi (2011); Beigi, Rafat and Panah (2013); Chude and Chude (2015); Maduga, Ekwe and Kalu (2015); Gatsi, Gadzo and Kportorgbi (2013); Riedel and Dischinger (2008); Ezugwu and Akubo (2014); and Arnold and Schwellnus (2008) relating to taxation and corporate taxes on profitability of manufacturing firms. Meanwhile, this study suggested to fill the gap by using Nigeria approved tax rate of 30% of corporate tax, 2% education tax, 5% value-added tax and 10% withholding tax on the profit before tax of the firms under study. Corporate tax and education tax are paid directly by the selected firms while value-added tax and withholding tax are used as other forms of tax that can also influence the profitability of manufacturing firms.
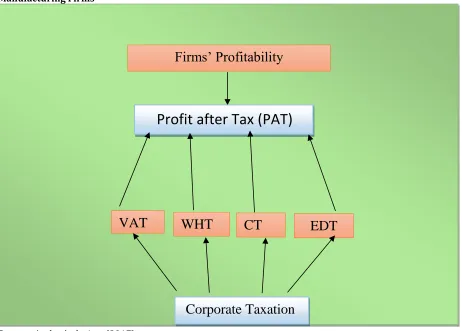
Figure 1: Conceptual Framework that Shows the Linkage between Corporate Taxes and Profitability of Manufacturing Firms
Source: Author’s design, (2017)
Where: PAT = Profit after tax, VAT = Value Added Tax, WHT = Withholding Tax, CT = Corporate Tax, EDT= Education Tax. The above figure 1.0 shows the link between dependable variable (profitability) and the independent variables (corporate tax). The proxies for corporate taxes are value added tax, withholding tax, corporate tax and education tax rate while that of profitability of some selected firms is measured by profit after tax (PAT).
3. Research Method
Model Specification: This study modified the work of Ezugwu and Akubo (2014) in examining the effect of high corporate tax rate on the profitability of corporate organizations in Nigeria – A Study of Some Selected Corporate Organization. Their model was specified as:
CP = f (CTR) ---1 Where:
Firms’ Profitability
Profit after Tax (PAT)
CT
WHT
VAT
Corporate Taxation
194
CP = Corporate ProfitabilityCTR = Corporate Tax Rates
This study therefore re-modified as stated below:
𝑃𝐴𝑇 = 𝑓(𝐶𝑇, 𝐸𝐷𝑇, 𝑉𝐴𝑇, 𝑊𝐻𝑇) − − − − − − − − − − − − − − − − − −3
Whereas;
PAT = Profit after Tax CT = Corporate Tax EDT = Education Tax VAT = Value Added Tax WHT = Withholding Tax
Estimation Techniques: The model specified in equation 3 is estimated with the use of panel method of econometric analysis. The econometric pooled regression form of the model is presented as follows:
𝑃𝐴𝑇𝑖𝑡 = 𝛽0− 𝛽1𝐶𝑇𝑖𝑡− 𝛽2𝐸𝐷𝑇𝑖𝑡+ 𝛽3𝑉𝐴𝑇𝑖𝑡+ 𝛽4𝑊𝐻𝑇𝑖𝑡+ μ𝑖𝑡− − − − − − − −4
Where:
μ = Error term i, t = Company i at time t
β0 = Constant parameter/Intercept
β1 – β4 = Coefficients of independent variables
The estimation techniques employed in this study are in the form of Panel analysis and the techniques included panel unit root and pooled OLS test in order to examine the effects of the corporate tax on the profitability of some selected firms in Nigeria. The reason for adopting this is because the data included time-series and cross-sectional.
Source of Data: The data used were mainly secondary sources from 2007 to 2016 which were sourced from various annual publication reports of the selected firms. The annual publication reports were reliable because firms are statutorily required to be audited before publication by the auditing firms.
4. Interpretation of Results, Findings and Discussion
Panel Unit Root Result: The Levin, Lin & Chu test was employed in order to analyze the stationarity of the variables. This enables us to determine in, comparative terms, the unit root among the time series also to obtain more robust results.
Table 1: Panel Unit Root at Level
Variables Statistic Prob.**
PAT -8.85973 0.0000
CT -8.29024 0.0000
EDT -8.29024 0.0000
VAT -8.29024 0.0000
WHT -8.29024 0.0000
Source: Authors’ Compilation (2018)
Table 2: Order of Integration
Variables Order of Integration
PAT 1(0)
CT 1(0)
EDT 1(0)
VAT 1(0)
WHT 1(0)
Source: Authors’ Compilation (2018)
195
which brings that all the variables are integrated of order zero I(0). The implication is that PAT, CT, EDT, VAT and WHT used in this study retain innovative shock for a short period of time after which they let go.
Pooled Ordinary Least Square
Table 3: PAT=f (CT) Dependent Variable: PAT
Variable Coefficient Std. Error t-Statistic Prob.
C -198977.8 159611.4 -1.246639 0.2146
CT 2.418830 0.029697 81.45121 0.0000
R-squared (R2) 0.978756 F-statistic 6634.299
Adjusted R-squared 0.978608 Prob(F-statistic) 0.000000
Source: Authors’ Compilation (2018)
Table 3 reveals profit after tax as a function of corporate tax. The results of statistical tools reveal that: the coefficient of multiple determination (R2) is 0.978756 (97.9%) implying that the corporate tax can be
accounted for over 97% variation to profit after tax while the remaining per cent is controlled by other factor; the F-test value is 6634.299 and the probability of F-statistic is 0.00000 that is the corporate tax (CT) can influence the dependent variable (PAT). The result also reveals that the coefficient of constant is negative with the value of -198977.8. This means that when the corporate tax is held constant, there will be a negative variation up to the tune of -198977.8 units to profit after tax (PAT). The result equally revealed that the coefficient of corporate tax on profit after tax is positive with the value of 2.418830 and its P-values are 0.0000 which implies that CT has a positive and significant effect on profit after tax in Nigeria that is if there is a unit increase in corporate tax profit after tax will increase with 2.418830.
Table 4: PAT=f (VAT) Dependent Variable: PAT
Variable Coefficient Std. Error t-Statistic Prob.
C -198977.8 159611.4 -1.246639 0.2146
VAT 14.51298 0.178180 81.45121 0.0000
R-squared (R2) 0.978756 F-statistic 6634.299
Adjusted R-squared 0.978608 Prob(F-statistic) 0.000000
Source: Authors’ Compilation (2018)
The result of profit after tax as a function of value added tax reveals in Table 4 shows that at constant, the value is negative with tune of -198977.8 and its p-value is 0.2146. This implies that when the value-added tax is held constant there is negative and insignificant effect on profit after tax. The coefficient of value-added tax is 14.51298 and its p-value is 0.0000. The implication is that value-added tax is positive and has a significant effect on profit after tax that is, if there is a unit increase in value-added tax, profit after tax will equally increase with the tune of 14.51298 simultaneously.
Table 5: PAT=f (WHT) Dependent Variable: PAT
Variable Coefficient Std. Error t-Statistic Prob.
C -198977.8 159611.4 -1.246639 0.2146
WHT 7.256489 0.089090 81.45121 0.0000
R-squared (R2) 0.978756 F-statistic 6634.299
Adjusted R-squared 0.978608 Prob(F-statistic) 0.000000
Source: Authors’ Compilation (2018)
196
companies remitted to the government which are being borne by the employee of the company and a unit increase in withholding tax will result to an increase in profit after tax with the tune of 7.256489.
Table 6: PAT=f (EDT) Dependent Variable: PAT
Variable Coefficient Std. Error t-Statistic Prob.
C -198977.8 159611.4 -1.246639 0.2146
EDT 36.28245 0.445450 81.45121 0.0000
R-squared (R2) 0.978756 F-statistic 6634.299
Adjusted R-squared 0.978608 Prob(F-statistic) 0.000000
Source: Authors’ Compilation (2018)
The Table above revealed profit after tax as a function of education tax (EDT) and the result depicts that education tax coefficient is 36.28245 and its p-value is 0.0000. The implication is that education tax has a positive and significant effects on profit after tax that is, a unit increase in education tax will lead to an increase in profit after tax with the tune of 36.28245.
Discussion: From the analysis, the study found out that the Levin, Lin and Chu unit root result showed that all the variables employed are stationary at level, which brings that all the variables were integrated of order zero I(0). The pooled ordinary least square revealed that the coefficient of multiple determinants (R2) with over
97%; the adjusted R-square, the F-test and the prob (F-statistic) were statistically significant. Furthermore, the coefficient of corporate tax on profit after tax was positive with the value of 2.418830 and its P-values were 0.0000, the coefficient of value-added tax was 14.51298 and it p-value was 0.0000. Equally, the coefficient of withholding tax was positive with the value of 7.256489 with p-value 0.0000. This implies that manufacturing firms use Tax Avenue to jack up their returns by increasing their product before sales. However, the findings of this study are similar to the work of Chude and Chude (2015); Maduga, Ekwe and Kalu (2015).
5. Conclusion and Recommendations
This study empirically reviews the effects of corporate taxation on the profitability of some selected firms in Nigeria employing corporate tax rate, education tax rate, value-added tax rate and withholding tax rate as the proxies for corporate taxation and profit after tax as a proxy for the profitability of the selected firms. The study, however, concluded that corporate tax rate and education tax rate as the major taxes paid by companies have positive and significant effects to influence profit after tax. It is also clinched that value-added tax and withholding tax being used as other variables that could have effects on profit after tax equally revealed positive and significant effects on profit after tax. Therefore, the study recommended that the government and relevant tax authorities should improve in the administration of corporate taxes to avoid non-compliance being that the taxes paid by the companies are added on the product aside from the prospective gains.
References
Aransiola, S. Y. (2013). Corporate tax and investment Decision in quoted manufacturing industries in Nigeria. Open Journal Of Industrial And Business Management. Doi: 1012966/ojibm
Arnold, J. & Schwellnus, C. (2008). The effects of corporate taxes on productivity and investment across OECD economies over the period, 1996- 2004.
Afuberoh, D. & Okoye, E. (2014). The impact of taxation on revenue generation in Nigeria. A study of federal capital territory and selected states. International Journal of Public Administration and Management Research (IJPAMR), 0012(2), 23-37.
Beigi, M. R., Rafat, B. & Panah, H. M. (2013). The analysis of the effect of tax on profitability indices in listed companies of Tehran Stock Exchange. European Online Journal of Natural and Social Sciences, 2(3), 86-98.
197
Ezugwu, C. I. & Akubo, D. (2014). Analysis of the Effect of High Corporate Tax Rate on the Profitability of Corporate Organizations in Nigeria – A Study of Some Selected Corporate Organizations. Mediterranean Journal of Social Sciences, 5(20), 311-321.
Gurama, Z., Mansor, M. B. & Pantamee, A. A. (2015). Tax Evasion and Nigeria Tax System: An Overview. Research Journal of Finance and Accounting, 6(8), 202-211.
Gatsi, J. G., Gadzo, S. G. & Kportorgbi, H. K. (2013). The effect of corporate income tax on financial performance of listed manufacturing firms in Ghana. Research Journal of Finance Accounting, 4(15), 118-124. Kiabel, D. B. (2009). Curbing Tax Evasion and Avoidance in personal income tax administrations. A study of the
South-South states of Nigeria. European journal of Economies, Financial Administrative Sciences. ISSN 1450-2275. Issue 15. http//:www.eurojournals.com/EJEPAS.
Madugba, J. U., Ekwe, M. C. & Kalu, J. M. (2015). Corporate Tax and Revenue Generation: Evidence from Nigeria. Journal of Emerging Trends in Economics and Management Sciences, 6(5), 333-339.
Nightingale, K. (1997). Taxation: Theory and Practice. Pitman. United Kingdom
Nwaobia, A. N. & Jayeoba, O. O. (2016). Tax planning and firm’s liquidity. Journal of Business Management, 2(10), 1-22.
Ogundele, A. E. (1999). Elements of Taxation. 1st Edition: Libri Service, Lagos.
Ojo, S. (2008). Fundamental principles of Nigerian tax. Lagos Sagribra Pax publication second edition
Raza, S. A., Ali, S. A. & Abassi, Z. (2011). Effect of corporate income tax and firms' size on investment: evidence by Karachi stock exchange.
Riedel, M. & Dischinger, N. (2008). Corporate Taxes and the Location of Intangible Assets within Multinational Firms. Munich Discussion Paper No.15.
Soyode, I. & Kajola, S. O. (2006). Taxation principles and practice in Nigeria. Ibadan: Silicon publishers.
Appendix Date
d Firms Year PAT PBT VAT 5% PBT WHT 10% PBT CIT 30%PBT EDT 2%PBT
1 Flour Mill 2007 7,474,468 9,791,772 489588.6 979177.2 2937531.6 195835.44
1 Flour Mill 2008 6,363,082 9,878,183 493909.15 987818.3 2963454.9 197563.66
1 Flour Mill 2009 3,892,183 5,470,222 273511.1 547022.2 1641066.6 109404.44
1 Flour Mill 2010 13,370,731 19,300,962 965048.1 1930096.2 5790288.6 386019.24
1 Flour Mill 2011 10,095,752 14,264,723 713236.15 1426472.3 4279416.9 285294.46
1 Flour Mill 2012 11,803,161 7,761,629 388081.45 776162.9 2328488.7 155232.58
1 Flour Mill 2013 11,803,161 7,826,082 391304.1 782608.2 2347824.6 156521.64
1 Flour Mill 2014 7,686,943 4,369,300 218465 436930 1310790 87386
1 Flour Mill 2015 7,724,770 8,474,342 423717.1 847434.2 2542302.6 169486.84
1 Flour Mill 2016 11,489,278 14,420,284 721014.2 1442028.4 4326085.2 288405.68
2 Nestle 2007 5,441,899 8,463,788 423189.4 846378.8 2539136.4 169275.76
2 Nestle 2008 9,783,578 11,862,213 593110.65 1186221.3 3558663.9 237244.26
2 Nestle 2009 8,331,599 13,783,244 689162.2 1378324.4 4134973.2 275664.88
2 Nestle 2010 12,602,109 18,244,454 912222.7 1824445.4 5473336.2 364889.08
2 Nestle 2011 16,496,453 18,199,249 909962.45 1819924.9 5459774.7 363984.98
2 Nestle 2012 21,137,275 25,050,172 1252508.6 2505017.2 7515051.6 501003.44
2 Nestle 2013 22,258,279 26,047,590 1302379.5 2604759 7814277 520951.8
2 Nestle 2014 22,235,640 24,445,978 1222298.9 2444597.8 7333793.4 488919.56
2 Nestle 2015 23,736,777 29,322,477 1466123.9 2932247.7 8796743.1 586449.54
2 Nestle 2016 7,924,968 0 0 0 0
3 Unilever 2007 1,296,533 2,013,148 100657.4 201314.8 603944.4 40262.96
3 Unilever 2008 2,596,533 4,144,849 207242.45 414484.9 1243454.7 82896.98
198
3 Unilever 2010 4,180,620 6,151,855 307592.75 615185.5 1845556.5 123037.1
3 Unilever 2011 5,491,076 7,983,312 399165.6 798331.2 2394993.6 159666.24
3 Unilever 2012 5,597,613 8,185,987 409299.35 818598.7 2455796.1 163719.74
3 Unilever 2013 4,806,907 6,911,441 345572.05 691144.1 2073432.3 138228.82
3 Unilever 2014 2,412,343 2,873,235 143661.75 287323.5 861970.5 57464.7
3 Unilever 2015 1,192,366 1,771,063 88553.15 177106.3 531318.9 35421.26
3 Unilever 2016 3,071,885 4,106,422 205321.1 410642.2 1231926.6 82128.44
4 Cadbury 2007 0 0 0 0
4 Cadbury 2008 -2,752 -2,848 -142.4 -284.8 -854.4 -56.96
4 Cadbury 2009 -2,752 -2,848 -142.4 -284.8 -854.4 -56.96
4 Cadbury 2010 1,952 1,143 57.15 114.3 342.9 22.86
4 Cadbury 2011 3,670,555 5,053,022 252651.1 505302.2 1515906.6 101060.44
4 Cadbury 2012 3,454,991 5,511,518 275575.9 551151.8 1653455.4 110230.36
4 Cadbury 2013 6,606,013 8,278,526 413926.3 827852.6 2483557.8 165570.52
4 Cadbury 2014 2,137,319 2,385,891 119294.55 238589.1 715767.3 47717.82
4 Cadbury 2015 1,153,295 1,577,412 78870.6 157741.2 473223.6 31548.24
4 Cadbury 2016 -296,402 -562,870 -28143.5 -56287 -168861 -11257.4
5 Dangote Flour 2007 21,478,561 30,660,730 1533036.5 3066073 9198219 613214.6
5 Dangote Flour 2008 21,871,047 30,151,378 1507568.9 3015137.8 9045413.4 603027.56
5 Dangote Flour 2009 13,185,599 19,586,932 979346.6 1958693.2 5876079.6 391738.64
5 Dangote Flour 2010 2,762,142 4,911,885 245594.25 491188.5 1473565.5 98237.7
5 Dangote Flour 2011 623,622 758,742 37937.1 75874.2 227622.6 15174.84
5 Dangote Flour 2012 -2,769,723 -5,602,972 -280148.6 -560297.2 -1680892 -112059.4
5 Dangote Flour 2013 -7,932,996 -8,342,294 -417114.7 -834229.4 -2502688 -166845.9
5 Dangote Flour 2014 -6,219,904 -9,285,013 -464250.7 -928501.3 -2785504 -185700.3
5 Dangote Flour 2015 -14,078,794 -13,789,416 -689470.8 -1378942 -4136825 -275788.3
5
Dangote
Flour 2016 12,110,356 11,588,399 579419.95 1158839.9 3476519.7 231767.98
6 First Aluminium 2007 -491,584 -583,106 -29155.3 -58310.6 -174931.8 -11662.12
6 First Aluminium 2008 -298,652 -473,092 -23654.6 -47309.2 -141927.6 -9461.84
6 First Aluminium 2009 48,316 59,621 2981.05 5962.1 17886.3 1192.42
6 First Aluminium 2010 -334,586 -298,070 -14903.5 -29807 -89421 -5961.4
6 First Aluminium 2011 -325,044 -278,223 -13911.15 -27822.3 -83466.9 -5564.46
6 First Aluminium 2012 -1,004,392 -1,053,239 -52661.95 -105323.9 -315971.7 -21064.78
6 First Aluminium 2013 99,170 29,761 1488.05 2976.1 8928.3 595.22
6 First Aluminium 2014 31,742 106,385 5319.25 10638.5 31915.5 2127.7
6 First Aluminium 2015 112,554 43,172 2158.6 4317.2 12951.6 863.44
6 First Aluminium 2016 165,420 271,620 13581 27162 81486 5432.4
199
7 Guinness 2008 11,860,880 17,092,950 854647.5 1709295 5127885 341859
7 Guinness 2009 13,541,189 18,991,762 949588.1 1899176.2 5697528.6 379835.24
7 Guinness 2010 13,736,359 19,988,735 999436.75 1998873.5 5996620.5 399774.7
7 Guinness 2011 17,927,934 26,176,966 1308848.3 2617696.6 7853089.8 523539.32
7 Guinness 2012 14,671,195 21,074,950 1053747.5 2107495 6322485 421499
7 Guinness 2013 11,863,726 17,008,875 850443.75 1700887.5 5102662.5 340177.5
7 Guinness 2014 9,573,480 11,681,560 584078 1168156 3504468 233631.2
7 Guinness 2015 7,794,899 10,795,102 539755.1 1079510.2 3238530.6 215902.04
7 Guinness 2016 -2,015,886 -2,347,241 -117362.1 -234724.1 -704172.3 -46944.82
8 Nigeria Beweries 2007 18,942,856 27,876,336 1393816.8 2787633.6 8362900.8 557526.72
8 Nigeria Beweries 2008 25,700,593 37,519,114 1875955.7 3751911.4 11255734 750382.28
8 Nigeria Beweries 2009 27,910,091 41,399,796 2069989.8 4139979.6 12419939 827995.92
8 Nigeria Beweries 2010 30,332,118 44,880,248 2244012.4 4488024.8 13464074 897604.96
8 Nigeria Beweries 2011 38,408,847 57,118,042 2855902.1 5711804.2 17135413 1142360.8
8 Nigeria Beweries 2012 38,042,714 55,624,366 2781218.3 5562436.6 16687310 1112487.3
8 Nigeria Beweries 2013 43,080,349 62,240,317 3112015.9 6224031.7 18672095 1244806.3
8 Nigeria Beweries 2014 42,520,253 61,461,821 3073091.1 6146182.1 18438546 1229236.4
8 Nigeria Beweries 2015 38,049,318 54,508,368 2725418.4 5450836.8 16352510 1090167.4
8 Nigeria Beweries 2016 28,396,777 39,622,914 1981145.7 3962291.4 11886874 792458.28
9 PZ 2007 3,512,347 5,355,885 267794.25 535588.5 1606765.5 107117.7
9 PZ 2008 3,950,935 5,980,297 299014.85 598029.7 1794089.1 119605.94
9 PZ 2009 4,818,611 7,671,087 383554.35 767108.7 2301326.1 153421.74
9 PZ 2010 5,301,742 7,951,448 397572.4 795144.8 2385434.4 159028.96
9 PZ 2011 5,217,530 8,025,266 401263.3 802526.6 2407579.8 160505.32
9 PZ 2012 2,410,498 4,306,863 215343.15 430686.3 1292058.9 86137.26
9 PZ 2013 4,875,040 7,650,265 382513.25 765026.5 2295079.5 153005.3
9 PZ 2014 4,591,399 6,949,985 347499.25 694998.5 2084995.5 138999.7
9 PZ 2015 4,053,284 6,556,814 327840.7 655681.4 1967044.2 131136.28
9 PZ 2016 1,863,013 3,148,196 157409.8 314819.6 944458.8 62963.92
10 Beta Glass 2007 866,252 1,056,841 52842.05 105684.1 317052.3 21136.82
10 Beta Glass 2008 1,192,690 1,453,360 72668 145336 436008 29067.2
10 Beta Glass 2009 1,384,776 1,813,400 90670 181340 544020 36268
10 Beta Glass 2010 1,472,444 1,832,403 91620.15 183240.3 549720.9 36648.06
10 Beta Glass 2011 1,774,660 2,300,357 115017.85 230035.7 690107.1 46007.14
10 Beta Glass 2012 1,328,580 1,857,089 92854.45 185708.9 557126.7 37141.78
10 Beta Glass 2013 1,560,164 2,138,784 106939.2 213878.4 641635.2 42775.68
10 Beta Glass 2014 2,390,223 3,340,660 167033 334066 1002198 66813.2
10 Beta Glass 2015 1,991,127 3,114,795 155739.75 311479.5 934438.5 62295.9
10 Beta Glass 2016 0 0 0 0
200
11 Dangote Sugar 2008 21,871,047 30,151,378 1507568.9 3015137.8 9045413.4 603027.56
11 Dangote Sugar 2009 13,185,599 19,587,423 979371.15 1958742.3 5876226.9 391748.46
11 Dangote Sugar 2010 11,282,240 16,146,930 807346.5 1614693 4844079 322938.6
11 Dangote Sugar 2011 7,403,597 10,921,229 546061.45 1092122.9 3276368.7 218424.58
11 Dangote Sugar 2012 10,796,416 16,331,679 816583.95 1633167.9 4899503.7 326633.58
11 Dangote Sugar 2013 13,537,612 20,099,517 1004975.9 2009951.7 6029855.1 401990.34
11
Dangote
Sugar 2014 11,908,690 17,472,841 873642.05 1747284.1 5241852.3 349456.82
11 Dangote Sugar 2015 12,659,855 18,144,955 907247.75 1814495.5 5443486.5 362899.1
11 Dangote Sugar 2016 14,395,938 19,614,434 980721.7 1961443.4 5884330.2 392288.68
12 Okomu Palm Oil 2007 139,794 150,794 7539.7 15079.4 45238.2 3015.88
12 Okomu Palm Oil 2008 1,207,460 1,240,038 62001.9 124003.8 372011.4 24800.76
12 Okomu Palm Oil 2009 549,410 661,627 33081.35 66162.7 198488.1 13232.54
12 Okomu Palm Oil 2010 1,629,456 1,971,262 98563.1 197126.2 591378.6 39425.24
12 Okomu Palm Oil 2011 3,446,905 4,181,486 209074.3 418148.6 1254445.8 83629.72
12 Okomu Palm Oil 2012 3,416,288 4,072,185 203609.25 407218.5 1221655.5 81443.7
12 Okomu Palm Oil 2013 2,085,920 2,687,301 134365.05 268730.1 806190.3 53746.02
12 Okomu Palm Oil 2014 1,453,320 1,904,496 95224.8 190449.6 571348.8 38089.92
12 Okomu Palm Oil 2015 2,697,555 2,898,645 144932.25 289864.5 869593.5 57972.9
12 Okomu Palm Oil 2016 4,910,273 5,906,453 295322.65 590645.3 1771935.9 118129.06
13 Glaxosmith 2007 836,876 1,166,449 58322.45 116644.9 349934.7 23328.98
13 Glaxosmith 2008 1,277,441 1,851,364 92568.2 185136.4 555409.2 37027.28
13 Glaxosmith 2009 1,701,829 2,469,596 123479.8 246959.6 740878.8 49391.92
13 Glaxosmith 2010 2,461,395 3,370,886 168544.3 337088.6 1011265.8 67417.72
13 Glaxosmith 2011 2,294,988 3,492,620 174631 349262 1047786 69852.4
13 Glaxosmith 2012 2,823,526 4,171,665 208583.25 417166.5 1251499.5 83433.3
13 Glaxosmith 2013 2,919,170 4,314,829 215741.45 431482.9 1294448.7 86296.58
13 Glaxosmith 2014 1,848,842 2,752,216 137610.8 275221.6 825664.8 55044.32
13 Glaxosmith 2015 965,047 1,157,514 57875.7 115751.4 347254.2 23150.28
13 Glaxosmith 2016 0 0 0 0
14 WEMA 2007 2,554,098 1,878,698 93934.9 187869.8 563609.4 37573.96
14 WEMA 2008 -57,738,739 -68,482,164 -3424108 -6848216 -20544649 -1369643
14 WEMA 2009 -11,668,408 -19,436,874 -971843.7 -1943687 -5831062 -388737.5
14 WEMA 2010 9,689,683 12,964,108 648205.4 1296410.8 3889232.4 259282.16
14 WEMA 2011 -4,228,926 -3,770,021 -188501.1 -377002.1 -1131006 -75400.42
14 WEMA 2012 -5,040,629 -4,942,211 -247110.6 -494221.1 -1482663 -98844.22
14 WEMA 2013 1,596,531 1,947,308 97365.4 194730.8 584192.4 38946.16
201
14 WEMA 2015 2,327,275 3,045,528 152276.4 304552.8 913658.4 60910.56
14 WEMA 2016 2,560,580 3,245,145 162257.25 324514.5 973543.5 64902.9
15 Julius Berger 2007 1,763,706 3,132,048 156602.4 313204.8 939614.4 62640.96