R E S E A R C H
Open Access
New stroke prognostic factors
Wafeek M. Elsheikh, Ibrahim E. Alahmar, Gelan Mahmoud Salem
*and Eman S. Matar
Abstract
Background:Understanding ischemic stroke pathogenesis helps in prevention, prognosis, and treatment. Stroke is greatly related to inflammation and thrombo-genesis as inflammatory cells (as neutrophils-lymphocytes) and thrombo-genic agents as von Willebrand factor antigen (VWF: Ag) and epicardial fat.
Objectives of the study:Evaluation of epicardial fat thickness (EFT), neutrophil/lymphocytic ratio (NLR), and (VWF: Ag) levels as predisposing and prognostic factors of ischemic stroke.
Patients and methods:Sixty acute ischemic stroke patients were subjected to clinical assessment (Oxford stroke sheet), National Institute Health Stroke Scale: NIHSS), Modified Rankin Scale (MRS), NLR and VWF: Ag levels,
transthoracic echo, duplex on carotid and vertebro-basilar arteries, and brain computed tomography (CT). Thirty-five healthy controls matched for age and sex were subjected to the same steps except NIHSS and MRS.
Results:EFT, NLR, and VWF among patients were significantly higher than control group. NLR≥2 and VWF: Ag were significant risk factors among stroke patients with VWF: Ag had the higher risk than NLR≥2. NLR was a high valid prognostic marker in predicting stroke outcome (MRS) with (optimal cutoff value 2.05) for prediction of primary unfavorable outcome. There was no statistical significance between (MRS) and EFT or VWF: Ag level. Conclusion:EFT represents inexpensive and readily available clinical marker that may be useful in estimating risk of ischemic stroke. NLR is non-expensive easy marker for predicting stroke severity and primary unfavorable outcome. High VWF level increases ischemic stroke risk.
Keywords:Ischemic stroke, Von Willbrand factor, Epicardial fat thickness, neutrophil-lymphocytic ratio
Introduction
Ischemic stroke is a major cause of disability and death. Inflammation plays a significant role in the pathogenesis of ischemic stroke, and its mechanism is complex [1]. The infarct area produces several inflammatory cyto-kines and recruits peripheral inflammatory leukocytes early as neutrophils which mediate and exacerbate ische-mic brain injury and stroke severity. Also, lymphocytes recruitment occurs in the later stages of ischemic brain injury. NLR was reported to be an important measure of systemic inflammation and was shown to predict short-term outcome in ischemic stroke [2].
Epicardial fat (EF) tissue presents between the myocar-dium and visceral pericarmyocar-dium. Increased EFT is associated with pro-atherogenic and proinflammatory adipokines and
cytokines increasing hypertension, insulin resistance, sub-clinical atherosclerosis, and thromboembolic processes as stroke [3,4]. The importance of EFT as cardiovascular and stroke risk factor has been increased in recent years [5].
Important target of new therapeutics, primary, and secondary prevention in ischemic stroke is VWF which is aglyco protein that rises in thrombogenicity playing a cru-cial role in platelet adhesion and aggregation (the initial steps in thrombus formation) especially under high shear force [6]. High VWF has greatly related to an increased first stroke risk and stroke mortality and has associated to its etiologic subtypes as large artery atherosclerosis and cardioembolic strokes. Using high-resolution imaging for detection of VWF-rich thrombi could help to determine patients needing an anti-VWF approach rather than tissue plasminogen activator in the acute treatment improving re-canalization with acceptable bleeding rates [7].
© The Author(s). 2020Open AccessThis article is licensed under a Creative Commons Attribution 4.0 International License, which permits use, sharing, adaptation, distribution and reproduction in any medium or format, as long as you give appropriate credit to the original author(s) and the source, provide a link to the Creative Commons licence, and indicate if changes were made. The images or other third party material in this article are included in the article's Creative Commons licence, unless indicated otherwise in a credit line to the material. If material is not included in the article's Creative Commons licence and your intended use is not permitted by statutory regulation or exceeds the permitted use, you will need to obtain permission directly from the copyright holder. To view a copy of this licence, visithttp://creativecommons.org/licenses/by/4.0/. * Correspondence:[email protected]
Aim of the study
Primary objectives which include evaluation of EFT, (NLR), and (VWF: Ag) as predisposing and prognostic factors of ischemic stroke.
Secondary objectives which include firstly assessment the relation between (EFT, NLR, and VWF: Ag) from one side and severity of ischemic stroke (NIHSS) and stroke risk factors from the other side and secondly evaluation if EFT, NLR, and VWF: Ag levels are related to each other or not.
Subjects and methods Participants
This prospective case-control study was done during the period from May 2016 till May 2018. The study popula-tion included a total of 95 subjects, 60 patients with ischemic stroke (selected from the neurology department Menoufiya university hospital), and 35 healthy control ones matched for age and sex (selected from Menoufiya university hospital workers and patients’ relatives). Patients recruited were those presented with first acute ischemic stroke patients (within 48 h from the onset) with age above 45 years. Exclusion criteria included pa-tients with severe debilitating diseases, history of coagu-lopathy (hepatic patients, those having vascular connective tissue diseases or with history of recurrent deep venous thrombosis), history of recent trauma and/or recent surgi-cal operations (during the last month before ischemic stroke onset) to avoid false increase in VWF plasma level, recurrent ischemic stroke, patients with pericardial effu-sion, and patients with poor echocardiographic window. An informed consent was taken from each person in the study or his relatives.
Methods
Patients were subjected to a full medical history, complete general and neurological examination (using Oxford stroke sheet 2013). Data were gathered regarding age, sex, symptoms, history of previous strokes, and presence of vascular risk factors as hypertension, dia-betes mellitus, obesity, smoking, atrial fibrillation, hyper-cholesterolemia, and hyper-urecemia.
National Institute of Health Stroke Scale (NIHSS) is a 42-point scale. A score of less than 5 is minor stroke, from 5:15 is moderate one, and above 15 is severe stroke. It was conducted for each patient on hospital ad-mission to assess stroke severity.
Modified Rankin Scale (MRS) which was conducted for each patient 3 months after onset of ischemic stroke to measure the degree of disability/dependence after is-chemic stroke, stroke outcome, and prognosis. It is of 6 points, those with no disability have zero score, MRS < 3 = favorable outcome, and MRS ≥ 3 means moderate to severe disability = unfavorable outcome [8].
Complete blood count, NLR, and using Beckman Coulter LH750 hematology analyser (manufacturer name: Beckman Coulter, model: LH 750, country of orgin: USA, state of its brand: used), the ratio of neutro-phils to lymphocytes was calculated within 48 h from onset of acute ischemic stroke.
Plasma level of VWF on admission
Venous blood samples were collected into citrate (0.105 mol/L) with use of the Vacutainer (Becton-Dickinson, Plymouth, UK) system. Blood was centrifuged (2000g for 30 min at 4 °C), and plasma was stored in aliquots at − 80 °C until use. VWF: Ag was determined with an enzyme-linked immunosorbent assay (ELISA) with anti-human VWF antibodies (DakoCytomation, Glostrop, Denmark).
Other laboratory investigations were done (prothrom-bin time ,concentration and INR, liver profile, kidney profile, lipid profile, serum uric acid, erythrocytes sedi-mentation rate (ESR)).
Electro-cardiography
Twelve leads of ECG were done using ATM-300 cardio3-channels electrocardiography for each individual to screen for presence or absence of atrial fibrillation and hypertension.
Standard transthoracic two-dimensional echocardiog-raphy was performed using (Vivid-9-General Electric Healthcare , GE-Vingmed, Norway) equipped with Harmonic 5 Megahertz Variable Frequency Faced Array Transducer. Epicardial fat tissue was observed as the echo lucent space between the outer wall of the myocar-dium and the visceral pericarmyocar-dium. This thickness was measured perpendicularly on the free wall of the right ventricle at end-systole in three cardiac cycles, using both long and short-axis parasternal views with patients in left lateral recumbent position. The normal values of EFT range from 1 to 4 mm [9]. Echocardiogram was done also to search for valvular vegetations, intra-mural thrombus, or wall motion hypo-kinesia as risk factors for development of ischemic stroke. Echocardiograms were interpreted by a cardiologist-echocardiographer within (48–72 h) from admission.
Duplex ultrasonography of carotid arteries and veretebro-basilar system was done (using Hitachi ultra-sonography, Gray and colored scales, and comment was done on degree of carotid artery stenosis as follows: pa-tients were divided into less than 50%, minimal stenosis, and more than 50%, moderate, and critical carotid artery stenosis).
Each participant of the control group was subjected to a full history, complete general and neurological examin-ation, laboratory investigations (complete blood count, NLR, plasma level of VWF, other laboratory investiga-tions as patients, ECG, trans-thoracic echocardiography, Duplex ultrasonography, and brain CT.
Statistical methods
Results were collected, tabulated, and statistically ana-lyzed by IBM personal computer and statistical package SPSS version 22 (Armonk, NY: IBM Corp, 2013). Two types of statistics were done: descriptive and analytic sta-tistics. Descriptive statistics included percentage (%), mean (x), and standard deviation (SD) while analytic sta-tistics included chi-square test (χ2) to study association between two qualitative variables and Student’sttest for comparison between two groups having quantitative var-iables. Variables that impacted on significant differences between patient and control groups were incorporated
into binary logistic regression analysis for relevant risk factors acute ischemic stroke.Pvalue of < 0.05 was con-sidered statistically significant, and < 0.001 is concon-sidered highly significant.
Results
The study population included a total of 95 subjects, 60 patients with ischemic stroke (age range 48–70 years, mean ± SD 59.23 ± 5.74 years), and 35 healthy subjects without ischemic stroke (ranged 48–62 years, mean ± SD 57.86 ± 3.83 years), and 53.3% of patients were males, and 46.7% were females, while in the control group, 51.4% were males, and 48.6% were females.
Assessed risk factors among our study participants were smoking, hypertension, diabetes mellitus, hyper-cholesterolemia, hyperuricemia, increased body mass index (BMI ≥ 25), atrial fibrillation (AF), carotid artery stenosis > 50%, and combined risk factors > 2 (Table1).
Table 1Risk factors, EFT, NLR, and VWF among acute ischemic stroke patients and controls
Items Patients (60) No. (%) Controls (35) No. (%) Testχ2
Pvalue
Smoking 19 (31.7) 9 (25.7)
No smoking 41 (68.3) 26 (74.3) 0.38 0.539
Hypertension 25 (41.7) 12 (34.3)
No hypertension 35 (58.3) 23 (65.7) 0.61 0.477
DM 20 (33.3) 8 (22.9)
No DM 40 (66.7) 17 (77.1) 1.17 0.280
Hypercholesterolemia 26 (43.3) 7 (20.0)
No 34 (56.7) 28 (80.0) 5.31 0.021*
Hyperurecemia 8 (13.3) 5 (14.3)
No 52 (86.7) 30 (85.7) 0.02 0.896
BMI (≥25) 20 (33.7) 5 (14.3)
Normal BMI(18.5–25) 40 (66.7) 30 (85.7) 4.14 0.042*
AF 8 (13.3) 2 (5.7)
No AF 52 (86.7) 33 (94.3) 1.36 0.243
Carotid stenosis > 50% 15 (25.0) 2 (5.7)
No 45 (75.0) 33 (94.3) 5.60 0.018*
Combined risk > 2 6 (10.0) 1 (2.9)
No 54 (90.0) 34 (97.1) 1.65 0.199
NLR Mean ± SD 2.20 ± 1.44 1.43 ± 0.29 t= 3.12 0.002**
NLR < 2 25 (41.7) 32 (91.4) 22.81 < 0.001*
NLR≥2 35 (58.3) 3 (8.6)
VWFAg (μml) 10.90 ± 2.44 8.91 ± 1.27 t= 4.48 < 0.001*
EFT (Mean ± SD) 1.59 ± 0.50 1.20 ± 0.41 t= 3.87 < 0.001*
EFT < 5 mm 25 (41.7) 28 (80.0) 13.17 < 0.001*
EFT≥5 mm 35 (58.3) 7 (20.0)
Overweight and obese (BMI≥25),AFatrial fibrillation,DMdiabetes mellitus,NLRneutrophil/lymphocytic ratio,VWFAgvonWillbrand factor antigen,EFTepicardial fat thickness,SDstandard deviation,t teststudent test,x2
Severity of stroke (NIHSS) among patients was (ranged 2–20, mean ± SD 7.95 ± 5.00) with (23, 38.3% patients) and had minor stroke NIHSS < 5 but the majority had moderate to severe stroke (37, 61.7% patients) NIHSS ≥ 5 which was significantly more prevalent among patients with DM, hypercholesterolemia, and NLR ≥ 2. There was no statistical significance between stroke severity and EFT or VWF: Ag level.
EFT, NLR (P value < 0.001), and VWF: Ag among is-chemic stroke patients were significantly higher than that of the control group (Pvalue = 0.002) (Table1).
EFT ≥ 5 mm was significantly more prevalent among hypertensive, hypercholesterolemia, obese patients, com-bined risk, and patients with higher levels of VWF: Ag (Table2).
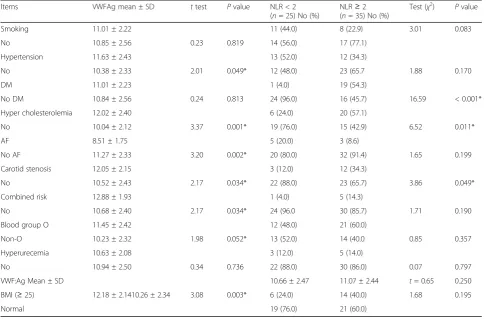
NLR ≥ 2 was significantly more prevalent among patients with diabetes mellitus, hypercholesterolemia, and those with no history of carotid artery stenosis. VWF: Ag significantly has higher level in patients with hypertension, hypercholesterolemia, overweight and obese,
combined risk factor > 2, carotid artery stenosis, no history of atrial fibrillation, and non-O-blood group.
Patients with NLR ≥ 2 were having higher plasma levels of VWF: Ag than those with NLR < 2 but the dif-ference does not reach significant level (Table3).
NLR ≥ 2 and VWF:Ag were significant risk factors in acute ischemic stroke patients. In addition, VWF:Ag had higher risk in development of stroke than NLR ≥ 2 (Table4).
Fifty percent of patients had unfavorable outcome (moderate to severe disability, MRS ≥ 3), 46.7% had fa-vorable (MRS < 3), and 3.3% were missed on follow-up.
MRS≥3 was significantly more prevalent among DM, hypercholesterolemia, and patients with NLR ≥ 2 (p value 0.001) (Fig.1). There was no statistical significance between post ischemic stroke disability and EFT or VWF: Ag level (Pvalue = 0.198, 0.249, respectively).
NLR was a high valid prognostic marker in predicting post stroke disability after 3 months from acute ischemic stroke onset. The optimal cutoff value of NLR for
Table 2Comparison between patients with EFT< 5 mm and those≥5 regarding risk factors, NLR and VWF
Items EFT< 5(n= 25) No. (%) EFT≥5(n= 35) No. (%) Test Pvalue
Age Mean ± SD 56.72 ± 5.00 61.03 ± 5.61 t= 3.07 0.003*
Sex:
Males 12 (48.0) 20 (57.1) χ2 = 0.49 0.484
Females 13 (52.0) 15 (42.9)
Smoking 5 (20.0) 14 (40.0)
No 20 (80.0) 21 (60.0) χ2 = 2.70 0.101
Hypertension 6 (24.0) 19 (54.3) χ2 = 5.50
No hypertension 19 (76.0) 16 (45.7) 0.019*
DM 9 (36.0) 11 (31.4)
No DM 16 (64.0) 24 (68.6) χ2 = 0.14 0.711
Hypercholesterolemia: 3 (12.0) 23 (65.7)
No 22 (88.0) 12 (34.3) χ2 = 17.14 < 0.001*
BMI (≥25) 2 (8.0) 18 (51.4)
Normal 23(92.0) 17 (48.6) χ2 = 12.38 < 0.001*
AF 2(8.0) 6 (17.1)
No AF 23 (92.0) 29 (82.9) χ2 = 1.05 0.304
Carotid stenosis 4 (16.0) 11 (24.4)
No 21 (84.0) 24 (75.6) χ2 = 1.85 0.174
Combined risk 0 6 (17.1)
No 25 (100.0) 29 (82.9) χ2 = 4.76 0.029*
Hyperurecemia 4 (16.0) 4 (11.4)
No 21 (84.0) 21 (88.6) χ2 = 0.26 0.608
VWF:Ag (μml) (Mean ± SD) 9.95 ± 2.14 11.57 ± 2.43 t= 2.67 0.010*
NLR< 2 13 (52.0) 12 (34.3) χ2 = 1.88 0.170
NLR≥2 12 (48.0) 23 (65.7)
prediction of primary unfavorable outcome was 2.05 (Table5) (Fig.2).
Discussion
In our study, we tried to study EFT, NLR, and VWF in acute ischemic stroke, and our hypothesis in this is that EFT, NLR, and VWF can be considered strong predic-tors of stroke occurrence, stroke severity, and stroke prognosis.
In our study, the majority of acute ischemic stroke patients (61.7%) had moderate to severe stroke (NIHSS ≥ 5) on admission. The NIHSS ≥ 5 in those who had
moderate to severe acute ischemic stroke was signifi-cantly more prevalent among patients with diabetes (DM) (p value 0.001), hypercholesterolemia, (p value 0.008), and NLR ≥ 2 (p value 0.001), and that came in agreement with Esref and colleagues [10].
Akil and colleagues reported for the first time the association between ischemic stroke and EFT [4]. EFT plays important role in atherosclerosis and stroke by increasing inflammatory mediators and other thrombo embolic risk factors [5].
EFT (p value, 0.001) was higher in the patients group than the control one and that came in the agreement of
Table 3VWF: Ag and NLR in relation to stroke risk factors among patients Items VWFAg mean ± SD ttest Pvalue NLR < 2
(n= 25) No (%)
NLR≥2 (n= 35) No (%)
Test (χ2) Pvalue
Smoking 11.01 ± 2.22 11 (44.0) 8 (22.9) 3.01 0.083
No 10.85 ± 2.56 0.23 0.819 14 (56.0) 17 (77.1)
Hypertension 11.63 ± 2.43 13 (52.0) 12 (34.3)
No 10.38 ± 2.33 2.01 0.049* 12 (48.0) 23 (65.7 1.88 0.170
DM 11.01 ± 2.23 1 (4.0) 19 (54.3)
No DM 10.84 ± 2.56 0.24 0.813 24 (96.0) 16 (45.7) 16.59 < 0.001*
Hyper cholesterolemia 12.02 ± 2.40 6 (24.0) 20 (57.1)
No 10.04 ± 2.12 3.37 0.001* 19 (76.0) 15 (42.9) 6.52 0.011*
AF 8.51 ± 1.75 5 (20.0) 3 (8.6)
No AF 11.27 ± 2.33 3.20 0.002* 20 (80.0) 32 (91.4) 1.65 0.199
Carotid stenosis 12.05 ± 2.15 3 (12.0) 12 (34.3)
No 10.52 ± 2.43 2.17 0.034* 22 (88.0) 23 (65.7) 3.86 0.049*
Combined risk 12.88 ± 1.93 1 (4.0) 5 (14.3)
No 10.68 ± 2.40 2.17 0.034* 24 (96.0 30 (85.7) 1.71 0.190
Blood group O 11.45 ± 2.42 12 (48.0) 21 (60.0)
Non-O 10.23 ± 2.32 1.98 0.052* 13 (52.0) 14 (40.0 0.85 0.357
Hyperurecemia 10.63 ± 2.08 3 (12.0) 5 (14.0)
No 10.94 ± 2.50 0.34 0.736 22 (88.0) 30 (86.0) 0.07 0.797
VWF:Ag Mean ± SD 10.66 ± 2.47 11.07 ± 2.44 t= 0.65 0.250
BMI (≥25) 12.18 ± 2.1410.26 ± 2.34 3.08 0.003* 6 (24.0) 14 (40.0) 1.68 0.195
Normal 19 (76.0) 21 (60.0)
*Means highly significant
Table 4Binary logistic regression analysis for relevant risk factors in acute ischemic stroke patients
Risk factors B S.E. P
value
OR 95% CI
Lower Upper
Cholesterol > 200 mg/dl 0.258 0.718 0.719 1.295 0.317 5.293
Carotid artery stenosis 0.156 0.970 0.872 1.169 0.175 7.818
EFT≥5 −1.021 0.762 0.180 0.360 0.081 1.603
NLR≥2 −2.357 0.725 0.001* 0.095 0.023 0.392
BMI (overweight and obese) 0.613 0.823 0.457 1.846 0.368 9.271
VWF:Ag inμml 0.379 0.154 0.014* 1.461 1.080 1.977
Ibrahim and colleagues [11]. However, on binary logistic regression analysis for relevant risk factors after adjust-ment of BMI, hypercholesterolemia, carotid artery sten-osis, NLR, and VWF:Ag level, EFT was not a significant risk factor in acute ischemic stroke patients compared to NLR and VWF:Ag level that were highly significant risk factors for ischemic stroke and that came in agreement with Wang and colleagues [12]. Also, there was no stat-istical significance between stroke severity and EFT and that came in agreement with Esref and colleagues [10].
On MRS done 3 months from acute ischemic stroke onset, there was no statistical significance between post ischemic stroke disability and initial EFT, but that did not come in agreement with Ibrahim and colleagues [11]. The difference in results can be explained by fewer number of patients group in this study and difference in clinical presentations of acute ischemic strokes between the two studies.
EFT≥ 5 was significantly more prevalent among those with hypertension (p value 0.019), hypercholesterolemia (pvalue 0.001), BMI, (p value 0.001), and combined risk factors > 2 (pvalue 0.029) and that came in the agreement of Ibrahim and colleagues and Sengul and colleagues [11, 13]. However, Hikmet and colleagues [14] found that the association of EFT and metabolic syndrome constituents was stronger for body mass index than lipid parameters. EFT had no significant relationship in those with atrial fibrillation but that did not come in agreement with Jin-Hyung and colleagues [15] and Chu and colleagues [16].
This can be explained by fewer number of ischemic stroke patients with atrial fibrillation in this study. EFT had no significant relationship in those with diabetes mellitus. However, Hikmet and colleagues [14] showed that echo-cardiographic EFT was significantly associated with all indices of insulin resistance and glucose intolerance. Also, EFT had no significant relationship in those with carotid artery stenosis, but that did not come in agreement with Sengul and colleagues’[13] explanation is that fewer num-ber of patients with carotid artery stenosis in this study.
NLR ≥ 2 was significantly more prevalent among patients with DM (pvalue 0.001) and hypercholesterol-emia (pvalue 0.01), while NLR≥2 was not significant in relation to smoking, hypertension, BMI, carotid artery stenosis, blood group, hyperuricemia, and combined risk factors > 2 and that came in agreement with Esref and colleagues and Yen-Nan and colleagues [10,17].
There was strong correlation between NLR and NIHSS score, and the results indicate that a higher NLR is associ-ated with stroke severity on admission and that came in agreement with Yen-Nan and colleagues and Sungwook and colleagues [17,18].
On MRS done 3 months from acute ischemic stroke onset, NLR was associated with unfavorable outcome (MRS≥3), which means that NLR is a predictor of post stroke disability and that came in agreement with Jin-Hyung and colleagues andXueand colleagues [15,19].
NLR was a high valid prognostic marker in predicting post stroke disability (MRS ≥ 3), after 3 months from Fig. 1Stroke outcome (MRS) in relation to clinical data and EFT and NLR. Mod.RS, Modified Rankin Scale; Mod.RS < 3, means favorable outcome
Table 5Neutrophil/lymphocytic ratio for prediction of Modified Rankin Scale (MRS≥3) after 3 months from stroke
Variable Cutoff point Sensitivity Specificity AUC Pvalue 95%CI (lower limit-upper limit)
NLR 2.05 90% 96% 0.991 < 0.001* 0.063–0.390
stroke onset. The optimal cutoff value of NLR for pre-diction of primary unfavorable outcome was 2.05 with a sensitivity of 90% and a specificity of 96% (area under the curve 0.991, 95% CI 0.063–0.390) and that came in agreement with Serhat and colleagues [20].
Patients had significantly higher mean values of VWF: Ag (pvalue, 0.001) than the control ones suggesting an evidence of increased acute endothelial activation in this patient population, and the association between VWF and acute ischemic stroke can be ascribed to the endo-thelial damage associated with cerebral infarcts or to the ischemia-related release of VWF from infarct tissues, and that came in the agreement of Tobin and colleagues and Menih and colleagues [21,22].
There was significantly positive correlation between age and VWF: Ag in acute ischemic stroke patients and that came in agreement with Menih and colleagues [22].
There were significantly higher mean levels of VWF: Ag in patients with hypertension (pvalue 0.049), hyper-cholesterolemia (pvalue 0.001), overweight and obese (p value 0.003), combined risk factor > 2 (p value 0.034), and carotid artery stenosis (pvalue 0.034) and that came in agreement with Tobin and colleagues and Sonneveld and colleagues [21, 23]. However, van Loon and col-leagues’ [24] study found no statistical significance
between VWF: Ag levels and carotid artery stenosis. Also, there was significantly higher mean levels of VWF: Ag in patients with non-O-blood group (p value 0.052) than those of blood group-O- and that came in agree-ment with Menih and colleagues [22]. Patients with history of atrial fibrillation (pvalue 0.002) did not have significantly higher mean levels of VWF: Ag, and that came in agreement with Tobin and colleagues [21].
Patients with higher mean levels of VWF: Ag had significantly more prevalence of EFT ≥5 (pvalue 0.01), which means that VWF participates in the process of atherogenesis. Also, those with NLR ≥ 2 were having higher plasma levels of VWF:Ag than those with NLR < 2, and the explanation is that VWF levels increase during inflammation, and VWF facilitates neutrophil extravasation at sites of inflammation by destabilization of the endothelial barrier through platelet recruitment via their GlycoProtein Ib (GPIb) receptor.
group in this study and difference in clinical presenta-tions of acute ischemic strokes between the two studies.
Also, there was no statistical significance between post ischemic stroke disability and initial VWF: Ag plasma levels on MRS done 3 months after ischemic stroke onset and that came in agreement with Tobin and colleagues [21] but that did not come in agreement with Menih and colleagues [22]and Sonneveld and colleagues [23]who reported that high VWF: Ag levels may be associated with unfavorable functional outcome, as determined by the Modified Rankin Scale score. The difference in results can be explained by fewer num-ber of patients group in this study and difference in clinical presentations of acute ischemic strokes be-tween the two studies.
On binary logistic regression analysis for relevant risk factors in acute ischemic stroke patients, VWF: Ag and NLR were significant risk factors in acute ischemic stroke patients after adjustment of NLR, BMI (over-weight and obese), hypercholesterolemia, carotid artery stenosis, and EFT≥ 5. In addition, VWF:Ag had higher risk in development of stroke than NLR ≥ 2 (95% CI 1.08, 1.97, and 0.095, 0.39 relatively) and that came in agreement with Sonneveld and colleagues [23].
Limitation of our study
Small number of patients and controls, the limited avail-ability of patients in hyperacute stage of ischemic stroke, missed cases during follow-up after 3 months. EFT is a linear measurement, so it may not assess the total epi-cardial fat volume, and the relation between EFT, NLR and VWF levels, and response to acute treatment has not been assessed.
Future researches are needed on large sample to be able to generalize the data, on different types of strokes (ischemic and hemorragic) and on different subtypes of ischemic stroke (large, small artery and lacunar stroke) with stressing on the relation between EFT, NLR, VWF level, and response to treatment either by tissue plas-minogen activator or new agents like VWF inhibitors using advanced imaging than CT to assess VWF riched thrombi.
Conclusion
EFT that can be easily assessed represents a novel risk factor for ischemic stroke. NLR is a simple, non-expensive, and easy marker for predicting stroke severity on admission, primary unfavorable functional outcome. High VWF levels are associated with an increased risk of ischemic stroke.
Acknowledgements Not applicable
Authors’contributions
All authors participated in the concept and design of the study. ESM is responsible for coordination and recruitment of participants and helped in the clinical examination. All authors participated in the analysis of data, helped in applying the inclusion and exclusion criteria, helped in drafting the manuscript, and performed the statistical analysis. All authors read and approved the final manuscript.
Funding Nil.
Availability of data and materials
All data and materials are available upon request submitted to the corresponding author, on the following e-mail:[email protected]. edu.eg.,[email protected].
Ethics approval and consent to participate
The study was approved by Menofia University Faculty of Medicine, Ethical Committee on 8 May 2016. Written informed consents were obtained from all participants.
Consent for publication Not applicable
Competing interests
The authors declare that they have no competing interests
Received: 18 October 2019 Accepted: 9 June 2020
References
1. Tokgoz S, Kayrak M, A kpinar Z, Seyithanoğlu A, Güney F, Yürüten B, et al. Neutrophil lymphocyte ratio as a predictor of stroke. J Stroke Cerebrovasc Dis. 2013;22:1169–74.
2. Zhang J, Ren Q, Song Y, He M , Zeng Y, Liu, Z, et al. Prognostic role of neutrophil–lymphocyte ratio in patients with acute ischemic stroke. Medicine: November. 2017; 96(45): e8624.
3. Doesch C, Haghi D, Flüchter S, Suselbeck T, Schoenberg SO, Michaely H, et al. Epicardial adipose tissue in patients with heart failure. J Cardiovasc Magn Reson. 2010;12:40.
4. Akil E, Akil MA, Varol S, Özdemir HH, Yücel Y, Arslan D, et al.
Echocardiographic epicardial fat thickness and neutrophil to lymphocyte ratio are novel inflammatory predictors of cerebral ischemic stroke. J Stroke Cerebrovasc Dis. 2014;23(9):2328–34.
5. Fatih A, Serdar G, Fatih K, Tülay O, MDErcan V. The relation between echocardiographic epicardial fat thickness and CHA2DS2-VAScScore in patients with sinus rhythm. Braz J Cardiovasc Surg. 2019;34(1):1–9. 6. Rusu L, Andreeva A, Visintine DJ, Kim K, Vogel SM, Stojanovic-Terpo A, et al.
G protein-dependent basal and evoked endothelial cell vWF secretion. Blood. 2014;123:442.
7. Buchtele N, Schwameis M, Gilbert JC, Schörgenhofer C, Jilma B. Targeting von Willebrand factor in ischaemic stroke: focus on Ccinical evidence.Bernd Jilma. Thromb Haemost. 2018;118:959–78.
8. Janssen PM, Visser NA, Dorhout Mees SM, Klijn CJM, Algra A, Rinkel GJE, et al. Comparison of telephone and face-to-face assessment of the modified Rankin Scale. Cerebrovasc Dis. 2010;29:137–9.
9. Bertaso AG, Bertol D, Duncan BB, Foppa M. Epicardial fat: definition, measurements and systematic review of main outcomes [in Portuguese]. Arq Bras Cardiol. 2013;101(1):18–28.
10. Esref A, Mehmet A, Sefer V, Hasan HO, Yavuz Y, Demet A, et al. Echocardiographic epicardial fat thickness and neutrophil to lymphocyte ratio are novel inflammatory predictors of cerebral ischemic stroke. J Stroke Cerebrovasc Dis. 2014;04:028.
11. Ibrahim A, Yasemin U, Ozcan B, Fatih A, Gulser KE, Gulnihal K, et al. Increased epicardial fat thickness correlates with aortic stiffness and N-terminal pro-brain natriuretic peptide levels in acute ischemic stroke patients. Tex Heart Inst J. 2016;43(3):220–6.
and independent of anthropometric indexes and intraabdominal visceral fat. J Clin Endocrinol Metab. 2009;94(2):662–9.
13. Sengul C, Cevik C, Ozveren O, Oduncu V, Sunbul A, Akgun T, et al. Echocardiographic epicardial fat thickness is associated with carotid intima-media thickness in patients with metabolic syndrome. Echocardiography. 2011;28:853–8.
14. Hikmet Y, Uğur C, Tuncay H, Ahmet H, Hamza S, Dural M, et al. Increased epicardial fat tissue is a marker of metabolic syndrome in adult patients. Int J Cardiol. 2013;165(2):308–13.
15. Jin-Hyung L, Meyung-Kug K, Bong-Goo Y. Epicardial fat thickness, free fatty acid and pro-BNP predict atrial fibrillation in acute ischemic stroke. Stroke. 2017;48:AWP233https://www.ahajournals.org/doi/10.1161/str.48. suppl_1.wp233.
16. Chu CY, Lee WH, Hsu P, Lee MK, Lee HH, Chiu CA, et al. Association of increased epicardial adipose tissue thickness with adverse cardiovascular outcomes in patients with atrial fibrillation. Medicine. 2016;95(11):e2874. 17. Yen-Nan M-ST, Pei-Hsun S, Yung-Lung C, Chih-Hung C, Nei-Wen T, et al. Higher neutrophil counts and neutrophil-to lymphocyte ratio predict prognostic outcome in patients after non-atrial fibrillation-caused ischemic stroke. Biom J. 2017;40:15–4e162.
18. Sungwook Y, Hisatomi A, Carin B, Stephen C, Geoffrey H, Martin K. Neutrophil to lymphocyte ratio and early clinical outcomes in patients with acute ischemic stroke. J Neurol Sci. 2018;387:115–8.
19. Xue J, Huang W, Chen X, Li Q, Cai Z, Yu T, et al. Neutrophil-to-lymphocyte ratio is a prognostic marker in acute ischemic stroke. J Stroke Cerebrovasc Dis. 2017;26(3):650–7.
20. Serhat T, Mehmet K, Zehra A, Abdullah S. Neutrophil lymphocyte ratio as a predictor of stroke. J Stroke Cerebrovasc Dis. 2013;22:7.
21. Tobin WO, Kinsella JA, Kavanagh GF, O’Donnell JSC, McGrath RT, Tierney S, et al. Profile of vonWillebrand factor antigen and von Willebrand factor propeptide in an overall TIA and ischaemic stroke population and amongst subtypes. J Neurol Sci. 2017;375:404–10.
22. Menih M, KrižmarićM, Hojs FT. Clinical role of von Willebrand factor in acute ischemic stroke. Wien Klin Wochenschr. 2017;129(13-14):491–6. 23. Sonneveld MA, van Dijk AC, van den Herik EG, van Loon JE, de Lau LM,
vander LA, et al. Relationship of von Willebrand fa ctor with carotid artery and aortic arch calcification in ischemic stroke patients. Atherosclerosis. 2013;230(2):210–5.
24. Van Loon JE, de Maat MP, Deckers JW, Domburg RT, Leeback FWG. Prognostic markers in young patients with premature coronary heart disease. Atherosclerosis. 2012;224(1):213–7.
Publisher’s Note