R E S E A R C H A R T I C L E
Open Access
Subduction initiation from a stagnant lid
and global overturn: new insights from
numerical models with a free surface
Fabio Crameri
1,2,3*and Paul J. Tackley
3Abstract
Subduction initiation is a key in understanding the dynamic evolution of the Earth and its fundamental difference to all other rocky planetary bodies in our solar system. Despite recent progress, the question about how a stiff, mostly stagnant planetary lid can break and become part in the global overturn of the mantle is still unresolved. Many mechanisms, externally or internally driven, are proposed in previous studies. Here, we present the results on subduction initiation obtained by dynamically self-consistent, time-dependent numerical modelling of mantle convection. We show that the stress distribution and resulting deformation of the lithosphere are strongly controlled by the top boundary formulation: A free surface enables surface topography and plate bending, increases gravitational sliding of the plates and leads to more realistic, lithosphere-scale shear zones. As a consequence, subduction initiation induced by regional mantle flow is demonstrably favoured by a free surface compared to the commonly applied, vertically fixed (i.e. free-slip) surface. In addition, we present global, three-dimensional mantle convection experiments that employ basal heating that leads to narrow mantle plumes. Narrow mantle plumes impinging on the base of the plate cause locally weak plate segments and a large topography at the lithosphere-asthenosphere boundary. Both are shown to be key to induce subduction initiation. Finally, our model self-consistently reproduces an episodic lid with a fast global overturn due to the hotter mantle developed below a former stagnant lid. We conclude that once in a stagnant-lid mode, a planet (like Venus) might preferentially evolve by temporally discrete, global overturn events rather than by a continuous recycling of lid and that this is something worth testing more rigorously in future studies.
Keywords: Subduction initiation, Plate tectonics, Mantle convection, Numerical modelling, Planetary evolution, Geodynamics
Introduction
Earth-like planets lose the heat in their interiors by man-tle convection. Part of manman-tle convection is the cold top boundary layer: The surface boundary layer is either stagnant on top of a flowing mantle or, which seems less common, it is mobile and also part of the vertical flow into and out of the deep mantle (Bercovici 2003; Tackley 2000a,b). The observed high abundance of stag-nant lid convection and the fact that mantle viscos-ity is strongly temperature-dependent and thus likely
*Correspondence: [email protected]
1Centre for Earth Evolution and Dynamics, University of Oslo, postbox 1028 Blindern, 0315 Oslo, Norway
2Department of Earth Sciences, University College London, Gower Street, WC1E 6BT London, UK
Full list of author information is available at the end of the article
to produce a stagnant lid (Moresi and Solomatov 1995) indicate that the Earth might have evolved through a stagnant-lid phase in between its early magma ocean phase and its current mobile-lid phase (Sleep 2000; Stern 2007).
To understand how a system evolves from a stagnant-lid to a mobile-lid mode, we need to understand how sub-duction starts (Gerya 2012; van Hunen and Moyen 2012): Subduction is the main driver of the mobile surface plates on present-day Earth (Conrad and Lithgow-Bertelloni 2002; Forsyth and Uyeda 1975). Yet, subduction initia-tion (SI) from an initial stagnant lid is still an unresolved problem despite the many mechanisms that have been proposed to break and/or subduct an intact or laterally heterogeneous lithosphere. These mechanisms include,
for example, nucleation from an existing rupture pro-duced either by a meteorite impact (Hansen 2007), by a transform fault (Gurnis et al. 1998; Hall et al. 2003; Nikolaeva et al. 2010), by an oceanic plateau (Nair and Chacko 2008; Niu et al. 2003) or by a major episode of delamination (Toth and Gurnis 1998). Different weaken-ing mechanisms like the addition of water or melt into the lithosphere (Dymkova and Gerya 2013; Hirth and Kohlstedt 2003), grain-size reduction (e.g. Bercovici and Ricard 2005, 2013, 2014; Karato et al. 1980, 1986; Rozel et al. 2011), void generation (Bercovici 1998; Regenauer-Lieb 1998) or shear-heating (Crameri and Kaus 2010; Lu et al. 2015; Thielmann and Kaus 2012; Yuen et al. 1978) have been proposed to be a key in subduction initiation by providing a necessary weak and localised, lithospheric-scale shear zone. Although the elastic response of the lithosphere and mantle can be ignored over long times (>1 million years), elasticity might play an important role in subduction initiation (e.g. Hall et al. 2003; Regenauer-Lieb et al. 2001; Thielmann and Kaus 2012; Toth and Gurnis 1998). Mechanisms like the interaction of thermo-chemical plumes with the lithosphere (Burov and Cloetingh 2010; Burov and Gerya 2014; Ueda et al. 2008) or small-scale convection in the sub-lithospheric mantle (Solomatov 2004) might further be able to break an intact lid. It is, however, clear that the question of how subduction might initiate and evolve to its present state remains unclear and elusive (see e.g. Gerya 2011).
Spontaneous initiation and forced initiation are the two principle mechanisms believed to discriminate the key physics involved in subduction initiation during a mobile-lid phase (e.g. on present-day Earth). Spontaneous sub-duction initiation, on the one hand, is driven solely by the buoyancy contrast of adjacent plates. The density excess of the cold plate compared to its surrounding acts as the primary driving force for subduction (Vlaar and Wortel 1976). The most favourable tectonic setting for sponta-neous subduction initiation is a passive margin along an old continent due to its large density contrast (Cloetingh et al. 1989; Nikolaeva et al. 2010). Induced subduction initiation, on the other hand, is characterised by external forces supporting plate convergence. To finally reach self-sustaining subduction, these external forces need to act as long as the negative buoyancy of the underthrusting plate does not exceed the resisting forces for subduction (Mckenzie 1977). The most favourable tectonic setting for induced subduction initiation is therefore a pre-existing plate boundary (e.g. a transform fault or a spreading centre) during a change in plate motion direction.
Although there are many present-day observations of the cessation of subduction zones due to the collision of the trench with, e.g. positively buoyant continents, oceanic plateaus, magmatic arcs or ridges (e.g. Isacks and Molnar 1969), there is less evidence of recent subduction
initiation. A few subduction zones are believed to have initiated during the Cenozoic (Gurnis et al. 2004): Apart from the South Sandwich subduction zone, which might have initiated due to a subduction polarity reversal (Crameri and Tackley 2014), they have all appeared in the intra-oceanic setting of the Pacific basin.
Of all the rocky planets of our solar system, a mobile lid is operating only on the Earth. While Mercury has an immobile lithosphere that is heavily marked by mostly old impact craters and volcanic activity, these markers have been modified by the atmosphere and surface flu-ids (water or melts) on Mars. Below its dense atmo-sphere, Venus also reveals a heavily cratered lithosphere that is dated by crater statistics to be 500–750 Ma old (McKinnon et al. 1997; Schaber et al. 1992). A global resur-facing event is believed to have happened on Venus during that time, after which the planet formed and retained its stagnant lid. On the long term, Venus’ dynamic evolu-tion is believed to be characterised by the episodic style of plate tectonics, where long-lasting stagnant-lid periods are interrupted by short, dramatic periods of global over-turns (Armann and Tackley 2012; Moresi and Solomatov 1998; Reese et al. 1999). The difference between Venus and Earth is believed to be caused the absence of water (Venus’ surface is dry, e.g. Kaula 1999) and the impact of the dense atmosphere (Venus’ surface is hot), which for example reduces the tendency to localise lithosphere-scale thermal shear faults (Crameri and Kaus 2010) or increases healing rates of damaged zones in the litho-sphere (Landuyt and Bercovici 2009). Other mechanisms like damage rheology and its feedback with grain size are further discussed to explain a planet’s tendency to develop a mobile-lid style of plate tectonics (e.g. Foley et al. 2012). In the following, we present new insights on breaking a stagnant lid by (i) small-scale convection in combina-tion with a free surface and by (ii) global mantle con-vection in combination with either a lateral gradient in mantle temperature or narrow plumes impinging on the base of the lithosphere. Finally, a self-consistent global overturn is produced using numerical modelling on a three-dimensional sphere.
Methods/Experimental
For this numerical modelling study, we use two different model setups. The first is a simplistic regional model in 2D Cartesian geometry that is reproduced from a pre-vious study by Solomatov (2004) and intended to char-acterise subduction initiation by small-scale convection. The second is a global model in either 2D Cartesian or 3D spherical geometry. It is used to study subduction initia-tion and the episodic-lid style of plate tectonics within the framework of global mantle convection.
The corresponding non-dimensional equations for con-servation of mass, momentum and energy are thus
∇ · v=0 (1)
∇ ·σij− ∇p=RaTeˆz (2)
∂T
∂t = ∇
2T− v· ∇T+H (3)
wherevis the velocity,σijis the deviatoric stress tensor,
pis the pressure, Ra is the temperature-based Rayleigh
number,Tis the temperature,eˆzis the vertical unit vector,
tis the time andHis the non-dimensional internal heating rate.
Regional model
The first, regional model setup is used to investigate the ability of small-scale convection to initiate subduc-tion (see “Subducsubduc-tion initiasubduc-tion by small-scale convec-tion” section). The model is similar to the one used and explained by Solomatov (2004). His model is reproduced and compared to additional models that are extended by employing a free surface instead of the usual free-slip sur-face. The models are run in 2D Cartesian domains with a 4:1 aspect ratio and are purely internally heated and cooled from above. The model boundaries are reflective on the sides and free slip at the bottom and the top, while some models use a sticky-air layer to approximate a free surface (Crameri et al. 2012a; Matsumoto and Tomoda 1983; Schmeling et al. 2008). The models start with a fully intact stagnant lid and use a slightly cooler initial mantle temperature than what is expected for a quasi steady state to which the models then self-consistently evolve to.
The viscosity is defined by a simple exponential law (using the Frank-Kamenetskii approximation to reduce the resulting viscosity contrast) as
η (T)=bexp(−θT) (4)
wherebis a constant,θ is the Frank-Kamenetskii
param-eter (given in Table 1) and T is the temperature. The
viscosity variation is limited to 10 orders of magnitude by the limitsηminandηmax(see Table 3). The heating-based
Rayleigh number,RaH,0 = 0.1, defined at the surface for
this regional model is
RaH,0= ρ
2gαHD5
kbκ (5)
whereρis the density,g is the gravitational acceleration,
α is the thermal expansion coefficient, D is the depth
of the convective layer andk andκ are the coefficients
of thermal conductivity and diffusion, respectively. The effective yield stress for the regional model, which can be depth-dependent, is defined by
σy=σy,const+ σy·d (6)
whereσy,constis a depth-constant yield stress, σyis the
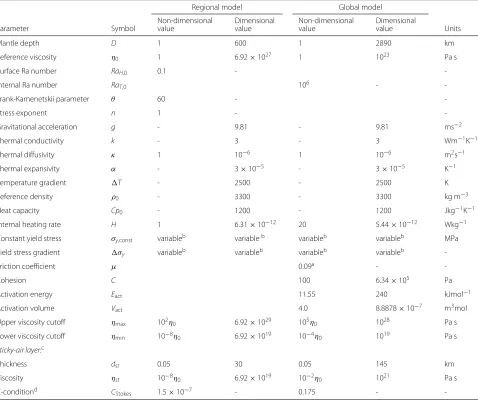
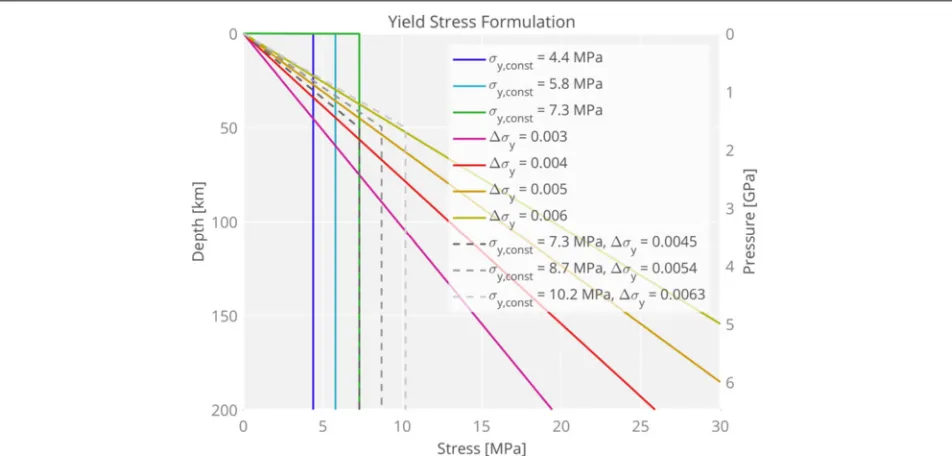
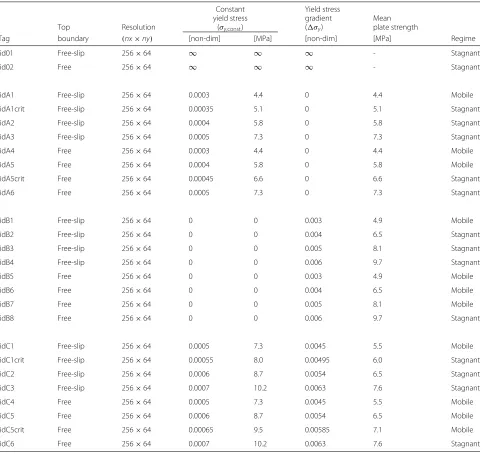
yield stress gradient anddis the vertical coordinate. The three different yield stress envelopes applied here are pre-sented in Fig. 1 and the specific experimental setup is further explained in Table 2.
Dimensionalization
The model described in this section is dimensionalized using the thicknessDof the modelled layer for the length scale,D2/κfor the timescale andρHD2/κfor the
temper-ature scale. The depth of the convective layer D = 600
km is estimated from the vertical extent of a small-scale convective cell, which is on the order of 500–1000 km (Solomatov 2004). The thermal diffusivity is given byκ =
k/ρCp0,ρis the density,H = 6.31×10⁻¹²W/kg is the
internal heating rate andCp0is the heat capacity.
Global model
A second, global model setup is chosen to study sub-duction initiation on the global scale. It is intended to analyse the findings of the regional model in a more com-plete, global framework and to produce time-dependent 3D, global mantle convection including hot mantle plumes in a dynamically self-consistent way. To account for the dynamical effect of narrow mantle plumes (e.g. Davies 1994; Morgan 1972), which predominantly form at the CMB and sample the lowermost lower mantle (Cagney et al. 2016), it is important to cover the whole man-tle depth. The experiments are, therefore, calculated in a larger domain than the previous regional studies and that comprises the whole mantle depth: They are either in 2D Cartesian or in a 3D full spherical shell geome-try. The model assumes the Boussinesq approximation and the rheology is strongly temperature- and pressure-dependent:
η (T,p)=ηA·exp
Eact+pVact RT
(7)
where η is the viscosity, p is the pressure, R = 8.314
Jmol−1K−1 is the gas constant, T is the temperature,
Eact = 240 kJ/mol is the activation energy, Vact =
8.89·10−7 m3mol is the activation volume and the
pre-exponential constantηAis set such thatηis the reference
viscosity (η0) atT =1600 K andp=0 Pa. A
temperature-based Rayleigh number of RaT,0 = 106 is used for the
global models and given by
RaT,0= ρ
gα TD3
η0κ
(8)
where T is the temperature scale, and the model can
Table 1Parameters used in this study
Regional model Global model
Non-dimensional Dimensional Non-dimensional Dimensional
Parameter Symbol value value value value Units
Mantle depth D 1 600 1 2890 km
Reference viscosity η0 1 6.92×1027 1 1023 Pa s
Surface Ra number RaH,0 0.1 -
-Internal Ra number RaT,0 106 -
-Frank-Kamenetskii parameter θ 60 -
-Stress exponent n 1 -
-Gravitational acceleration g - 9.81 - 9.81 ms−2
Thermal conductivity k - 3 - 3 Wm−1K−1
Thermal diffusivity κ 1 10−6 1 10−6 m2s−1
Thermal expansivity α - 3×10⁻⁵ - 3×10⁻⁵ K−1
Temperature gradient T - 2500 - 2500 K
Reference density ρ0 - 3300 - 3300 kg m−3
Heat capacity Cp0 - 1200 - 1200 Jkg−1K−1
Internal heating rate H 1 6.31×10⁻¹² 20 5.44×10⁻¹² Wkg−1
Constant yield stress σy,const variableb variableb variableb variableb MPa
Yield stress gradient σy variableb variableb variableb variableb
-Friction coefficient μ 0.09a -
-Cohesion C 100 6.34×10⁵ Pa
Activation energy Eact 11.55 240 kJmol−1
Activation volume Vact 4.0 8.8878×10⁻⁷ m3mol
Upper viscosity cutoff ηmax 102η0 6.92×1029 105η0 1028 Pa s
Lower viscosity cutoff ηmin 10−8η0 6.92×10¹⁹ 10−4η0 1019 Pa s
Sticky-air layer:c
Thickness dst 0.05 30 0.05 145 km
Viscosity ηst 10−8η0 6.92×10¹⁹ 10−2η0 1021 Pa s
C-conditiond C
Stokes 1.5×10⁻⁷ - 0.175 -
-aIndicated is standard setup; parameter variation is mentioned separately bFor actual values, see Tables 2 and 3
cIf applied
dIndicates suitable free-surface approximation with sticky-air approach ifC
Stokes1 (Crameri et al. 2012a)
σy,brittle=C+pμ (9)
with specified friction coefficient μ and cohesion C. A
few models presented here additionally use a maximum, ductile yield stress given by
σy,ductile =σy,const+ σy·d (10)
whereσy,constis the surface value of the ductile yield stress,
σyis the ductile yield stress gradient anddis the
non-dimensional depth ranging from 0 (top) to 1 (bottom). The effective yield stress for the global model is then given by
σy=minσy,brittle,σy,ductile
(11)
Finally, the viscosity variation is limited to 9 orders of magnitude by applying an upper and a lower
cut-off of ηmax = 105η0 and ηmin = 10−4η0 (see
Table 1).
A low-viscosity asthenosphere is accounted for in the 3D global model setup using two methods: a
depth-dependent viscosity increase controlled by Vact and, if
applied, a “melting viscosity reduction” (MVR) controlled by a simple solidus function (see Tackley 2000b for a more detailed description).
Fig. 1Applied yield stress profiles in regional models. Yield stress envelopes for the different experiments with either depth-constant ( σy=0), depth-dependent (σy,const= ∞) or composite (σy,const= ∞, σy=0) yield stresses. The transition between brittle (i.e. depth-dependent) and ductile (i.e. depth-constant) yielding is set to occur in the middle of the plate, at 50 km depth
Numerical model
All experiments presented here are calculated by the code STAGYY (Tackley 2008), which is based on a finite-volume discretization and a multigrid flow solver. Non-diffusive tracers track the different compositions (regular man-tle and sticky air) if applied. To allow for a free evo-lution of surface topography, a sticky-air layer is used (Matsumoto and Tomoda 1983; Schmeling et al. 2008), which is a good approach for simulating a free surface in an Eulerian grid. It consists of low viscosity “air” of (nearly) zero density that decouples the surface of the lithosphere from the top of the model domain. For a good free-surface treatment, this air layer has to (a) be sufficiently thick and (b) have sufficiently low viscosity (Crameri et al. 2012a). Using the actual viscosity of air or water is computationally unfeasible, but the application
of the test conditions (e.g. CStokes 1) provided by
Crameri et al. (2012a) show that the sticky-air viscos-ity assumed here is sufficiently low in combination with the layer thickness to properly allow changes in topog-raphy that are driven by mantle convection (see Table 1 for sticky-air parameters including theirCStokes values).
The effective surface topography is tracked using the com-position tracers (i.e. searching the interface between air and rock), which allows for subgrid resolution. In the case of a fixed, free-slip top boundary, a traction-derived surface topography is calculated, which is, however, only a valid approximation, if the resulting topography ful-fils several criteria (see Crameri et al. 2012a). Finally, our sticky-air models have been tested rigorously earlier in
terms of both surface topography (Crameri et al. 2012a) and plate tectonic characteristics (Crameri and Tackley 2015).
The numerical data in this study is processed and
visualised using either STAGLAB (www.fabiocrameri.ch/
software) or VISIT(Childs et al. 2012).
Plume-tracking software
For this study, a plume-tracking algorithm implemented in STAGLAB is used (see Fig. 10) in order to track hot
upwellings that are connected to the hot boundary layer at the base of the convecting mantle similar to the one used in Labrosse (2002).
A temperature at a given location is marked as an anomaly, if it exceeds a certain threshold (fhot) in the range
between the horizontally averaged temperature (Tmean)
and the maximum temperature (Tmax) at a given depth
level (z) according to
TA,hot(z)=Tmean(z)+fhot[Tmax(z)−Tmean(z)]
(12)
where a threshold offhot=1 (orfhot=0) defines
anoma-lies that are 100 % (or 0 %) hotter than the horizontal aver-age in the possible range between mean and maximum temperature.
Table 2Regional model setups
Constant Yield stress
yield stress gradient Mean
Top Resolution (σy,const) ( σy) plate strength
Tag boundary (nx×ny) [non-dim] [MPa] [non-dim] [MPa] Regime
lid01 Free-slip 256×64 ∞ ∞ ∞ - Stagnant
lid02 Free 256×64 ∞ ∞ ∞ - Stagnant
lidA1 Free-slip 256×64 0.0003 4.4 0 4.4 Mobile
lidA1crit Free-slip 256×64 0.00035 5.1 0 5.1 Stagnant
lidA2 Free-slip 256×64 0.0004 5.8 0 5.8 Stagnant
lidA3 Free-slip 256×64 0.0005 7.3 0 7.3 Stagnant
lidA4 Free 256×64 0.0003 4.4 0 4.4 Mobile
lidA5 Free 256×64 0.0004 5.8 0 5.8 Mobile
lidA5crit Free 256×64 0.00045 6.6 0 6.6 Stagnant
lidA6 Free 256×64 0.0005 7.3 0 7.3 Stagnant
lidB1 Free-slip 256×64 0 0 0.003 4.9 Mobile
lidB2 Free-slip 256×64 0 0 0.004 6.5 Stagnant
lidB3 Free-slip 256×64 0 0 0.005 8.1 Stagnant
lidB4 Free-slip 256×64 0 0 0.006 9.7 Stagnant
lidB5 Free 256×64 0 0 0.003 4.9 Mobile
lidB6 Free 256×64 0 0 0.004 6.5 Mobile
lidB7 Free 256×64 0 0 0.005 8.1 Mobile
lidB8 Free 256×64 0 0 0.006 9.7 Stagnant
lidC1 Free-slip 256×64 0.0005 7.3 0.0045 5.5 Mobile
lidC1crit Free-slip 256×64 0.00055 8.0 0.00495 6.0 Stagnant
lidC2 Free-slip 256×64 0.0006 8.7 0.0054 6.5 Stagnant
lidC3 Free-slip 256×64 0.0007 10.2 0.0063 7.6 Stagnant
lidC4 Free 256×64 0.0005 7.3 0.0045 5.5 Mobile
lidC5 Free 256×64 0.0006 8.7 0.0054 6.5 Mobile
lidC5crit Free 256×64 0.00065 9.5 0.00585 7.1 Mobile
lidC6 Free 256×64 0.0007 10.2 0.0063 7.6 Stagnant
See “ Regional model” section for more explanations
Table 3Global model setups
Constant
Top yield stressa Friction
Box boundary Resolution (σy,const) coefficient Heating
Tag geometry condition (nx×ny×nz×nb) [MPa] (μ) mode
global1 Cartesian Free-slip 2048×1×256 21.7 0.005 Purely internal
global2 Cartesian Free 2048×1×256 21.7 0.005 Purely internal
global3 Spherical Free-slip 128×384×64×2 190b 0.09 Internal & bottomc
global4 Spherical Free 128×384×64×2 190b 0.09 Internal & bottomc
aIn addition to a brittle, depth-dependent yield stress (see “Global model” section for more details) bGiven is the surface value that increases with depth according toσ
y,ductile=σy,const+ σy·d, where σy=0.025 anddis the non-dimensional depth ranging from 0 (top) to 1 (bottom)
connected pixels in a matrix (e.g. Kovesi 2000). In this study, anomalously hot features are tracked in order to visualise active upwellings and their specific threshold value is given in the respective figure captions.
Results
Here, we test first the ability of small-scale convection to initiate subduction with the two different top boundary conditions and, second, the importance of basal heating and an initial stagnant-lid phase on the mode of plate tectonics in global models of mantle convection.
Subduction initiation by small-scale convection
A lithosphere below a free surface can be expected to develop a different stress pattern (e.g. through slight convection-induced bending) than a lithosphere that is vertically fixed at its top (Thielmann et al. 2015). We, therefore, compare the behaviour of an intact, stagnant lid that is either vertically fixed or can freely evolve in the vertical direction. Solomatov (2004) provides a numerical study of such a setup (using a vertically-fixed, free-slip top boundary) that investigates the ability of stresses exerted by sub-lithospheric small-scale convection to break a stagnant lid. Some of these models are reproduced and compared to additional models with a free surface.
No yield stress
Deformation in Earth’s mantle is mainly controlled by its temperature- and pressure-dependent rheology. Yet, it is now an established fact that a temperature- and pressure-dependent rheology alone leads to a flowing mantle with a stagnant lid on its top (Nataf and Richter 1982; Ratcliff et al. 1997; Solomatov 1995; Stengel et al. 1982). The cold, stagnant top boundary layer is thereby too strong to be broken apart by the stresses exerted via the coupling to the convecting, low-viscosity mantle underneath: Subduc-tion does not initiate. The convective stresses are thereby focussed at the uppermost part of the lid, its coldest and thus strongest part (see Fig. 2a and Additional file 1: Figure S1.1). A non-Newtonian weakening mechanism like brit-tle or ductile yielding has previously been shown to be the key mechanism to prevent a stagnant lid and to allow for subduction (Tackley 2000a).
For the study on subduction initiation by small-scale convection enabled by plastic yielding, we therefore present three suites of a simple regional model with either a simple depth-constant yield stress, a depth-dependent yield stress or a more realistic, composite yield stress by superimposing the two previous formulations (see Fig. 1).
Depth-constant yield stress
Solomatov (2004) employed experiments with varying plate strength that tested different constant (i.e. depth-independent) yield stresses. In one set of experiments,
the lithosphere weakened solely by employing a (non-dimensional) depth-independent yield stress σy,const. He
found that small-scale convection is able to initiate sub-duction in weak plates withσy,const = 0.0003 (4.4 MPa)
but not in “strong” plates withσy,const=0.0004 (5.8 MPa).
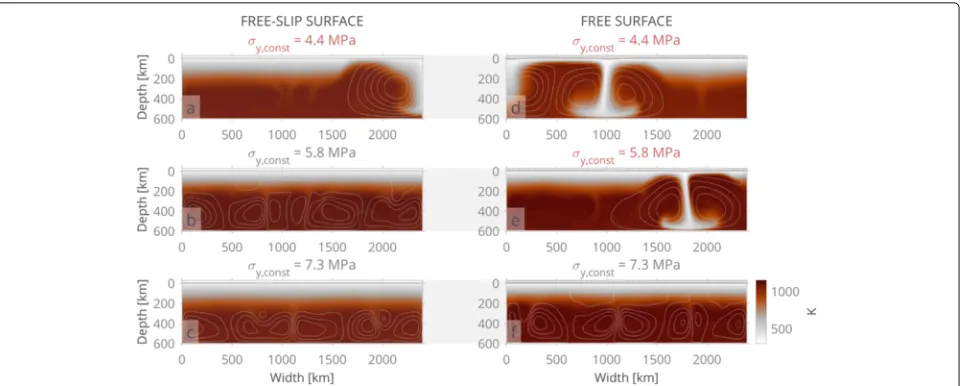
This result is confirmed by our models shown in Fig. 3a–c. Interestingly, subduction of a “strong” plate with
σy,const = 0.0004 (5.8 MPa) can be initiated using the
same model setup plus a free surface (Fig. 3e). The time it takes for subduction to initiate is longer than in the case with a lowerσy,const, where subduction occurs more
read-ily (Fig. 3d). An even stronger plate withσy,const=0.0005
(7.3 MPa), however, can resist stresses exerted by small-scale convection even with a free surface and does not result in subduction initiation (Fig. 3f).
Depth-dependent yield stress
In a second suite of experiments, we consider a Byerlee-type, depth-dependent yield stress, again according to
Solomatov (2004). The minimum variation of the σy
parameter between two different experiments is as low as possible to still be resolved spatially: The verti-cal resolution at lithospheric depths is around 10 km, which still resolves a change of the yield stress gradi-ent ( σy) of±0.001 at around 100 km depth (i.e. at the
lithosphere-asthenosphere boundary) in the parameter range chosen (see Fig. 1). This is important to consider because the numerical grid slightly differs between the two models due to the missing/presence of the sticky-air layer.
Similarly to the depth-constant yield stress experi-ments, this comparison indicates that a free surface favours subduction initiation in comparison to a verti-cally fixed (free-slip) surface (see Table 2 and Additional file 1: Figures S1.3 and S1.4). Experiments with a verti-cally fixed surface develop subduction only until a yield
stress gradient of σy = 0.0003 but not for higher
val-ues. Higher values of up to σy = 0.0005, however,
still yield subduction in the free surface experiments.
A yield stress gradient of σy = 0.0006 finally
pre-vents subduction caused by small-scale convection in both models.
Composite yield stress
The third suite of experiments shown in Fig. 4 with the regional model applies a more Earth-like composite yield stress, with a brittle, depth-dependent yield stress in the upper part and a ductile, depth-constant part in the lower part of the lithosphere. The cross-over between brittle and ductile yielding is set such that it occurs approximately in the middle of the lithosphere, which is here set at 50 km depth.
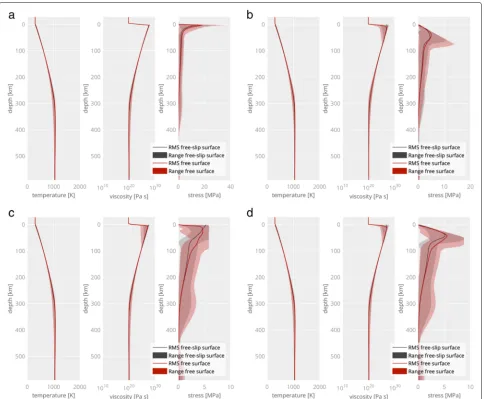
Fig. 2Radial parameter profiles of regional models. Radial profiles of experiments withano yielding,bdepth-dependent yielding,cdepth-constant yielding anddcomposite yielding with a transition at 50 km depth. Shown in each subplot are temperature (left), viscosity (middle) and second invariant of stress (right) for both regional models with either a free-slip surface (grey) or a free surface (orange)
The maximum ductile yield stress that still allows
subduction to occur isσy,const = 0.0005 (7.3 MPa) and
σy,const = 0.00065 (9.5 MPa) for the free-slip and the
free surface model, respectively. Limiting the strength of the lithosphere at shallow depth therefore allows for a 64 % stronger lower part that still entirely yields and subsequently subducts.
Free slip versus free surface
Modelling of mantle convection becomes more realistic when the top surface of the mantle is treated as a free surface instead of being vertically fixed (i.e. free slip): A free surface allows for natural plate bending (Crameri et al. 2012b). The plate bending in turn causes a characteristic lithospheric stress pattern resulting in two thin (instead of
one thick) horizontal layers of high stress (Crameri 2013; Thielmann et al. 2015).
Fig. 3Occurrence of SI with variable constant yield stresses. Subduction initiation by small-scale convection (after Solomatov 2004) depending on the constant yield stressσy,constthat varies from the dimensional value of (a,d)σy,const=4.4 MPa (lidA1 &lidA4) to (b,e)σy,const=5.8 MPa (lidA2 & lidA5) and (c,f)σy,const=7.3 MPa (lidA3 &lidA6). The temperature fields are shown for experiments employing a free-slip surface (left hand side column) and a free surface (right hand side column).Grey contoursindicate streamlines of the flow and thered title colourindicates occurrence of SI
entirely into horizontal deformation due to mass con-servation. A vertically, or near-vertically dipping shear zone (e.g. at 45°) therefore always involves a significant amount of horizontal strain, which causes the localised deformation to widen horizontally.
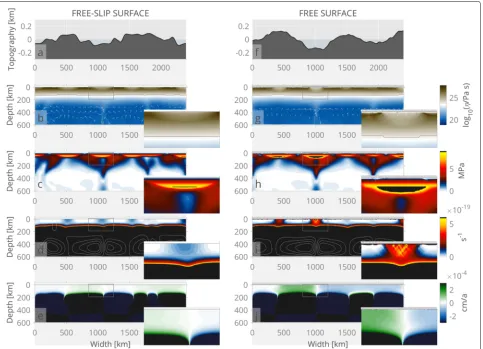
The free surface, on the contrary, enables a lithosphere-scale shear zone to maintain its strain direction through-out the plate interior to the plate surface by creating actual topography there. Since a single fault is rarely able to accommodate the total horizontal deformation of the plate, a characteristic crisscrossing pattern of aligned and
mirrored shear zones dipping at around 45° forms as is visible in Fig. 5g, i. This feature occurs throughout all the free-surface experiments considered here independent of applied yielding formulation, their time-dependent evo-lution or the numerical resoevo-lution (see Additional file 1: Figures S1.5 and S1.6). Additional figures and a movie show this in more detail (see Additional file 1: Figures S1.2 and S1.3, and the Additional file 2). Small-scale horst and graben-like structures are thereby the topographic result of multiple normal or reverse faults situated next to each other in regions of extension or compression, respectively
Fig. 4Occurrence of SI with variable composite yield stresses. Subduction initiation by small-scale convection (after Solomatov 2004) depending on the composite yield stress that is varied between (a,d)σy,const=7.3 MPa with σy=0.0045 (lidC1 &lidC4), (b,e)σy,const=8.7 MPa with
σy=0.0054 (lidC2 &lidC5) and (c,f)σy,const=10.2 MPa with σy=0.0063 (lidC3 &lidC6). The temperature fields are shown for experiments employing a free-slip surface (left hand side column) and a free surface (right hand side column).Grey contoursindicate streamlines of the flow and the
Fig. 5Free-slip versus free surface steady-state stagnant lid. Small-scale convection experimentslidC2 with a free-slip surface (left hand side column) andlidC5 with a free surface (right hand side column) both employing a composite yield stress with a yield stress gradient of σy=0.0054 and a dimensional, constant yield stress ofσy,const=8.7 MPa.aSurface topography of the free-slip top boundary model that is calculated from the
normal stress occurring at the vertically fixed, top domain boundary andfthe actual topography that occurs in the model with the free top boundary.b,gEffective viscosity and the 700 K contour (black line),c,hsecond invariant of the strain rate,d,isecond invariant of stress ande,j horizontal velocity are shown for both models, wheregreen coloursindicate flow in clockwise direction. If applied, the sticky-air layer is removed visually and replaced with a hatched grey area. Very high values are clipped in regions where they exceed a certain maximum value (black areas).
White arrowsandgrey streamlinesindicate the flow direction and pattern
(Fig. 5f). In contrast to the broad, diffuse shear zones in the free-slip surface models, straight and localised defor-mation zones occurring in models with a free surface are more efficient to take up tectonic stresses and allow the shear zones to reach deeper. A shear zone that reaches the bottom of the lithosphere is a prerequisite for subduction initiation as has been pointed out by Fowler and O’Brien (2003). A model with a free surface might therefore favour subduction initiation as discussed below (see Fig. 6).
Another mechanism to cause deeper brittle yield-ing might be the slight time-dependent bendyield-ing of the plates while floating on a weaker, convecting mantle. The time-dependent mantle up- and downwellings induce a time-dependent vertical forcing on the plate floating above, which causes topography at the lithosphere-asthenosphere boundary (LAB). In the model where the
top surface is vertically fixed, this deflection at the base of the plate is accommodated by plate-internal deformation. Releasing the plate surface from its vertical fixity, however, causes the plate to deflect in its entirety: positive and neg-ative surface deflections matching the LAB topography occur above mantle up- and downwellings, respectively (Fig. 5f). The strong plate-internal deformation occurring in the model with a vertically fixed surface is reduced when applying a free surface and accommodated by verti-cal deflection of the whole plate: The plate is bending.
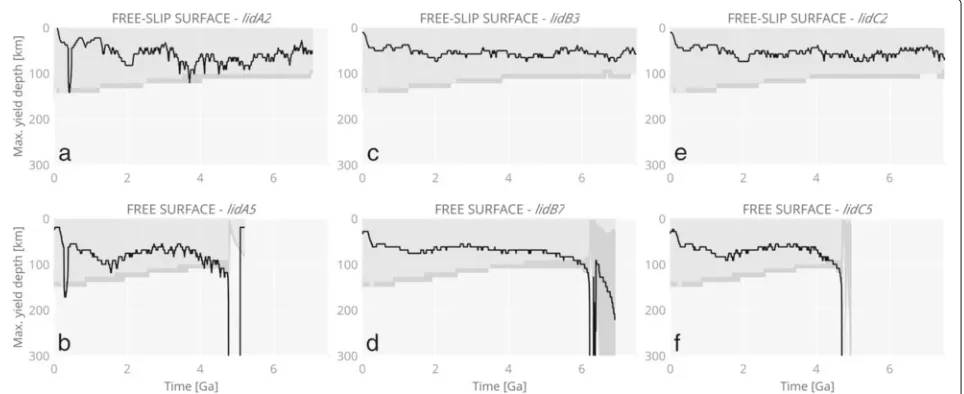
Fig. 6Time evolution of plastic-zone depth. Maximum depth of brittle yielding over time shown for the critical experimentsa,blidA2 andlidA5 with depth-constant yield stress,c,dlidB3 andlidB7 with depth-dependent yield stress ande,flidC2 andlidC5 with a composite yield stress, where there is no subduction with the free-slip surface (top row) but subduction with the free surface (bottom row). The depth of the thermal lithosphere (sampled atT=700 K and marked by ablack linein Fig. 5b, g) is indicated by the dark grey band, whereby its thickness indicates the range between the minimum and the maximum depth found at the given point in time. A sudden drop of the graph to deep levels (>200 km) indicates the initiation of subduction
both upper boundary conditions, the high stress pattern in the case of the composite yield stress experiments reaches deeper in the case of a free surface (Fig. 5c, h). Figure 2 shows the radial profiles of the root-mean-square (RMS) values of temperature, viscosity and the second invariant of the stress tensor for all models. The different stress distribution—solely caused by the free surface—is signif-icant in all experiments, even though temperature and viscosity profiles are similar.
Plate bending favours another important tectonic mech-anism: The lateral gradient in vertical plate deflection (i.e. tilting) causes a gravitation-induced, horizontal sliding of the plate segments. The plate segments, separated by the narrow weak zones of high deformation, tend to flow from the high pressure above mantle upwellings to the low pressure above mantle downwellings (Fig. 5e, j). The tilting of the plate segments together with the resulting gravitational sliding cause regionally high lithospheric stresses (in between tilted segments) that lead to increased and deeper yielding in the case with a free surface. In the models with a fixed surface, mantle up- and down-wellings cause lateral pressure gradients inside the plate that lead to horizontal flow similar to the gravitational sliding mentioned above. However, the plate segments are, due to the fixed top, not tilted and this does therefore not cause any additional stress.
The maximum depth of yielding can be taken as an indi-cator for lithosphere-scale shear zones. Figure 6 shows the maximum depth of brittle and/or ductile yielding dur-ing the temporal evolution of the models. The maximum
depth of yielding increases shortly after the model’s ini-tial state and during onset of convection in the mantle, while the plate thickness slowly decreases over time due to slight heating up of the model and subsequent erosion at the base of the plate. The different time-dependent fluc-tuation of the maximum yielding depth between free-slip and free surface models is mostly caused by the different top boundary conditions (and their implications) rather than variations in mantle flow, as the time-dependent evolution of the flow below the plate is similar for both model setups. Although the yielding occurs then through-out most of the thermal lithosphere in the free-slip model at around 3.8 Ga (see Fig. 6a), it does not exceed its maximum thickness: subduction does not initiate. The maximum depth of yielding exceeds, however, the depth of the thermal lithosphere in the free-surface model and subduction initiates (Fig. 6b). The same occurrence can be observed in the models applying a depth-dependent (Fig. 6c, d) or a composite yield stress (Fig. 6e, f). These experiments therefore show that subduction initi-ates once the model produces plastic failure down to the lithosphere-asthenosphere boundary.
The above results consider only small-scale convection, which is only one feature in a long list of possible trig-gers for subduction initiation in global models as the ones presented subsequently.
Subduction initiation by large-scale convection
account for additional triggers of lithosphere-scale fail-ure. Global-scale convective cells and narrow plumes rising from the core-mantle boundary (CMB) imping-ing the base of the lithosphere are just two of these mechanism that we focus on in the following sections.
Global stagnant-lid convection
In our global models, we apply both a stronger plate (than in the regional models) and a high plate-mantle viscosity contrast in order to prevent double-sided sub-duction and instead enable realistic, single-sided subduc-tion (Crameri et al. 2012b). Necessitating a strong plate, single-sided subduction is therefore harder to initiate. Global-scale flow that produces wide mantle flow cells (i.e.>400 km) might, however, induce significantly higher lithospheric stresses and thus facilitate subduction initia-tion (e.g. Wong and Solomatov 2015). The global models presented in this section can, in contrast to the regional models above, where flow cells in the mantle are relatively narrow (e.g. <400 km), account for the effect of wider convection cells.
The purpose of our global 2D models is to reproduce the findings of our regional models regarding lithospheric deformation features. Figure 7 presents such an experi-ment with the free surface, while Additional file 1: Figure S1.7 presents the corresponding experiment with the free-slip surface. Here, we slightly increase the strength of
the plate with a friction coefficient of μ = 0.005 and
a maximum yield stress of σy,const = 21.7 MPa. We
can indeed find the lithospheric criss-cross shear pat-tern again in the models where the surface evolves freely but not in the models where the surface is fixed ver-tically. Moreover, lithosphere-scale failure occurs early in the model evolution, even though these global mod-els apply a slightly higher yield stress than the regional models. This supports previous findings (e.g. Wong and Solomatov 2015) that global mantle flow with larger flow cells adds a significant amount of additional forcing to the lid at the surface. The exact amount of the additional forc-ing has to be, however, carefully investigated in a future study.
Narrow hot mantle plumes
In general, models with realistic (e.g. based on laboratory measurements) friction coefficient and/or yield stress fail to break an intact stagnant lid. Even models that produce on-going single-sided subduction are, up to this point, not able to initiate subduction once in a stagnant-lid mode (e.g. Crameri et al. 2012b). The global 3D model pre-sented in this section additionally includes narrow hot mantle plumes together with an even stronger plate that is, however, still relatively weak compared to laboratory
estimates (see “Discussion” section for an extended
dis-cussion) using a friction coefficient of μ = 0.09 and
a maximum yield stress of σy,const = 190.0 MPa. The
experiment presented here with the free-slip surface (i.e.
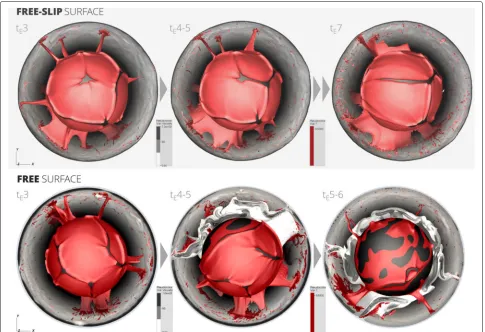
global3) therefore remains in stagnant-lid convection even after a long time of more than 6 Ga (bottom row of Figure 8 and Additional file 1: Figure S1.8). However, the corresponding experiment that additionally features a free surface (i.e. global4) spontaneously initiates subduction after starting in stagnant-lid mode (top row Figs. 8 and 9). An additional movie file shows this in more detail (see Additional file 3). The mantle plumes are caused by the combined heating from the bottom (i.e. from the CMB) as well as from within. The isothermal CMB thereby favours the development of narrow plumes that are able to locally weaken the lithosphere and hence to facilitate subduction initiation as was previously suggested by Ueda et al. (2008) and Burov and Cloetingh (2010). This model additionally applies a depth-constant, ductile yield stress in combina-tion with the depth-dependent yield stress (see Table 3). This helps to critically weaken the base of the plate and increases the impact that mantle plumes have on the cold plate.
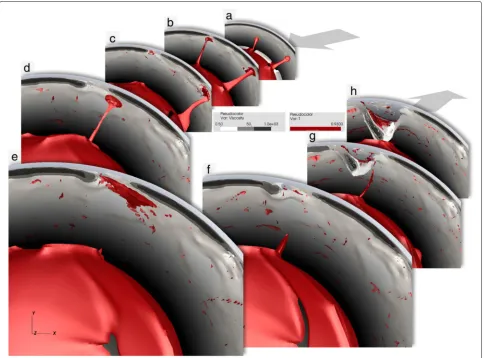
Figure 9 illustrates the time evolution in multiple snap-shots at the location of the initial subduction initia-tion inside the 3D spherical model. This event can be attributed to the following five phases.
Phase 1: Local lithospheric thinning by plumesis charac-terised by narrow rising plumes impinging the base of the fully intact, stagnant lid. The additional heat at the lithosphere-asthenosphere boundary (LAB) from the hot upwellings causes the lithosphere to locally weaken and to thin out (Fig. 9b).
Phase 2: Large LAB topographydevelops by the continued local thinning caused by mantle plumes and the asso-ciated thickening nearby caused by the return flow of the hot upwelling. The return flow consists of a lat-erally limited horizontal component (connecting up-and downwelling) up-and a downward component. Both are causing significant topography in the base of the lithosphere (Fig. 9c).
Phase 3: An additional plume pulseby a reactivation of the upwelling causes a broad patch of hot material spreading at the base of the thinned lid. This fur-ther weakens the already thin plate and causes a decoupling of the thick part of the lithosphere from its thinned surroundings (Fig. 9d).
Fig. 7Free surface steady-state stagnant-lid in the 2-D global models. Lithosphere-scale yielding induced by global-scale convection of experiment
global2 with a free surface. The model employs a composite yield stress with a yield stress gradient of σy=0.005 and a dimensional, constant yield stress ofσy,const=21.7 MPa. Shown areaeffective topography,beffective viscosity,csecond invariant of the stress, anddsecond invariant of
strain rate. The sticky-air layer is removed visually and replaced with a hatched grey area. Very high values are clipped in regions where they exceed a certain maximum value (black areas).White arrowsandgrey streamlinesindicate the flow direction and pattern
Phase 5: Subductionfinally takes place and the sinking slab rearranges the mantle flow in its surroundings: The typical poloidal flow in the mantle wedge and in the back-slab region and the toroidal flow around the slab edges form (Fig. 9g).
The observation of these five phases indicates that the occurrence of LAB topography (phase 2) and the heat-ing caused by hot mantle upwellheat-ings (phases 1 and 3) are here key to produce subduction initiation from a stagnant lid.
Global overturn event
Once a stagnant lid spontaneously initiates subduction, it can evolve either by an ongoing mobile lid or by an episodic lid that is characterised by temporally separated events with intermediate stagnant-lid phases (Tackley 2000a,b). In the latter case, a single episode of lithosphere recycling is termed a “global overturn”, which is believed to be the dominant mechanism in Venus’ dynamic evolution
(e.g. Armann and Tackley 2012; Reese et al. 1999). Here, we present and discuss a global, fully spherical model that produces, for the first time, such a global overturn event.
The time evolution of the model with both internal and basal heating is presented in Fig. 10. This exper-iment starts from a globe-covering, intact lid that has no lateral heterogeneities (like plate thickness variations or slabs). Due to heating at the CMB, several point-like, hot upwellings (i.e. mantle plumes) form and cause locally round locations of weakening at the base of the lithosphere (tE1). This weakening is enforced at later
stages of the evolution and the former point-like plumes start to merge (hence reducing their total number) and deform to more elongated, sheet-like structures at time
tE2. The flow in the upper mantle is mainly dominated
by these upwellings at this stage. The hot upwellings usually form thereby the centre of one of the several convection cells. At time tE3, subduction has initiated
Fig. 8Temporal evolution of both global, 3D spherical models with different top boundary conditions. The free-slip model (global3) remains in stagnant-lid mode (top row), while the free surface model (global4) produces subduction initiation and a subsequent global overturn event (bottom row). Cold plates are indicated by viscosity isosurfaces (grey) and hot mantle plumes by a temperature isosurface (red). Presented snapshots are taken attE3=5.29 Ga,tE4−5=5.66 Ga andtE7=6.49 Ga ortE5−6=6.09 Ga. An additional movie file shows the free surface model in more detail
(see Additional file 3)
close to but not exactly above one of the strongest hot anomalies. Single-sided subduction forms a horseshoe-shaped trench that kinks into one double-horseshoe-shaped structure and splits into a separately evolving
subduction zone at timetE4. The two subduction zones
subsequently propagate throughout the model forming more complex and wider structures until a nearly intact belt of subduction is covering the globe (tE5). Mantle
flow is now dominated by the sinking portions of the plates. A few anomalously hot upwellings supported by the CMB still remain. Subduction stops again, shortly after the recycling of most of the former stagnant lid at timetE6.
After spontaneously starting subduction from a stag-nant lid, the model evolves with a mobile lid until the oldest and hence coldest and strongest portions (i.e. the former stagnant lid) are recycled into the man-tle. Subduction acts quickly and so does not allow the newly created plate portions to cool down sufficiently to
become sufficiently negative buoyant. These portions can-not therefore continue to subduct and the systems falls back into stagnant lid mode. This global overturn event operates around 1.2 Ga.
Fig. 9Time snapshots of SI by global mantle flow. Temporal evolution of subduction initiation in a global, 3-D spherical experiment (global4) showing the cold plates by viscosity isosurfaces (grey) and mantle plumes by a temperature isosurface (red). Individual snapshots highlight the different phases characterised byaonset of hot mantle plumes,blocal lithospheric thinning,c-ddevelopment of strong LAB-topography through shallow horizontal mantle flow and an additional plume pulse,e-fplate failure, and finallyg-hbuoyancy-driven subduction
rather than by a continuous recycling of lid. This has strong relevance to Earth’s sister planet Venus, as it currently has no mobile lid, but is believed to recy-cle its surface episodically in such spectacular global-overturn events (e.g. Armann and Tackley 2012). The initial difference, however, that caused a stagnant-lid on Venus and a mobile lid on Earth might be explained by the absence of liquid water on Venus’ surface (Kaula 1999) and the impact of the hot, dense Venusian atmo-sphere, which can inhibit localisation of lithosphere-scale thermal shear faults (Crameri and Kaus 2010) or foster healing through increased grain-growth (Landuyt and Bercovici 2009).
Discussion
The goal of this study is to explore the initiation of Earth-like subduction using a modelling approach that is as simplified as possible while still retaining key first-order
physical characteristics. We consider these key charac-teristics to be a strongly temperature-dependent, visco-plastic rheology and a free surface. Hence, the two model setups presented here are not intended to be exact repli-cas of an Earth-like rocky planet, and the simplifications may cause some disagreements with nature. We therefore evaluate model features below.
Model features that are not in good agreement with natural observations are the plate thickness in the global models, which is larger than realistic due to a low effective Rayleigh number, and the relatively low maximum yield strength ofσy < 7 MPa obtained here for the initiation
of subduction by small-scale convection in the regional models: Even with a free surface, the latter is still around
two orders of magnitude lower than theσy ∼ 800 MPa
Fig. 10Global overturn event in 3D fully spherical model. Temporal evolution of an internally and basally heated, global spherical experiment (global4) starting from an initial stagnant lid (without initial subduction zone) shown by horizontal slides at 115 km (top subplot) and 786 km (bottom subplot) depth. Anomalously hot (fhot=0.45) regions compared to the horizontal mean temperature that are connected to the CMB are
extracted by the plume tracking software and indicated by ared contour. Time snapshots are taken at timestE1(1.45 Ga),tE2(4.8 Ga),tE3(5.29 Ga),tE4
coefficientμ ∼ 0.1 that mainly controls the lithospheric strength in the global models, when compared to esti-mates from lithospheric flexure and seismicity caused by oceanic islands,μ >0.25 (Zhong and Watts 2013), and to
laboratory rock measurements,μ ∼ 0.5−0.8. It should
be noted, though, that subduction initiation preferentially occurs at the weakest places of the lithosphere and that the models presented here do not have preexisting weak zones in contrast to nature. The plate as modelled here therefore has to be weak in its entirety. The occurrence of subduction initiation in our models both with and without localised upwellings (that locally weaken the lithosphere) implies, however, the importance of small- and large-scale convection to produce lithospheric stresses close to what is needed for nature-like lithosphere-scale failure.
In contrast, there are model features that have been improved to agree well with observations. Given the res-olution applied in the regional models, lithosphere-scale shear zones are modelled more realistically with a free sur-face than with a fixed sursur-face. This indicates that a free surface in subduction-initiation modelling is important.
Previous self-consistent spherical 3D models of plate tectonics with a free-slip surface and a lower viscosity contrast between cold plates and hot mantle have had no problem to spontaneously initiate subduction (e.g. Foley and Becker 2009; Nakagawa et al. 2010; Rolf and Tackley 2011; Tackley 2000a,b; van Heck and Tackley 2008). How-ever, compared to the global models presented here, they all lack realistic single-sided subduction—a key fea-ture of global mantle convection observed on Earth. The global model presented in this study, in contrast, develops nature-like subduction and is able to produce an episodic lid self-consistently even with a realistically high viscosity contrast (see Crameri and Tackley 2015).
Nevertheless, subduction initiation is still challenging even with the model presented here. There are, however, simplifying assumptions made here, which may hamper subduction initiation and might thus explain the current discrepancy between models and nature as listed below:
Low effective Rayleigh number: The relatively low effec-tive Rayleigh number as applied in the global model inhibits the occurrence of convection on a smaller scale. One consequence is a thicker and hence stronger lithosphere that resists failure and subduc-tion initiasubduc-tion more readily.
No elasticity: Both models presented here apply a simplified visco-plastic rheology, with no elastic-ity. Elasticity, however, might be important in the lithosphere as elastic bending operates on shorter time periods than the viscous bending consid-ered in this study (e.g. Zhong 2002). Moreover, elasticity might increase lithospheric stress at deep levels (Beuchert and Podladchikov 2010; Thielmann
et al. 2015). Although it might reduce the risk of lithospheric shear localisation at first due to the reduction of the total deformation work, it might additionally favour subduction initiation later on by releasing the stored elastic work into deforma-tion when a lithospheric shear zone has established (Thielmann and Kaus 2012).
No continental lithosphere: Both our models assume a compositionally homogeneous lithosphere (i.e. no continents). Continental lithosphere, however, might focus lithospheric stresses and hence foster subduc-tion initiasubduc-tion (Rolf and Tackley 2011).
No lithospheric weakening mechanisms:There is a long list of potential weakening mechanisms that are believed to support lithosphere-scale failure (as listed in the “Introduction” section). None of them are taken into account for the modelling presented here. Doing so would, however, further facilitate lithosphere-scale failure and subsequent subduction initiation.
An individual, systematic testing of the mentioned physical complexities in dynamically self-consistent, time-dependent global models seems therefore crucial and should be the focus of future studies.
Conclusions
The regional models presented here confirm that a
relatively low yield stress of σy < 7 MPa is needed
to allow for subduction to initiate due to lithospheric stresses induced by sub-lithospheric small-scale convec-tion. In this study, we show that subduction initiation by small-scale convection is, however, favoured by a free surface as compared to a vertically fixed, free-slip sur-face. A free rock-air interface causes surface down- and uplifts, enables plate bending and increases the horizontal, gravitational sliding of plate portions from high-pressure regions above mantle upwellings to low-pressure regions above mantle downwellings. A freely evolving rock-air interface further allows for more realistic, linear and nar-row lithosphere-scale shear zones. These shear zones pen-etrate through the whole plate by vertically offsetting rigid blocks at the surface and so lead to the characteristic criss-cross pattern. The combination of all of these features caused by a free surface finally increases the tendency for subduction to occur spontaneously out of an initial stagnant lid that is applied to the forcing of small-scale convection.
facilitate lithospheric failure. The mantle plumes impinge, on the other hand, at the base of the lithosphere create locally hot and weak patches, which cause a significant topography of the lithosphere-asthenosphere interface. This can lead to the removal of large pieces of lithospheric material by horizontal asthenospheric flow, which in turn might cause lithosphere-scale failure and subsequently subduction initiation.
Such a subduction initiation is then shown to be able to cause an episodic overturn of the planet. A stagnant-lid phase causes, thereby, the mantle to heat up due to lack of cooling-efficient subduction. When subduction is initi-ated in such a hot state, subduction operates much faster due to the hotter and thus weaker mantle. A fast global resurfacing event is the result, which consumes the old and cold lithosphere until it is stopped by the resulting, globally spanning young and still buoyant surface. In con-clusion, this indicates that once in a stagnant-lid mode, an Earth-like planet preferentially evolves by continuing in the episodic-lid rather than the mobile-lid mode of plate tectonics. However, this has to be tested with additional experiments spanning a wider parameter range.
Additional files
Additional file 1: Includes eight additional figures and corresponding description. (PDF 8288 kb)
Additional file 2: Movie of the experiment “lidC5” showing the temporal evolution of the regional model for (a) topography, (b) viscosity, the second invariant of (c) the stress and (d) the strain-rate tensor, (e) horizontal velocity and (f) the dominating deformation mechanism. (MOV 7114 kb)
Additional file 3: Movie of the experiment “global4” showing the temporal evolution of the global, fully spherical, 3D model with the hot temperature isosurface (red) and stiff viscosity isosurfaces (grey). (MOV 22192 kb)
Abbreviations
CMB: Core-mantle boundary; LAB: Lithosphere-asthenosphere boundary; SI: Subduction initiation
Funding
This work was supported by the Research Council of Norway through its Centres of Excellence funding scheme, project number 223272. This work was further supported by a grant from the Swiss National Supercomputing Centre (CSCS) under project ID s272. Some calculations were additionally performed on ETH’s Brutus high-performance computing cluster. Further methodical details and the raw numerical data can be requested from the author (www.fabiocrameri.ch).
Authors’ contributions
FC and PJT collaborated on developing the idea and designing the study. FC carried out and analysed the experiments. PJT wrote the code STAGYY. FC and PJT collaborated with the writing and read and approved the final manuscript.
Competing interests
The authors declared that they have no competing interests.
Author details
1Centre for Earth Evolution and Dynamics, University of Oslo, postbox 1028
Blindern, 0315 Oslo, Norway.2Department of Earth Sciences, University
College London, Gower Street, WC1E 6BT London, UK.3Department of Earth
Sciences, ETH Zurich, Sonneggstrasse 5, 8092 Zurich, Switzerland.
Received: 20 January 2016 Accepted: 19 August 2016
References
Armann M, Tackley PJ (2012) Simulating the thermochemical magmatic and tectonic evolution of Venus’s mantle and lithosphere: two-dimensional models. J Geophys Res 117(E12):12003
Bercovici D (1998) Generation of plate tectonics from lithosphere-mantle flow and void-volatile self-lubrication. Earth Planet Sci Lett 154(1–4):139–151 Bercovici, D (2003) The generation of plate tectonics from mantle convection.
Earth Planet Sci Lett 205(3–4):107–121
Bercovici D, Ricard Y (2005) Tectonic plate generation and two-phase damage: void growth versus grain size reduction. J Geophys Res 110(B3):03401 Bercovici, D, Ricard Y (2013) Generation of plate tectonics with two-phase grain-damage and pinning: source–sink model and toroidal flow. Earth Planet Sci Lett 365(0):275–288
Bercovici D, Ricard Y (2014) Plate tectonics, damage and inheritance. Nature 508(7497):513–516
Beuchert MJ, Podladchikov YY (2010) Viscoelastic mantle convection and lithospheric stresses. Geophys J Int 183(1):35–63
Burov E, Cloetingh S (2010) Plume-like upper mantle instabilities drive subduction initiation. Geophys Res Lett 37(3):03309
Burov E, Gerya T (2014) Asymmetric three-dimensional topography over mantle plumes. Nature 513(7516):85–89
Cagney N, Crameri F, Newsome WH, Lithgow-Bertelloni C, Cotel A, Hart SR, Whitehead JA (2016) Constraining the source of mantle plumes. Earth Planet Sci Lett 435:55–63
Childs H, Brugger E, Whitlock B, Meredith J, Ahern S, Pugmire D, Biagas K, Miller M, Harrison C, Weber GH, Krishnan H, Fogal T, Sanderson A, Garth C, Bethel EW, Camp D, Rübel O, Durant M, Favre JM, Navrátil P (2012) VisIt: an end-user tool for visualizing and analyzing very large data. In: High Performance Visualization–Enabling Extreme-Scale Scientific Insight. Taylor and Francis, Boca Raton. pp 357–372
Cloetingh S, Wortel R, Vlaar NJ (1989) On the initiation of subduction zones. Pure Appl Geophys 129(1–2):7–25
Conrad CP, Lithgow-Bertelloni C (2002) How mantle slabs drive plate tectonics. Science 298(5591):207–209
Crameri F, Kaus BJP (2010) Parameters that control lithospheric-scale thermal localization on terrestrial planets. Geophys Res Lett 37(9):09308 Crameri F, Schmeling H, Golabek GJ, Duretz T, Orendt R, Buiter SJH, May DA,
Kaus BJP, Gerya TV, Tackley PJ (2012a) A comparison of numerical surface topography calculations in geodynamic modelling: an evaluation of the ‘sticky air’ method. Geophys J Int 189(1):38–54
Crameri F, Tackley PJ, Meilick I, Gerya TV, Kaus BJP (2012b) A free plate surface and weak oceanic crust produce single-sided subduction on Earth. Geophys Res Lett 39(3):03306
Crameri F (2013) The interaction between subduction-related mantle currents and surface topography. PhD thesis. ETH Zurich
Crameri F, Tackley PJ (2014) Spontaneous development of arcuate single-sided subduction in global 3-D mantle convection models with a free surface. J Geophys Res Solid Earth 119(7):5921–5942
Crameri F, Tackley PJ (2015) Parameters controlling dynamically self-consistent plate tectonics and single-sided subduction in global models of mantle convection. J Geophys Res Solid Earth 120(5):3680–3706
Davies GF (1994) Thermomechanical erosion of the lithosphere by mantle plumes. J Geophys Res 99(88):15709–15722
Dymkova D, Gerya T (2013) Porous fluid flow enables oceanic subduction initiation on Earth. Geophys Res Lett 40(21):5671–5676
Foley BJ, Becker TW (2009) Generation of plate-like behavior and mantle heterogeneity from a spherical, viscoplastic convection model. Geochem Geophys Geosyst 10(8):08001
Foley BJ, Bercovici D, Landuyt W (2012) The conditions for plate tectonics on super-Earths: inferences from convection models with damage. Earth Planet Sci Lett 331–332(0):281–290
Forsyth D, Uyeda S (1975) On the relative importance of the driving forces of plate motion*. Geophys J R Astron Soc 43(1):163–200
Fowler A, O’Brien S (2003) Lithospheric failure on Venus. Proc Roy Soc Lond Math Phys Sci 459(2039):2663–2704
Gerya, T (2012) Origin and models of oceanic transform faults. Tectonophysics 522-523(0):34–54
Goetze C, Evans B (1979) Stress and temperature in the bending lithosphere as constrained by experimental rock mechanics. Geophys J Int 59:463–478 Gurnis M, Hall C, Lavier L (2004) Evolving force balance during incipient
subduction. Geochem Geophys Geosyst 5(7):07001
Gurnis M, Müller RD, Moresi L (1998) Cretaceous vertical motion of Australia and the Australian Antarctic discordance. Science 279(5356):1499–1504 Hall CE, Gurnis M, Sdrolias M, Lavier LL, Müller RD (2003) Catastrophic initiation
of subduction following forced convergence across fracture zones. Earth Planet Sci Lett 212(1–2):15–30
Hansen VL (2007) Subduction origin on early Earth: a hypothesis. Geology 35(12):1059–1062
Hirth G, Kohlstedt D (2003) Rheology of the upper mantle and the mantle wedge: a view from the experimentalists. In: Geophys. Monogr. Ser. AGU, Washington, DC Vol. 138. pp 83–105. http://dx.doi.org/10.1029/138GM06 Isacks B, Molnar P (1969) Mantle earthquake mechanisms and the sinking of
the lithosphere. Nature 223(5211):1121–1124
Karato S-I, Toriumi M, Fujii T (1980) Dynamic recrystallization of olivine single crystals during high-temperature creep. Geophys Res Lett 7(9):649–652 Karato S-I, Paterson MS, FitzGerald JD (1986) Rheology of synthetic olivine
aggregates: influence of grain size and water. J Geophys Res 91(B8):8151–8176
Kaula WM (1999) Constraints on Venus evolution from radiogenic argon. Icarus 139(1):32–39
Kohlstedt DL, Evans B, Mackwell SJ (1995) Strength of the lithosphere: constraints imposed by laboratory experiments. J Geophys Res 100(B9):17587–17602 Kovesi PD (2000) Matlab and octave functions for computer vision and image processing. Online: http://www.peterkovesi.com/matlabfns/, Accessed 25 Aug 2016
Labrosse S (2002) Hotspots, mantle plumes and core heat loss. Earth Planet Sci Lett 199(12):147–156
Landuyt W, Bercovici D (2009) Variations in planetary convection via the effect of climate on damage. Earth Planet Sci Lett 277(1–2):29–37
Lu G, Kaus BJP, Zhao L, Zheng T (2015) Self-consistent subduction initiation induced by mantle flow. Terra Nova 27:130–138. ISSN:1365-3121, http://dx. doi.org/10.1111/ter.12140
Matsumoto T, Tomoda Y (1983) Numerical simulation of the initiation of subduction at the fracture zone. J Phys Earth 31(3):183–194
Mckenzie DP (1977) The Initiation of Trenches: A finite amplitude instability. In: Island Arcs, Deep Sea Trenches and Back-Arc Basins. American Geophysical Union, Washington, DC. pp 57–61. ISSN:9781118665756, http://dx.doi.org/ 10.1029/ME001p0057
McKinnon WB, Zahnle KJ, Ivanov BA, Melosh HJ (1997) Cratering on Venus: Models and observations. In: Bougher SW, Hunten DM, Philips RJ (eds). Venus II: Geology, geophysics, atmosphere, and solar wind environment. University of Arizona Press, Tucson Vol. 1. p 969
Moresi L, Solomatov VS (1995) Numerical investigation of 2D convection with extremely large viscosity variations. Phys Fluids 7(9):2154–2162 Moresi, L, Solomatov VS (1998) Mantle convection with a brittle lithosphere:
thoughts on the global tectonic styles of the Earth and Venus. Geophys J Int 133(3):669–682
Morgan WJ (1972) Deep mantle convection plumes and plate motions. AAPG Bull 56(2):203–217
Nair R, Chacko T (2008) Role of oceanic plateaus in the initiation of subduction and origin of continental crust. Geology 36(7):583–586
Nakagawa T, Tackley PJ, Deschamps F, Connolly JAD (2010) The influence of MORB and harzburgite composition on thermo-chemical mantle convection in a 3-D spherical shell with self-consistently calculated mineral physics. Earth Planet Sci Lett 296(3–4):403–412
Nataf HC, Richter FM (1982) Convection experiments in fluids with highly temperature-dependent viscosity and the thermal evolution of the planets. Phys Earth Planet Inter 29(3–4):320–329
Nikolaeva K, Gerya TV, Marques FO (2010) Subduction initiation at passive margins: numerical modeling. J Geophys Res 115(B3):03406 Niu Y, O’Hara MJ, Pearce JA (2003) Initiation of subduction zones as a
consequence of lateral compositional buoyancy contrast within the lithosphere: a petrological perspective. J Petrol 44(5):851–866 Ratcliff JT, Tackley PJ, Schubert G, Zebib A (1997) Transitions in thermal
convection with strongly variable viscosity. Phys Earth Planet Inter 102(3–4):201–212
Reese CC, Solomatov VS, Moresi L-N (1999) Non-Newtonian stagnant lid convection and magmatic resurfacing on Venus. Icarus 139(1):67–80 Regenauer-Lieb K (1998) Dilatant plasticity applied to Alpine collision: ductile
void growth in the intraplate area beneath the Eifel volcanic field. J Geodyn 27(1):1–21
Regenauer-Lieb K, Yuen DA, Branlund J (2001) The initiation of subduction: criticality by addition of water? Science 294(5542):578–580
Rolf T, Tackley PJ (2011) Focussing of stress by continents in 3D spherical mantle convection with self-consistent plate tectonics. Geophys Res Lett 38(18):18301
Rozel A, Ricard Y, Bercovici D (2011) A thermodynamically self-consistent damage equation for grain size evolution during dynamic recrystallization. Geophys J Int 184(2):719–728
Schaber GG, Strom RG, Moore HJ, Soderblom LA, Kirk RL, Chadwick DJ, Dawson DD, Gaddis LR, Boyce JM, Russell J (1992) Geology and distribution of impact craters on Venus: what are they telling us? J Geophys Res 97(E8):13257–13301
Schmeling H, Babeyko AY, Enns A, Faccenna C, Funiciello F, Gerya T, Golabek GJ, Grigull S, Kaus BJP, Morra G, Schmalholz SM, van Hunen J (2008) A benchmark comparison of spontaneous subduction
models—towards a free surface. Phys Earth Planet Inter 171(1–4):198–223 Sleep NH (2000) Evolution of the mode of convection within terrestrial planets.
J Geophys Res 105(E7):17563–17578
Solomatov VS (1995) Scaling of temperature- and stress-dependent viscosity convection. Phys Fluids 7:266
Solomatov VS (2004) Initiation of subduction by small-scale convection. J Geophys Res 109(B1):01412
Stengel KC, Oliver DS, Booker JR (1982) Onset of convection in a variable-viscosity fluid. J Fluid Mech 120:411–431
Stern RJ (2007) When and how did plate tectonics begin? Theoretical and empirical considerations. Chinese Sci Bull 52 52(5):578–591 Tackley PJ (2000a) Self-consistent generation of tectonic plates in
time-dependent, three-dimensional mantle convection simulations—Part 1: pseudo-plastic yielding. Geochem Geophys Geosyst 1(8):1–45 Tackley PJ (2000b) Self-consistent generation of tectonic plates in
time-dependent, three-dimensional mantle convection simulations—Part 2: strain weakening and asthenosphere. Geochem Geophys Geosyst 1:1–45 Tackley PJ (2008) Modelling compressible mantle convection with large
viscosity contrasts in a three-dimensional spherical shell using the yin-yang grid. Phys Earth Planet Inter 171(1–4):7–18
Thielmann M, Kaus BJP (2012) Shear heating induced lithospheric-scale localization: does it result in subduction? Earth Planet Sci Lett 359/360(0):1–13
Thielmann M, Kaus BJP, Popov AA (2015) Lithospheric stresses in Rayleigh–Bénard convection: effects of a free surface and a viscoelastic Maxwell rheology. Geophys J Int 203(3):2200–2219
Toth J, Gurnis M (1998) Dynamics of subduction initiation at preexisting fault zones. J Geophys Res 103(B8):18053–18067
Ueda K, Gerya T, Sobolev SV (2008) Subduction initiation by thermal-chemical plumes: numerical studies. Phys Earth Planet Inter 171(1–4):296–312 van Heck HJ, Tackley PJ (2008) Planforms of self-consistently generated plates
in 3D spherical geometry. Geophys Res Lett 35(19):19312
van Hunen J, Moyen J-F (2012) Archean subduction: fact or fiction? Annu Rev Earth Planet Sci 40(1):195–219
Vlaar NJ, Wortel MJR (1976) Lithospheric aging, instability and subduction. Tectonophysics 32(3–4):331–351
Yuen DA, Fleitout L, Schubert G, Froidevaux C (1978) Shear deformation zones along major transform faults and subducting slabs. Geophys J R Astron Soc 54(1):93–119
Wong T, Solomatov V (2015) Towards scaling laws for subduction initiation on terrestrial planets: constraints from two-dimensional steady-state convection simulations. Progress Earth Planetary Sci 2(1):18 Zhong S (2002) Effects of lithosphere on the long-wavelength gravity
anomalies and their implications for the formation of the Tharsis rise on Mars. J Geophys Res 107(E7):8-1–8-13