R E S E A R C H
Open Access
A correction model for differences in the sample
compositions: the degree of comparability as a
function of age and schooling
Rolf Strietholt
1*, Monica Rosén
2and Wilfried Bos
1* Correspondence: [email protected]
1TU Dortmund - Institute for School Development Research (IFS), Dortmund, Germany Full list of author information is available at the end of the article
Abstract
Background:Since the early days of international large-scale assessments, an overarching aim has been to use the world as an educational laboratory so countries can learn from one another and develop educational systems further. Cross-sectional comparisons across countries as well as trend studies derive from the assumption that there are comparable groups of students in the respective samples. But neither age-based nor grade-based sampling strategies can achieve balanced samples in terms of both age and schooling. How should such differences in the sample compositions be dealt with?
Methods:We discuss the comparability of the samples as a function of differences in terms of age and schooling. To improve the comparability of such samples, we developed a correction model that adjusts country scores, which we evaluate here with data from different IEA (International Association for the Evaluation of Educational Achievement) studies on reading at the end of primary school. Results:Our study demonstrates that ignoring differences in age and schooling confounds league tables and hides actual trends. In other words, cross-sectional comparisons across countries as well as trends within countries are affected by differences in the sample composition. The correction model adjusts for such differences and increases the comparability across countries and studies.
Conclusions:Researchers who use the data from international comparative studies for secondary analyses should be aware of the limited comparability of the samples. The proposed correction model provides a simple approach to improve comparability and makes the complex information from international comparisons more accessible.
Keywords:Sampling; Large-scale assessments
Background
International comparative studies on student achievement have been conducted for about half a century. Since the early days of such studies, an overarching aim has been to use the world as an educational laboratory so that countries can learn from one an-other and develop their educational systems further. The rich body of data that has been collected over the last decades has primarily been used for cross-sectional com-parisons. In spite of this, longitudinal comparisons of different trends, which could provide a broad basis to study the effects of certain reforms, have not yet been used. In this context, the current study is part of a large project that aims to link older and
more recent studies in order to investigate trends in student achievement over time and across studies. Such data open up the possibility to study the effects of educational reforms and changes in education policies from a long-term perspective. From a tech-nical point of view, two major concerns are the comparability of the tests and the com-positions of the samples over time; the present paper elaborates on the latter. Comparable tests mean that we have to use a common metric when we compare the results from different studies, and comparable samples mean that the samples should not differ if we compare them over time or across countries.
Meaningful comparisons of study results among countries derive from the assumption that similar groups of students are being compared. Thus, defining the target population is an important step in the design of a study. However, due to different school entry ages across countries, the samples typically cover students that differ either in terms of age, grade, or both. Similar problems stem from changes in the target population definitions over time. If the definitions change, observed differences in student achievement may not reflect actual development but changes in the sample composition.
Against this background, the present paper has two aims. First, we discuss the degree of comparability of samples as a function of differences in age and schooling. This is best done with concrete examples from recent and older IEA (International Association for the Evaluation of Educational Achievement) studies that illustrate different sampling strategies. We review research on the effects of age and schooling on student achieve-ment to evaluate the significance of such differences for valid comparisons. We then propose a correction model to adjust for observed differences in terms of age and schooling. This model will be applied to the IEA data in order to discuss practical im-plications and limitations.
Target population definitions and compositions
An essential part in the design of a study is to define the target population. In the con-text of international comparative studies, Rust (1994) identifies three educational com-ponents that study designers have to balance: age, grade, and curriculum. It is, of course, desirable to balance all three components, but in reality they often conflict. In Progress in International Reading Literacy Study (PIRLS) 2006, for instance, the target population was defined as follows:
“…all students enrolled in the grade that represents four years of schooling, counting from the first year of ISCED Level 1, providing the mean age at the time of testing is at least 9.5 years. For most countries, the target grade should be the fourth grade, or its national equivalent”. (Joncas, 2007).
Despite the complex definition of the target population in PIRLS 2006, the countries’ samples differ dramatically in terms of age. The average age of the fourth graders in Italy, for instance, was 9.7 years, but in Sweden it was 10.9 years (Mullis et al. 2007). This shows that despite complex sample definitions, the sample compositions naturally differ across countries and point out that age and grade differences address diverse concepts.
Furthermore, other studies that also addressed student achievement at the end of pri-mary school used different sampling strategies. An early study in this field was the Reading Comprehension Study in 1970, which was part of the very ambitious multicohort Six Subject Survey carried out in 21 countries (Thorndike, 1973; Walker, 1976). The study designers specified the target population at the end of primary school in the following way: “All students aged 10:0–10:11 years at the time of testing” (Postlethwaite, 1974, p. 164). They explain that it was“defined by age rather than grade because age is a uniform attribute from country to country, whereas the meaning of grade varies”. (Peaker, 1975, p. 31).
Consequently, as each country’s sample covered students at the same age but from two or more adjacent grades, in international comparisons the countries sampled dif-ferent grades as well. In Sweden, for example, most students at this age were in grade 3 or 4. In Italy, only a few students were in grade 4, the majority being in grade 5. It is crucial to note that with the country’s sample split between two—or even more— grades, in the lower grade the students are rather old, and in the higher grade they are rather young. That implies that we cannot compare such a sample with one that targets a complete grade (regardless of students’ age). Therefore, Italian and Swedish fourth graders should only be compared with great caution. It should also be mentioned that even if data from multiple grades are available, the respective sample size in the differ-ent grades can be very small.
The target population was redefined in the Reading Literacy Study from 1991: “All students attending mainstream schools on a full-time basis at the grade level in which most students were ages 9:00–9:11 years” (Elley, 1994, p. 239). The redraft was (partly) a consequence of the experience gained though the previous IEA study because coun-tries expressed concerns that sampling students from multiple grades was a trouble-some enterprise (Peaker, 1975). Grade-based sampling makes the data collection easier because entire classrooms can be tested. In most countries, either grade 3 or 4 was tested. From an international perspective, the comparability in terms of age was some-what reduced because after the grade selection, age was not a relevant criterion any-more. Nevertheless, due to the fact that age was still part of the target population definition, age differences were limited to some extent.
Test month differences and sample differences
So far we have only elaborated on age and grade differences, but the point of time within a school year when the tests are administered also affects the comparability of the study results. This is problematic if testing takes place early in the school year be-cause the students are younger and have had less learning opportunities in school.
In the early Reading Comprehension Study (1970), for instance, the data collection was carried out at the end of the spring term (Hansson, 1975). This is a rather vague description because the end of a school term does not refer to a particular month. In comparison, in the Reading Literacy Study, the tests were administered in the eighth month of the school year (Elley, 1992), which is also vague as schools may not all start at the same time in large countries. Both specifications leave room for interpretation and proved difficult to implement (Rust, 1994). In PIRLS, the test administration was scheduled within a testing period, which was April-June 2001 (Martin et al. 2003) and March-June 2006 (Martin et al. 2007).
As the test months of the individual students have been recorded in the IEA data sets since 2001, we have the possibility to evaluate when the tests were actually adminis-tered. These records reveal certain differences. Italian students, for example, were tested in May 2001, but Swedish students in March 2001. In Sweden, the 2006 tests were administered in April and May, which is approximately 1½ months later than in 2001. Unfortunately, no records of the test months are available before 2001.
The significance of age and schooling for comparisons
A preliminary result of the overview of target population definitions and test months is that the respective samples in large-scale assessment studies differ in terms of age and schooling. In order to answer the question to what degree such differences affect the comparability of the samples, we need information regarding how much age and schooling account for individual differences in student achievement. Such information also helps to evaluate the restrictions that correspond to different sampling approaches and sample compositions.
Literature review of methodological approaches to decompose the effects of age and
schooling
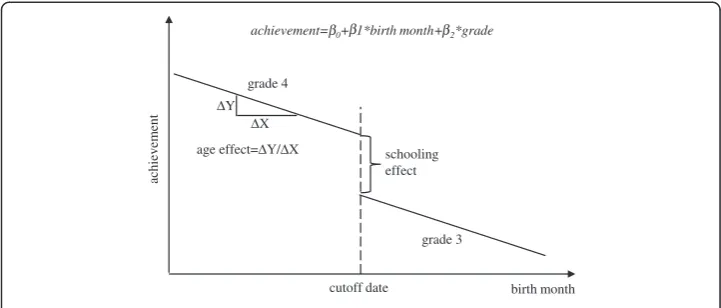
The difference in achievement between two adjacent grades is a measure of what stu-dents learn in one year if no special cohort effects occur. The regression discontinuity (RD) approach provides an analytic framework to decompose this difference into the relative effects of age and schooling. In RD analyses, student achievement is regressed on students’age and grade. In graphical terms, this approach results in a regression line for achievement on age, which is broken at the cutoff date (see Figure 1). The slope represents the relative effect of age and the jump the schooling effect.
grade repetition. In most countries, students’school entry depends on whether they are born before or after a certain cutoff date.
However, this cutoff point can be “fuzzy” so that the age range exceeds 12 months. Fuzzy in this context means that the cutoff point is not sharply delineated and children can deviate from the common cutoff date rule. Such students most likely differ from other children in their age in qualitative criteria such as abilities or school readiness. This causes some children to enter school early or late, thus accelerating or delaying their school careers. However, if such a fuzzy cutoff point applies, we cannot infer the true relation between age and achievement from the observed relation because the youngest students within a grade may have started school earlier or skipped a grade due to their particularly high abilities. On the other hand, the oldest students may have started school late or repeated a grade because of particularly low abilities. This causes the estimates from ordinary least square (OLS) regression to be biased. In methodo-logical terms, the endogeneity problem applies, that is, the dependent variable is corre-lated with the error term because age is correcorre-lated with other predictors of student achievement.
Different approaches have been used to overcome bias from such selective age sam-ples. One approach is that researchers try to avoid the endogeneity problem by narrowing the age range. In a series of papers, Cahan and colleagues (Bentin et al. 1991; Cahan & Cohen, 1989; Cahan & Davis, 1987) analyzed the development of basic skills during kindergarten and the first two school grades in Israel. They estimate RD models with OLS regression. In order to overcome the endogeneity problem, students born close to the cutoff date were excluded from the analyses. In fact, the resulting samples only covered students born between February and November. This strategy also eliminates bias from students who repeated (or skipped) a year, though we estimate that the proportion is small in the early grades. According to their age, these students were not supposed to be in the sampled grade. Some bias remains, however, as some students who were born between the cutoff days repeated (or skipped) a year.
The analyses reveal a substantial effect of formal learning in school over and above the effect of aging. Obviously enough, the key assumption when identifying unbiased effects of age and grade is that only students born in certain months are affected by the
grade 4
grade 3
birth month
achiev
em
ent
cutoff date schooling effect age effect=ΔY/ΔX
ΔY
ΔX
achievement=β0+β 1*birth month+β2*grade
endogeneity problem. In countries where children cannot depart from the common cutoff date, no child has to be excluded. Unfortunately, most countries do not apply strict age-based school enrollment rules rendering this approach ineffective in these countries (Martin et al. 2011).
A second strand of research uses knowledge about the selection process that influ-ences the school entry in statistical models. This is typically done within the instrumen-tal variable (IV) regression framework (c.f. Angrist & Krueger, 1991, 2001). The idea is to find a variable (an “instrument”) that is related to an independent, endogenous vari-able X, but not to the dependent varivari-able Y, apart from by the indirect effect via X. The treatment effect is identified through the part of the variation in X that is triggered by the instrument.
With respect to the effect of age on student achievement, this strategy was first pro-posed by Bedard and Dhuey (2006). Even though this study did not aim to separate the effects of age and grade but only to estimate the effect of school entry age, it is interest-ing from a methodological standpoint. The basic idea is to distinterest-inguish between when a child starts school according to the cutoff date rule (the instrument) and when he or she actually enters school.
A two-stage least squares (2SLS) estimator can be used to estimate the effect of age on educational achievement within the IV framework. In the first stage, the selection process is modeled by regressing the actual school entry age on a so-called instrument, which in this case is when the child starts school according to the cutoff date. In the second stage, student achievement is regressed on the fitted (predicted) values from the first stage.
Bedard and Dhuey provide estimates from OLS and IV. The observed relation (OLS regression) between age and achievement is positive in some countries and zero or even negative in others. The IV estimates, however, are positive in all countries and, interestingly enough, the corresponding effect sizes are rather similar across countries. What does it mean, then, when OLS estimates are negative but IV estimates positive? We checked the age ranges reported by Martin et al. (2011) for countries where OLS and IV estimates differ. This comparison revealed that large differences correspond with a large age range, which in turn indicates fuzzy cutoff dates. We think that negative OLS estimates of the effect of age on achievement are spurious, that is, they are caused by the fact that in some countries bright children tend to start earlier and poor children later.
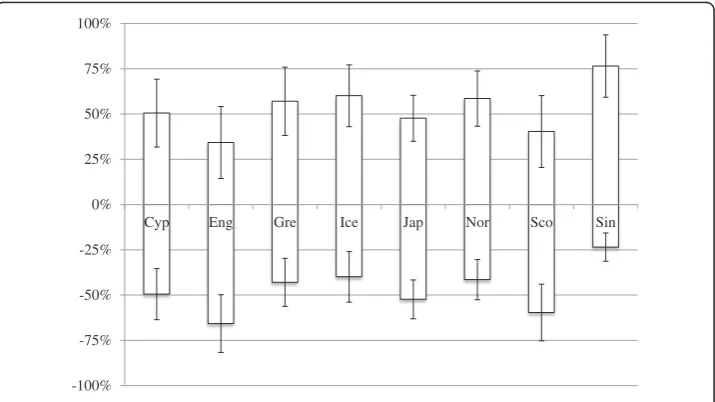
Note (underneath the figure). Results from mathematics in 8 countries. The upper parts of the bars represent the relative grade effect and the lower parts the age effect. The figure includes the 95% confidence intervals for both effects (source: Luyten (2006) and own calculations).
Research on mathematics and science
Recently, both OLS and IV estimations have been used to decompose what students learn in one year into the effects of age and grade. Luyten (2006) estimated RD models with OLS regression on TIMSS 1995 data in mathematics and science at the end of pri-mary school.
Luyten used data from grades 3 and 4, and suggests removing misplaced students from analyses if the students were not born within the official cutoff dates. Excluding misplaced students, however, does not account for the problem that some students were born within the official cutoff dates but started school one year earlier or later. Luyten argues that this selection bias will not affect the analyses to a large extent if the rate of misclassified students is very small; he suggests accepting up to 5% misclassified students. This criterion applies to only eight out of 26 TIMSS countries.
The result from a series of RD models is that schooling accounts on average for 60.3% of the differences in student achievement between two adjacent grades in math-ematics and 53.1% in science; this corresponds to age effects of 39.7% and 46.9%, re-spectively. The schooling effect represents the effects of a variety of learning opportunities in a school context. The age effect stands for the relative advantages of the elder over their younger fellows because they had more learning opportunities before school starts, a higher mental and physical development during school, or how teachers perceive and treat children at a different age.
In Figure 2, the bars represent the relative effect of schooling and age in the eight countries (both sum up to 100%). The length of the bar above the x-axis shows the relative effect of grade and the length below the x-axis shows the effect of age. Even though the relative effects of age and schooling differ, the standard errors in Figure 2 are far too large to derive the conclusion that age and schooling have differential effects in the respective countries.
In an extension of the OLS analyses, Luyten and Veldkamp (2011) used a two-stage estimation technique in the IV framework to consider the endogeneity problem for countries with less strict cutoff school entry policies and higher rates of misclassified students. Some countries do not apply a cutoff date, or the date varies within the coun-try so that no instrument is available to which to apply IV estimation. However, in the 15 countries where IV estimation was applicable, the analyses reveal that grade
-100% -75% -50% -25% 0% 25% 50% 75% 100%
Cyp Eng Gre Ice Jap Nor Sco Sin
(mathematics = 53.5%; science = 47.3%) and age (mathematics = 46.5%; science = 52.7%) account for about the same amount of students’learning progress in one year.
The two studies are also interesting from a methodological standpoint because the results from IV and OLS estimations can be compared. As mentioned before, Luyten (2006) suggests accepting up to 5% misclassified students when applying OLS estimation. A comparison of the results from OLS and IV estimates reveals that they are quite similar, but OLS estimates for the relative effect of age tend to be somewhat smaller and the rela-tive effect of schooling somewhat larger than IV estimates. For the eight countries consid-ered in both studies, the difference was about 10 percent in both domains.
There are two possible explanations for the differences: OLS estimates are biased if we ignore the fact that up to 5% of the students are misclassified. On the other hand, students who repeated or skipped a grade may not bias OLS estimates as they are re-moved, but they can bias IV estimates. Due to the large standard errors and the rela-tively small number of countries. we should not overinterpret these differences, though. Cliffordson (2010) reports that schooling accounts for roughly twice as much as age in regard to what students learn in one year in mathematics and science in secondary schools in Sweden. She uses Swedish TIMSS 1995 data. Contrary to most participating countries, Sweden sampled not two but three adjacent grades in secondary school. Such data allow the analysis of normal-aged students in grade 7 together with delayed students (at the same age in grade 6) or accelerated school careers (at the same age in grade 8). The findings from a series of RD models with OLS estimation reveal that ex-cluding nonnormal-aged students provides a quite good approximation for the effect of student age. Cliffordson argues that excluding students is reasonable if the proportion of misclassified students is small.
Research on reading
With respect to reading, no such extensive databases are available. Sweden, however, extended the international PIRLS sample (grade 4) with an additional grade 3 sample in 2001, while Iceland and Norway added grade 5 samples in 2006. Van Damme et al. (2010) estimated RD models with OLS estimation on the data from the three countries. The proportion of misclassified and excluded students was only about 1 percent in Iceland and Norway and just under 5 percent in Sweden. On average, schooling ac-counts for about 60% and age differences 40% of what students learn in one year. In comparison to the findings in mathematics and science, this is a somewhat larger effect of age and a smaller effect of schooling.
Luyten et al. (2008) used PISA 2000 data from England to estimate the effects of age and schooling on reading achievement in grades 10 and 11. About 2.5% of the students were born out of the official age range and removed from the analyses. They found a relatively small absolute effect of grade, and the effect of age was not even significant. A possible explanation for this finding is that the development of basic reading literacy skills takes place in earlier grades.
effect of schooling can be observed in mathematics and the largest effect of age in read-ing. One explanation for this pattern could be that students mainly develop math skills in a formal school context, but children have multiple reading-related learning oppor-tunities out of school. Therefore, the effect of schooling might be smaller in reading than in mathematics or science. In summary, however, both age and schooling have substantial effects on what students learn in one year.
Research problems and the current study
The overall finding of the research review is that any sampling strategy causes differ-ences in the sample composition in terms of age and grade. Additionally, the test month is another source of differences in age and schooling. As both account for a sub-stantial amount of what children learn, differences in age and schooling should not be neglected when making valid comparisons.
Classic approaches to avoid such differences are stratification and conditioning. The basic idea of stratification is to compare subsamples within the complete samples. This approach, however, requires substantial overlaps between the countries’ samples in terms of age, grade, and the test month. If countries change the target grade from one study to another, no such overlaps exist. A possible consequence of large differences in the school entry age is that countries cannot be compared, as no overlaps in age are available across countries.
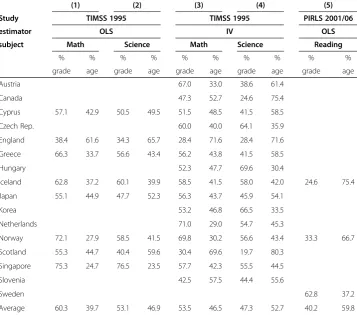
Table 1 The relative effects of age and grade on student achievement at the end of primary school
(1) (2) (3) (4) (5)
Study TIMSS 1995 TIMSS 1995 PIRLS 2001/06
estimator OLS IV OLS
subject Math Science Math Science Reading
% % % % % % % % % %
grade age grade age grade age grade age grade age
Austria 67.0 33.0 38.6 61.4
Canada 47.3 52.7 24.6 75.4
Cyprus 57.1 42.9 50.5 49.5 51.5 48.5 41.5 58.5
Czech Rep. 60.0 40.0 64.1 35.9
England 38.4 61.6 34.3 65.7 28.4 71.6 28.4 71.6
Greece 66.3 33.7 56.6 43.4 56.2 43.8 41.5 58.5
Hungary 52.3 47.7 69.6 30.4
Iceland 62.8 37.2 60.1 39.9 58.5 41.5 58.0 42.0 24.6 75.4
Japan 55.1 44.9 47.7 52.3 56.3 43.7 45.9 54.1
Korea 53.2 46.8 66.5 33.5
Netherlands 71.0 29.0 54.7 45.3
Norway 72.1 27.9 58.5 41.5 69.8 30.2 56.6 43.4 33.3 66.7
Scotland 55.3 44.7 40.4 59.6 30.4 69.6 19.7 80.3
Singapore 75.3 24.7 76.5 23.5 57.7 42.3 55.5 44.5
Slovenia 42.5 57.5 44.4 55.6
Sweden 62.8 37.2
Average 60.3 39.7 53.1 46.9 53.5 46.5 47.3 52.7 40.2 59.8
Conditioning can be considered as a parametric version of stratification and is a powerful tool because the different samples do not necessarily have to overlap. Conditioning is usually realized by introducing controls into a regression model. But including control variables into a model will only improve the comparability if the functional relation between control and dependent variable is modeled correctly. We already established that the observed relationship between age and achievement can be negative within grades. Observing a negative relationship, however, does not imply that it is actually negative but rather indicates endogeneity. In such a situation, including age may not only fail to improve, but even worsen the comparability.
Thus, we suggest dealing with differences in the sample composition by correcting country scores for differences in terms of age and schooling with a mathematical model. In an initial step, we adjust the country scores for differences in terms of age and schooling. Substantial questions can be addressed in another step. We use data from IEA studies to illustrate how to adjust samples for age, grade, and test month dif-ferences. This data is particularly suited to illustrate corrections because the different studies employed various target population definitions. Thereby we can demonstrate how to correct for schooling and age differences and show to what extent such correc-tions affect comparisons.
Even though we suggest a rather simple approach, we are only aware of a few similar applications. Rindermann (2007) conducted a secondary analysis of data from different IEA and OECD studies, but he did not distinguish between age, grade, and test months but summarized all differences under the termage. To make the countries’scores from various studies comparable, he corrected the individual scores by a global factor for age differences. Van Damme et al. (2010) present a model similar to the one we suggest and applied the model to PIRLS 2006 data. The study, however, does not take differ-ences in the test month into account.
Methods Data
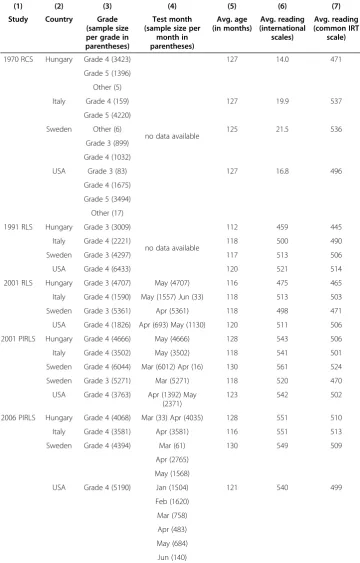
Table 2 Overview of the composition of the samples in terms along with student achievement
(1) (2) (3) (4) (5) (6) (7)
Study Country Grade (sample size per grade in parentheses)
Test month (sample size per
month in parentheses)
Avg. age (in months)
Avg. reading (international
scales)
Avg. reading (common IRT
scale)
1970 RCS Hungary Grade 4 (3423)
no data available
127 14.0 471
Grade 5 (1396)
Other (5)
Italy Grade 4 (159) 127 19.9 537
Grade 5 (4220)
Sweden Other (6) 125 21.5 536
Grade 3 (899)
Grade 4 (1032)
USA Grade 3 (83) 127 16.8 496
Grade 4 (1675)
Grade 5 (3494)
Other (17)
1991 RLS Hungary Grade 3 (3009)
no data available
112 459 445
Italy Grade 4 (2221) 118 500 490
Sweden Grade 3 (4297) 117 513 506
USA Grade 4 (6433) 120 521 514
2001 RLS Hungary Grade 3 (4707) May (4707) 116 475 465
Italy Grade 4 (1590) May (1557) Jun (33) 118 513 503
Sweden Grade 3 (5361) Apr (5361) 118 498 471
USA Grade 4 (1826) Apr (693) May (1130) 120 511 506
2001 PIRLS Hungary Grade 4 (4666) May (4666) 128 543 506
Italy Grade 4 (3502) May (3502) 118 541 501
Sweden Grade 4 (6044) Mar (6012) Apr (16) 130 561 524
Sweden Grade 3 (5271) Mar (5271) 118 520 470
USA Grade 4 (3763) Apr (1392) May (2371)
123 542 502
2006 PIRLS Hungary Grade 4 (4068) Mar (33) Apr (4035) 128 551 510
Italy Grade 4 (3581) Apr (3581) 116 551 513
Sweden Grade 4 (4394) Mar (61) 130 549 509
Apr (2765)
May (1568)
USA Grade 4 (5190) Jan (1504) 121 540 499
Feb (1620)
Mar (758)
Apr (483)
May (684)
Jun (140)
Variables
Age, grade, and test month
In the previous sections, we elaborated on the target population definitions and the composition of the respective samples. All datasets cover information on students’age in months and grade, but information on the test month is not available before 2001.
Reading achievement
The reading tests in all studies are text passages and corresponding items which the stu-dents respond to after reading. The data from the RCS cover a sum score, which is the number of correct responses on the test items (Thorndike, 1973). The data from RLS and PIRLS cover item response theory scores (Martin, Mullis, Gonzalez, et al., 2003; Mullis et al., 2007). Correspondingly, the scores of the respective studies have different metrics. In order to establish a common metric, we equated the respective tests and transformed the scores on a common metric with a mean of 500 and a standard deviation of 100.
Basically, we used the individual raw data on the item level from all five studies and then employed a one-parameter logistic IRT model with an extension for partial credit items to estimate all item parameters in a concurrent calibration (see Kim & Cohen, 2002). It was possible to link all tests due to two Swedish extensions from the international study design. The students from the Swedish RLS 1991 sample took additional test items from the RCS test. A similar extension was made in 2001 to link the tests from the RLS and PIRLS 2001. The linking process is complex and described in detail elsewhere.
Development of a correction model
Consider a simple linear model where the achievement of a student i in a country c and study sis denoted asY. In model (1), student achievement is a function of differ-ences in terms ofAge,Grade,and theTestMonth,while the corresponding country and study specific regression weights areβ,γ,andδ. The parameterαis the intercept andε a random residual which covers other sources of variance inY.
Yics¼αcsþβcsAgeicsþγcsGradeicsþδcsTestMonthicsþics ð1Þ
Estimates forβ,γand δcan be used to adjust the average reading score in countryc and study sfor any discrepancies in terms of age and schooling. Therefore, we first ag-gregate all variables on the country level and set up model (2). The bars indicate aggre-gated variables and the adjusted average achievement score is denoted as AdjScr. This score is equal to the observed “raw” reading score (RawScr) plus the weighted sum of differences in terms of age and schooling. The Greek letter delta (Δ) indicates differ-ences between a sample and a reference target population. The reference sample can be any target population which is defined in terms of age, grade, and test month.
―
AdjScrcs¼RawScr―csþβ^csΔ―Agecsþ^γcsΔGrade―csþ^δcsΔ―TestMonthcs ð2Þ
specific estimates ofβ, γand δmay not be available, we suggest that countries should benefit from the information available from other countries.
Another challenge concerns the estimation of the effect of test month on achievement, because typically we do not observe much variation in the test month. Consequently, with-out variance we cannot estimate any effect. Instead of estimatingδin a regression model, we propose dividingγby 10 to obtain an estimate for what students learn in one month in-stead. We divide by 10 and not 12 because students do not attend school during the sum-mer vacation. Using common parameters ofβandγ, instead of country- and study-specific parameters, and replacingδbyγ/10, gives:
―
AdjScrcs¼RawScr―csþβ^Δ―Agecsþ^γΔ―Gradecsþ ^γ 10Δ
―
TestMonthcs ð3Þ
The choosing of appropriate parameters for the correction model and adjusting for age and schooling differences are best described with concrete examples. First, we have to define a reference group which is an ideal fictive target population at a certain age, grade, and test month; for example 120 months (= 10 years) old students in grade 4 tested in Mayc. Policymakers from a certain country may prefer another reference group, which is more similar to their own country. However, the choice of the parame-ters is of subordinate importance for comparative purposes because defining the refer-ence group affects the level of the adjusted scores but not the adjusted differrefer-ences across countries.
To correct the actual samples for any discrepancies from this reference group, we suggest the correction factors β= 30 and γ= 20. This choice is based on the following considerations:
With the new IRT scale (see Table2, column 7) we can compare the third graders’ results with the fourth graders’in Hungary and in Sweden in 2001. The differences are 41 and 54 points, respectively. Additionally, Mullis et al. (2003,2007) report that the fifth graders outperform the fourth graders in Iceland by 39 points and in Norway by 42 points; These differences, however, use another metric, which is the PIRLS scale. We know that the difference between Swedish third and fourth graders is 41 points
(see Table2, column 6) on the PIRLS scale but 54 points on the new IRT scale (see Table2, column 7). Thus, the variance of the new IRT scale is 54/41 times larger than the variance of the PIRLS scale. We use this ratio to transform the differences between Icelandic and Norwegian grade 4 and 5 students onto the new IRT scale, which gives values of 51 and 55. On the new IRT scale, the average difference between two adjacent grades in Hungary, Iceland, Norway, and Sweden is 41, 51, 55, and 54, respectively, which is on average 50 points.
At the end of primary school, age accounts for 60 percent of what students learn in one year and schooling for 40 percent (see the research review above and Table1), which corresponds to annual age and schooling effects ofβ= 30 andγ= 20 on the new IRT scale.
the proportion of misplaced students is small, OLS regression is applicable. The func-tional relation between age and achievement has to be specified; several researchers found empirical support that linearity is an adequate description (Cliffordson, 2010; Luyten, 2006; Luyten & Veldkamp, 2011).
Second, the relation of schooling to achievement might differ during the school year because of the summer vacation (e.g., Alexander et al. 2001; Verachtert et al. 2009). To estimate what students learn in one month, we can divide what student learn in one year in school by 12 months. As noted above, a better alternative is to divide by 10 be-cause students do not attend school for roughly two months during their summer vacations.
One is naturally concerned about the variance in what students learn in one year and the relative effects of age and schooling across countries. Thus, we will evaluate how robust or sensitive the correction model is against misspecifications. For this purpose, we employ different configurations of correction weights and compare the adjusted scores.
Results and discussion Applying the correction model
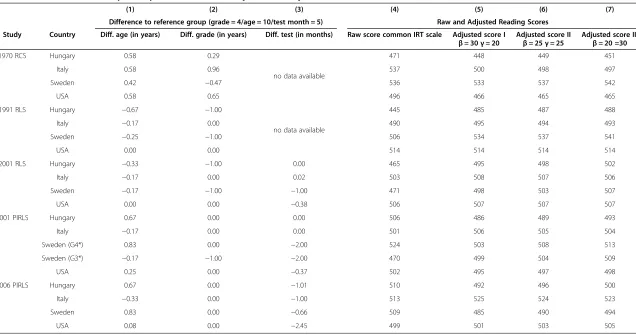
To apply the correction model, we use the average age, grade, and test month in the re-spective samples and calculate the deviation from the reference group, which we define as a sample with an average age of 10 years, in grade 4, and test administration in May (= month 5). Table 3 lists the deviations of the actual samples from the reference group in columns (1)–(3). We applied the correction model to adjust the raw scores in col-umn (4) with weights of β= 30 andγ= 20 and receive the adjusted values presented in column (5).
Even though the average student’s age is about 10 years across the samples and the dominant grade is fourth, the adjustment in the respective countries affect comparisons in a substantial way. The largest adjustment (+40 points), for instance, occurs for Hungary in RLS 1991 because the sample comprises grade 3 students who are clearly younger than 120 months. In the same study, the U.S. sample has not been adjusted at all because it covers fourth graders with an average age of 120 months. The largest negative adjustment can be seen in the case of Italy in 1970 (−37 points). Assuming that student literacy increases about 50 points on average in one year, the correction model illustrates that comparisons of raw scores would be misleading.
Table 3 Differences in the sample compositions and the unadjusted and adjusted scores
(1) (2) (3) (4) (5) (6) (7)
Difference to reference group (grade = 4/age = 10/test month = 5) Raw and Adjusted Reading Scores
Study Country Diff. age (in years) Diff. grade (in years) Diff. test (in months) Raw score common IRT scale Adjusted score I
β= 30γ= 20
Adjusted score II
β= 25γ= 25
Adjusted score III
β= 20 =30
1970 RCS Hungary 0.58 0.29
no data available
471 448 449 451
Italy 0.58 0.96 537 500 498 497
Sweden 0.42 −0.47 536 533 537 542
USA 0.58 0.65 496 466 465 465
1991 RLS Hungary −0.67 −1.00
no data available
445 485 487 488
Italy −0.17 0.00 490 495 494 493
Sweden −0.25 −1.00 506 534 537 541
USA 0.00 0.00 514 514 514 514
2001 RLS Hungary −0.33 −1.00 0.00 465 495 498 502
Italy −0.17 0.00 0.02 503 508 507 506
Sweden −0.17 −1.00 −1.00 471 498 503 507
USA 0.00 0.00 −0.38 506 507 507 507
2001 PIRLS Hungary 0.67 0.00 0.00 506 486 489 493
Italy −0.17 0.00 0.00 501 506 505 504
Sweden (G4*) 0.83 0.00 −2.00 524 503 508 513
Sweden (G3*) −0.17 −1.00 −2.00 470 499 504 509
USA 0.25 0.00 −0.37 502 495 497 498
2006 PIRLS Hungary 0.67 0.00 −1.01 510 492 496 500
Italy −0.33 0.00 −1.00 513 525 524 523
Sweden 0.83 0.00 −0.66 509 485 490 494
USA 0.08 0.00 −2.45 499 501 503 505
Note. Own calculation; *G4, Grade 4,G3, Grade 3.
al.
Large-s
cale
Assessments
in
Education
2013,
1
:1
Page
15
of
20
essmentsinedu
cation.com
/content/1
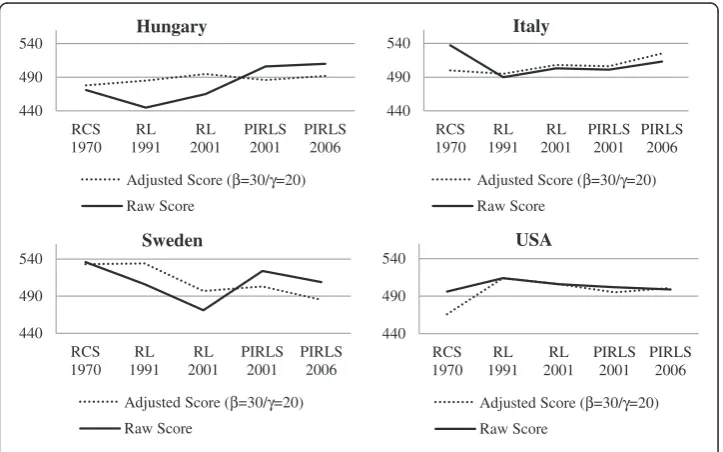
The corrections also concern trends within countries. The raw scores are hardly com-parable over time because the respective countries targeted students at different ages and grades. Through the application of the correction model and the associated adjust-ments, it is possible to study trends over time, even though the countries sampled dif-ferent target populations. The adjusted trend lines reveal interesting and diverse patterns (see Figure 3). In Sweden, for instance, the solid trend line for the observed raw scores fluctuates, indicating no clear trend. In comparison, the broken line for the adjusted scores reveals a remarkable decline in reading achievement after 1991. Differ-ent patterns can also be observed in the other countries, although the adjustmDiffer-ents are small in Italy and the USA after 1970.
The robustness of the correction model
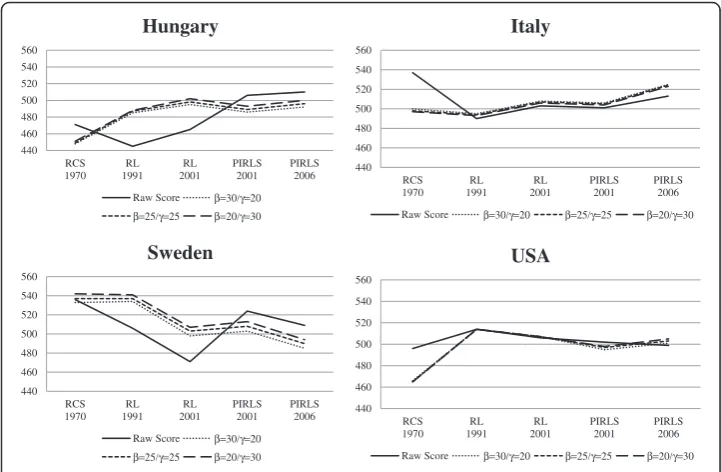
The results from the previous section suggest that comparing samples is misleading if we ignore differences in the sample compositions. This yields the question of how much the choice of the correction weights affects the adjustments. One might not accept global correction weights instead of country-specific ones, if different configura-tions of correction weights lead to large differences in the adjustments. Therefore, we conducted robustness checks that provide an empirical basis to evaluate whether global weights are an acceptable approximation for individual countries and samples. As un-realistic weights can lead to extreme adjustments, we suggest three un-realistic configurations.
Next to the adjustments described above (β= 30/γ= 20; adjusted score I), we weigh the impact of age and schooling equally (β= 25/γ= 25; adjusted score II) and the im-pact of schooling more strongly than the imim-pact of age (β= 20/γ= 30; adjusted score III). The three configurations represent the relative effects of age and schooling observed at the end of primary school in reading, mathematics, and science. In other words, age as
440 490 540 RCS 1970 RL 1991 RL 2001 PIRLS 2001 PIRLS 2006 Hungary
Adjusted Score (β=30/γ=20)
Raw Score 440 490 540 RCS 1970 RL 1991 RL 2001 PIRLS 2001 PIRLS 2006 Italy
Adjusted Score (β=30/γ=20)
Raw Score 440 490 540 RCS 1970 RL 1991 RL 2001 PIRLS 2001 PIRLS 2006 Sweden
Adjusted Score (β=30/γ=20)
Raw Score 440 490 540 RCS 1970 RL 1991 RL 2001 PIRLS 2001 PIRLS 2006 USA
Adjusted Score (β=30/γ=20)
Raw Score
well as schooling account for 40–60 percent of what students learn. This range is large enough to infer on the robustness of the model.
The adjusted values are listed in columns (5)-(7) in Table 3. To illustrate the differences, we present the trend lines for all three adjustments and the raw scores in Figure 4. In Italy and the USA the three configurations of the correction weights result in extremely similar adjusted scores. Some small differences can be observed in Hungary and Sweden, but the trend lines in the two countries parallel each other. This indicates that the observed trends within countries are hardly affected by the choice of the correction weights because such analyses do not focus on the level of achievement but on change.
We also compared how the adjustments change if we use different configurations of weights for different countries. Therefore, we compare the rank order of the four coun-tries in the five studies to evaluate how much the choice of the correction weights drives the adjusted scores. Our analyses support that the rank order is robust except for the Swedish adjusted scores in the RLS from 2001. Here, the adjusted scores I indicates that Sweden outperforms all other countries, whereas following the adjusted scores III would make Sweden a relatively poor-performing country. However, in the RLS 2001, all score indicate that the four countries perform on a quite similar level. Such small differences in the rank order should be interpreted with caution because we deal with estimates, and in terms of effect sizes, such differences are negligible.
It is important to note that both cross-sectional comparisons and trend studies are al-most always misleading when we consider the unadjusted scores. We think that, all in all, the robustness analyses support the robustness of our correction model against certain changes in the weights for age and schooling. Admittedly, adjustments change the rank order in comparison to the raw scores, but the three configurations of correction weights result in the same ranking (with only one exception).
440 460 480 500 520 540 560 RCS 1970 RL 1991 RL 2001 PIRLS 2001 PIRLS 2006 Hungary
Raw Score β=30/γ=20
β=25/γ=25 β=20/γ=30 440 460 480 500 520 540 560 RCS 1970 RL 1991 RL 2001 PIRLS 2001 PIRLS 2006 Italy
Raw Score β=30/γ=20 β=25/γ=25 β=20/γ=30
440 460 480 500 520 540 560 RCS 1970 RL 1991 RL 2001 PIRLS 2001 PIRLS 2006 Sweden
Raw Score β=30/γ=20
β=25/γ=25 β=20/γ=30 440 460 480 500 520 540 560 RCS 1970 RL 1991 RL 2001 PIRLS 2001 PIRLS 2006 USA
Raw Score β=30/γ=20 β=25/γ=25 β=20/γ=30
Conclusions
International large-scale studies are widely recognized not only among researchers but also attract the attention of policymakers. But how valid are comparisons? We demon-strated that the samples from different countries and studies cover students at various ages and encompass different amounts of schooling because school does not start at the same age, nor do countries target the same grades. Such differences restrict the comparability of the respective samples, while a number of studies emphasize that nei-ther age nor schooling can be neglected.
Against this background, the present paper introduces a simple mathematical correc-tion model where we consider the comparability of the samples as a funccorrec-tion of age and schooling. The correction model provides a simple approach to improving the comparability of study results over time and across countries and makes the complex information from international comparisons more accessible. We cannot force coun-tries to harmonize the school entry age, but we can make adjustment to correct for ob-served differences. The adjusted scores are estimates for the achievement of a comparable reference group at a certain age and with a certain amount of schooling in the respective countries.
Some researchers propose correcting for differences in the sample composition for more valid comparisons (Rindermann, 2007; Van Damme et al., 2010), but Martin, Mullis, and Foy (2011) express some concerns regarding adjustments with global cor-rection weights. They observe different patterns in the relation between age and achievement in the respective countries and infer that observing“no simple, consistent relationship (…) implies that any attempt to make a global statistical adjustment to countries’ average achievement in order to account for differences in average age is likely to be misleading”. (p. 25). We were also nervous about global weights but believe that observing no consistent relation between age and achievement simply indicates the endogeneity problem.
If studying the effect of age is not amenable in some countries, information obtained in other countries may be used in a correction model. Instead of avoiding corrections we suggest that countries can benefit from each other.
Nevertheless, we also worried about assuming that the effect of age and schooling on achievement is equal across countries. Here, we had to weigh the potential lack of ac-curacy against the option to ignore differences completely. In the language of the cor-rection model, global corcor-rection weights will improve the comparability in individual countries if they are better estimates of the real effects of age and schooling than effects of zero. Assuming that age and schooling have no effect at all (=effects of zero) is not plausible and contradictory to the findings from previous research which indicates that both age and schooling have a substantial effect on student achievement. Furthermore, we have shown that the correction model is rather robust against certain misspecifications. It is important to remember that all configurations of adjustments in-dicate that unadjusted scores are always misleading.
and science (50%) than in reading (40%). Even if this seems to be reasonable, further empirical studies would provide additional empirical knowledge to reinforce the choice of correction weights we suggest in this paper. It would also be interesting to combine different strategies to overcome the endogeneity problem. Instrumental variable estima-tion is a promising approach to tackle the problems associated with early or late school entry ages. It seems pertinent to consider combining this approach with the removal of students that repeated or skipped a grade, if such information is available.
Furthermore, our correction model is flexible enough to be applied in other domains and at different ages and grades. It would be interesting to evaluate how different sam-pling strategies affect the comparability. At the end of secondary school, for instance, TIMSS samples eighth graders while PISA samples 15-year-olds. The very limited re-search body on secondary school achievement indicates that the effect of schooling is stronger than the effect of age (Cliffordson, 2010; Luyten et al., 2008). Even though the existing research is far too limited for any definite conclusions, we may construct the hypothesis that grade-based sampling strategies result in more comparable samples when we compare student achievement across countries. The correction model pro-vides a framework to address this question empirically.
Finally, we would like to emphasize the fact that the proposed corrections are merely a starting point for substantial analyses and inferences. Sampling is extremely compli-cated as is dealing with observed differences. In this context, our correction model may be used to provide additional information for policymakers and researchers, thereby simplifying the access to international large-scale assessments.
Endnotes
a
www.iea.nl
b
www.ips.gu.se/english/Research/research_databases/compeat/
c
Defining the test month is important because we have no recorded information on the test month in 1970 and 1991. Note that May was the dominant test month in 2001, and according to Martin et al. (Mullis et al. 2003, p. 10),“the 2001 data collection was scheduled in each country for the same time of year, as in 1991”. Using May as a reference seems to be a good choice.
Competing interests
The authors declare that they have no competing interests.
Authors’contributions
RS analyzed the data and wrote the manuscript. MR and WB contributed with the comments to the manuscript. All authors read and approved the manuscript.
Author details
1TU Dortmund - Institute for School Development Research (IFS), Dortmund, Germany.2Department of Education and Special Education, University of Gothenburg, Gothenburg, Sweden.
Received: 9 May 2013 Accepted: 9 May 2013 Published: 9 July 2013
References
Alexander, KL, Entwisle, DR, & Olson, LS (2001). Schools, achievement, and inequality: a seasonal perspective.
Educ Eval Policy Anal, 23(2), 171–191. doi:10.3102/01623737023002171.
Angrist, JD, & Krueger, AB (1991). Does compulsory school attendance affect schooling and earnings?Quart J Econ, 1006(4), 979–1014.
Bedard, K, & Dhuey, E (2006). The persistence of early childhood maturity: international evidence of long-run age effects.Quart J Econ, 121(4), 1437–1472.
Bentin, S, Hammer, R, & Cahan, S (1991). The effect of aging and first grade schooling on the development on phonological awareness.Psychol Sci, 2(4), 271–274.
Cahan, S, & Cohen, N (1989). Age versus schooling effects on intelligence development.Child Dev, 60(5), 1239–1249. Cahan, S, & Davis, D (1987). A between-grade-levels approach to the investigation of the absolute effects of schooling
on achievement.Am Educ Res J, 24(1), 1–12.
Cliffordson, C (2010). Methodological issues in investigations of the relative effects of schooling and age on school performance: The between-grade regression discontinuity design applied to Swedish TIMSS 1995 data.Educ Res Eval, 16(1), 39–52.
Elley, WB (1992).How in the world do students read? IEA Study of Reading Literacy. Hamburg: Grindeldruck. Elley, WB (1994).The IEA study of reading literacy: achievement and instruction in thirty-two school systems. Oxford:
Pergamon Press.
Hansson, G (1975).Svensk skola i internationell beslysning II [The Swedish school in an international setting II]. Stockholm: Almqvist & Wiksell.
Joncas, M (2007). PIRLS 2006 sample design. In M. O. Martin, I. V. S. Mullis, & A. M. Kennedy (Eds.),PIRLS 2006 Technical Report(pp. 35–48). Chestnut Hill, MA: Boston College.
Joncas, M (2008). TIMSS 2007 sample design. In J. F. Olson, M. O. Martin, & I. V. S. Mullis (Eds.),TIMSS 2007 Technical Report(pp. 77–92). Chestnut Hill, MA: Boston College.
Kim, S-H, & Cohen, AS (2002). A comparison of linking and concurrent calibration under the graded response model.
App Psychol Measurement, 26(1), 25–41.
Luyten, H (2006). An empirical assessment of the absolute effect of schooling: regression-discontinuity applied to TIMSS-95.Oxford Rev Educ, 32(3), 397–429.
Luyten, H, Peschar, J, & Coe, R (2008). Effects of schooling on reading performance, reading engagement, and reading activities of 15-year-olds in England.Am Educ Res J, 45(2), 319–342.
Luyten, H, & Veldkamp, B (2011). Assessing effects of schooling with cross-sectional data: Between-grades differences addressed as a selection-bias problem.J Res Educ Effective, 4(3), 264–288.
Martin, M O, Mullis, IVS, & Foy, P (2011). Age distribution and reading achievement configurations among fourth-grade students in PIRLS 2006.IERI Monograph Series: Issues and Methodologies in Large-Scale Assessments, 4, 9-33. Martin, MO, Mullis, IVS, Gonzalez, EJ, & Kennedy, AM (2003).Trends in children’s reading literacy achievement 1991–2001:
IEA’s repeat in nine countries of the 1991 Reading Literacy Study. Chestnut Hill, MA: Boston College.
Martin, MO, Mullis, IVS, & Kennedy, AM (Eds.). (2003).PIRLS 2001 technical report. Chestnut Hill, MA: Boston College. Martin, MO, Mullis, IVS, & Kennedy, AM (Eds.). (2007).PIRLS 2006 technical report. Chestnut Hill, MA: Boston College. Mullis, IVS, Martin, MO, Gonzales, EJ, & Foy, P (2003).PIRLS 2001 international report: IEA’s study of reading literacy
achievement in primary schools in 35 countries. Chestnut Hill, MA: Boston College.
Mullis, IVS, Martin, MO, Kennedy, AM, & Foy, P (2007).PIRLS 2006 international report. IEA’s progress in international reading literacy study in primary school in 40 countries. Chestnut Hill, MA: Boston College.
OECD. (2009).PISA 2006 technical report. Paris: OECD.
Peaker, GF (1975).An empirical study of education in twenty-one countries: A technical report. Stockholm: Almqvist & Wiksell.
Postlethwaite, TN (1974). Target populations, sampling, instrument construction and analysis procedures.Com Educ Rev, 18(2), 157–179.
Rindermann, H (2007). The g-factor of international cognitive ability comparisons: The homogeneity of results in PISA, TIMSS, PIRLS and IQ-tests across nations.E J Personal, 21(5), 667–706.
Rust, KF (1994). Issues in sampling for international comparative studies in education: the case of the IEA reading literacy study. In M. Binkley, K. F. Rust, & M. Winglee (Eds.),Methodological issues in comparative educational studies
(pp. 1–18). Washington D.C: U. S. Department of Education.
Thorndike, RL (1973).Reading comprehension education in fifteen countries: An empirical study. Stockholm: Almquist & Wiksell.
UNESCO. (1997).ISCED 1997: International standard classification of education. UNESCO–Institute for Statistics. Van Damme, J, Lui, H, Vanhee, L., & Pustjens, H (2010). Longitudinal studies at the country level as a new approach to
educational effectiveness: explaining change in reading achievement (PIRLS) by change in age, socio-economic status and class size.Effective Educ, 2(1), 53–84.
Verachtert, P, Van Damme, J, Onghena, P, & Ghesquière, P (2009). A seasonal perspective on school effectiveness: evidence from a Flemish longitudinal study in kindergarten and first grade.Sch Effective Sch Improve, 20(2), 215–233.
Walker, DA (1976).The IEA six-subject survey: an empirical study of education in twenty-one countries. Stockholm: Almquist & Wiksell.
Zühlke, O (2011). Sampling design and implementation. In W. Schulz, J. Ainley, & J. Fraillon (Eds.),ICCS 2009 technical report(pp. 59–68). Amsterdam: International Association for the Evaluation of Educational Achievement (IEA).
doi:10.1186/2196-0739-1-1