1
Regional inequalities among different sections
in female literacy in Rajasthan
Annu
Department of Geography, MDU Rohtak
ABSTRACT
The present paper examines the extent of inter-district inequality/disparity in female education in Rajasthan in 2011. Rajasthan recorded the lowest female literacy in 2011 census. The disparity/inequality in literacy rate is estimated by using Modified Sopher’s disparity index. The empirical findings by and large support the hypothesis that (1) the inequality in literacy persists between SC, ST and General population; (2) the inter-district variation in literacy rates is found to be higher in ST followed by SC and General population in both rural and urban areas.
INTRODUCTION
Development of any economy is usually characterised by regional inequalities. The inequality will be of different kind in developed and underdeveloped areas. The presence of inequality augments the growth process and tries to bring the equalities among regions. Development of human capital receives high priority today all over the world. This is due to the realisation that mere growth of GNP does not automatically lead to over all development. The report of UNDP (1990) placed human being at the centre of all development programmes. It considered standard of living, education and health of human being as the ultimate objectives of the development. This paper attempts to examine the extent of inequality in female educational development in the state of Rajasthan, as the state has recorded the lowest female literacy rate of 52.12% in the country in 2011 census. Education is considered necessary for socio-economic development. The literacy of women is much more important as it provide the good base on which the progress of society depends.
Many schemes such as District Primary Education Programme, Sarva Sikshya Abhiyan, National Programme of Education of Girls at Elementary Level, National Literacy Mission, Universalisation of Girl Child Education, Non –Formal Education, Kasturba Gandhi Education Scheme, Kasturba Gandhi Balika Vidyalaya for girls belonging to SC/ST categories etc. have been launched to raise the literacy levels of females in India. There are sufficient evidences of inter-state, inter-district and intra-district inequality in India. Since this inequality is found to be more pronounced in across different sections, backward population (SC and ST) and non- backward population as well as in rural and urban areas, here is an attempt to estimate the inequality in education for females in different social groups of population in rural as well as urban areas. Here literacy has been taken as an indicator of education.
OBJECTIVES
The main objectives of the study are:
(1) To estimate the inequality in literacy rate between SC, ST and General population at district level. (2) To examine the inter-district variation in the female literacy rates as a whole and in rural and urban
areas.
HYPOTHESIS
Keeping in view the objectives of the study, the validity of the following hypothesis are also tested empirically. (1) The inequality in literacy persists between SC, ST and General population.
(2) The variation in literacy rates is found to be higher in ST followed by SC and General population in both rural and urban areas.
METHODOLOGY
I. The Data
II. The Methods
The inter-district variability in literacy rate is estimated by standard deviation and co-efficient of variation for 2011 census year for females of different social groups of population.
In order to estimate the inequality/disparity in literacy rates Sopher’s (1974) disparity index is used which may be written as follows.
D= log(X2/X1) + log [Q-X1/Q-X2] Where X2 ≥ X1
and Q ≥ 100
However, Kundu and Rao (1986) have modified Sopher’s index such that Q =200 would provide better results.
Here we have used X1=General population or SC Population X2= SC Population or ST Population Q = 200
The Empirical Results
This section presents the inter-district disparity/inequality in female literacy rates in Rajasthan.
Inter-district variation
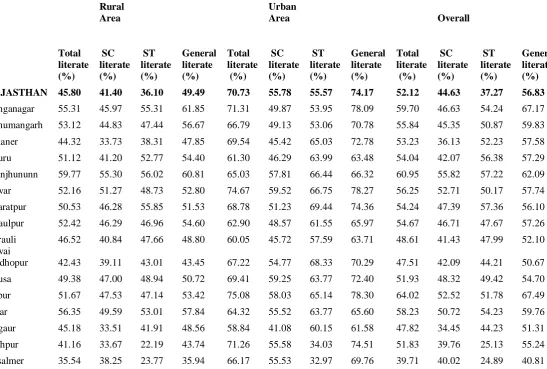
The inter-district variation in literacy rates is estimated in terms of standard deviation and co-efficient of variations (Table -1).
Table 1: Average and Co-efficient of variation among different sections
Rural Area
Urban
Area Overall
Total literate (%)
SC literate (%)
ST literate (%)
General literate (%)
Total literate (%)
SC literate (%)
ST literate (%)
General literate (%)
Total literate (%)
SC literate (%)
ST literate (%)
General literate (%) RAJASTHAN 45.80 41.40 36.10 49.49 70.73 55.78 55.57 74.17 52.12 44.63 37.27 56.83
Ganganagar 55.31 45.97 55.31 61.85 71.31 49.87 53.95 78.09 59.70 46.63 54.24 67.17 Hanumangarh 53.12 44.83 47.44 56.67 66.79 49.13 53.06 70.78 55.84 45.35 50.87 59.83 Bikaner 44.32 33.73 38.31 47.85 69.54 45.42 65.03 72.78 53.23 36.13 52.23 57.58 Churu 51.12 41.20 52.77 54.40 61.30 46.29 63.99 63.48 54.04 42.07 56.38 57.29 Jhunjhununn 59.77 55.30 56.02 60.81 65.03 57.81 66.44 66.32 60.95 55.82 57.22 62.09 Alwar 52.16 51.27 48.73 52.80 74.67 59.52 66.75 78.27 56.25 52.71 50.17 57.74 Bharatpur 50.53 46.28 55.85 51.53 68.78 51.23 69.44 74.36 54.24 47.39 57.36 56.10 Dhaulpur 52.42 46.29 46.96 54.60 62.90 48.57 61.55 65.97 54.67 46.71 47.67 57.26 Karauli 46.52 40.84 47.66 48.80 60.05 45.72 57.59 63.71 48.61 41.43 47.99 52.10 Sawai
3
Barmer 38.55 34.39 21.19 40.98 66.64 50.48 28.38 70.62 40.63 35.50 21.37 43.32 Jalor 36.78 32.68 18.53 40.27 56.95 46.26 21.71 62.32 38.47 33.87 18.69 42.18 Sirohi 32.66 28.44 16.34 44.52 66.94 56.11 42.40 73.09 39.73 34.21 18.19 52.28 Pali 43.48 40.25 25.38 46.25 63.89 53.40 33.51 67.03 48.01 42.78 26.12 51.25 Ajmer 41.29 38.12 23.28 42.63 76.50 66.43 65.54 79.49 55.68 51.44 33.57 57.35 Tonk 39.66 37.15 34.82 41.68 64.76 55.71 66.89 66.47 45.45 40.56 35.62 48.65 Bundi 41.16 37.39 37.25 44.07 67.42 53.58 49.33 72.01 46.55 40.71 37.86 51.24 Bhilwara 40.58 35.41 27.52 43.80 71.79 55.20 41.63 75.77 47.21 39.12 28.42 51.36 Rajsamand 43.32 43.11 25.12 46.95 72.27 59.42 40.27 76.78 47.95 46.06 26.15 52.09 Dungarpur 43.96 45.05 39.37 57.96 77.11 58.73 56.29 84.39 46.16 47.16 39.66 62.75 Banswara 40.10 40.36 35.94 62.09 79.26 54.41 55.46 84.73 43.06 42.03 36.16 68.99 Chittaurgarh 40.24 35.55 24.15 44.79 74.27 61.30 47.75 77.21 46.53 39.46 25.16 51.82 Kota 53.95 46.82 52.15 57.18 73.71 58.96 54.25 78.50 65.87 53.52 52.78 71.21 Baran 47.78 44.08 41.66 51.86 67.48 52.90 55.00 72.39 51.96 46.25 42.27 57.27 Jhalawar 41.51 35.93 36.71 43.89 72.11 54.74 57.69 76.42 46.53 38.88 37.89 49.90 Udaipur 39.82 47.10 31.62 51.92 81.24 70.43 52.26 84.95 48.45 55.40 32.22 64.25 Pratapgarh 39.04 44.08 30.82 58.68 77.15 64.98 51.03 81.33 42.35 47.58 31.00 63.74
C.V. 14.53 14.84 31.68 13.76 8.49 11.39 23.53 8.82 13.64 13.99 30.63 13.06
The state has recorded the average female literacy rate of 52.12%. Jalor has lowest literacy rate of 38.47% while Kota has highest literacy rate of 65.87%. The average values for literacy are the highest in urban area followed by overall average and rural area recorded the least female literacy. The average literacy in rural area is 45.80% while literacy in urban area is found to be 70.73%. In case of rural area it is district Sirohi which have lowest literacy of 32.66% while Jhunjhununn records the highest literacy rate of 59.77%. In urban areas Jalor records the lowest literacy rate of 56.95% while Udaipur records the highest literacy rate of 81.24%. The female literacy also shows a peculiar trend as it is highest for the General population followed by the SC population and ST population with average values of 56.83%, 44.63% and 37.27% respectively. Jaisalmer (40.81%), Jalor (33.87%), Sirohi (18.19%) record the lowest literacy rates while Kota (71.21%), Jhunjhununn (55.82%), Bharatpur (57.36%) record the highest literacy rates for the General population, SC and ST population respectively. Co-efficient of correlation is highest in rural area while urban area recorded the least coefficient of correlation. In all cases the co-efficient of variation is the highest for the ST population followed by SC and General population. It clearly indicates that the degree of variation is always high in less developed section and less developed area in the region. It also supports the hypothesis that the variation in literacy rates is found to be higher in ST followed by SC and General population in both rural and urban areas.
Intra-district variation
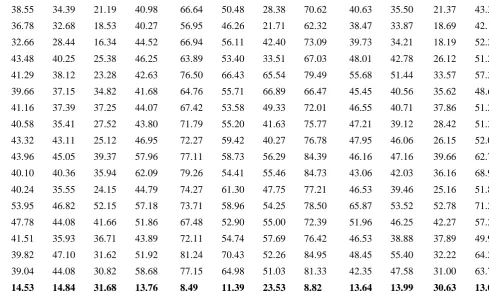
The disparity in literacy rates between SC, ST and General population has been calculated for rural, urban area and at overall district level with the help of Modified Sopher’s index (Table-2).
Table 2: Sopher’s Index among different sections
Rural Urban Overall
General & SC population
General & ST
population
SC& ST population
General & SC population
General & ST
population
SC& ST population
General & SC population
General & ST
population
SC& ST population
RAJASTHAN 0.100 0.174 0.074 0.185 0.185 0.000 0.141 0.239 0.100
Jhunjhununn 0.058 0.050 -0.008 0.086 0.000 -0.087 0.066 0.054 -0.012 Alwar 0.016 0.046 0.029 0.182 0.105 -0.073 0.058 0.082 0.030 Bharatpur 0.062 -0.049 -0.108 0.233 0.046 -0.187 0.097 -0.012 -0.112 Dhaulpur 0.097 0.085 -0.004 0.187 0.042 -0.143 0.119 0.108 -0.012 Karauli 0.097 0.012 -0.084 0.196 0.062 -0.138 0.129 0.050 -0.084 Sawai
Madhopur 0.057 0.004 -0.049 0.157 0.022 -0.138 0.104 0.078 -0.026 Dausa 0.041 0.021 -0.022 0.127 0.086 -0.044 0.070 0.062 -0.012 Jaipur 0.066 0.070 0.004 0.198 0.124 -0.073 0.156 0.163 0.008 Sikar 0.093 0.050 -0.035 0.102 0.017 -0.087 0.097 0.058 -0.035 Nagaur 0.202 0.081 -0.119 0.237 0.013 -0.223 0.218 0.085 -0.135 Jodhpur 0.139 0.351 0.211 0.188 0.461 0.273 0.188 0.424 0.236 Jaisalmer -0.031 0.208 0.244 0.145 0.433 0.289 0.009 0.256 0.244 Barmer 0.093 0.335 0.243 0.210 0.520 0.311 0.107 0.363 0.257 Jalor 0.111 0.389 0.279 0.179 0.568 0.392 0.118 0.415 0.295 Sirohi 0.237 0.506 0.270 0.167 0.329 0.162 0.234 0.548 0.315 Pali 0.077 0.316 0.239 0.141 0.398 0.258 0.104 0.360 0.260 Ajmer 0.061 0.311 0.252 0.124 0.132 0.008 0.062 0.301 0.234 Tonk 0.061 0.096 0.033 0.109 -0.004 -0.117 0.104 0.174 0.070 Bundi 0.089 0.089 0.000 0.184 0.236 0.050 0.129 0.167 0.042 Bhilwara 0.114 0.242 0.132 0.208 0.364 0.161 0.150 0.317 0.169 Rajsamand 0.049 0.329 0.277 0.168 0.395 0.227 0.070 0.371 0.299 Dungarpur 0.148 0.220 0.074 0.244 0.269 0.026 0.169 0.267 0.097 Banswara 0.252 0.314 0.062 0.293 0.282 -0.012 0.297 0.378 0.081 Chittaurgarh 0.125 0.320 0.197 0.153 0.303 0.148 0.150 0.386 0.233 Kota 0.115 0.058 -0.058 0.188 0.240 0.050 0.178 0.187 0.008 Baran 0.093 0.122 0.035 0.198 0.178 -0.022 0.126 0.175 0.050 Jhalawar 0.107 0.100 -0.008 0.218 0.182 -0.030 0.136 0.154 0.017 Udaipur 0.053 0.272 0.214 0.136 0.319 0.187 0.093 0.392 0.300 Pratapgarh 0.165 0.358 0.192 0.154 0.301 0.145 0.176 0.407 0.230
Overall disparity in literacy
5 Disparity in rural area
Disparity in rural area follows the same trend, it is highest between General population and ST population followed by General population and SC population and least disparity is observed in between SC and ST population. In case of disparity among General population and SC population Jaisalmer shows the negative value -0.031 which indicates that SC condition is better than the General population; the highest disparity 0.252 is found in Banswara, while lowest disparity 0.016 is found in Alwar. In case of disparity among General population and ST population Bharatpur shows the negative value -0.049, it indicates that situation of ST is far better than the General population; the highest disparity 0.506 is found in Sirohi while Sawai Madhopur experiences the lowest disparity value of 0.004. In case of disparity in SC and ST population 14 districts experience negative values which clearly indicate that situation of ST population is better than the SC population; the highest disparity 0.279 is found in Jalor while Bundi records no disparity among two sections of the society. Disparity in rural area ranges from zero in Bundi to 0.506 in Sirohi between SC/ST population and General/ST population respectively.
Disparity in urban area
Disparity in urban area follows a different trend. Disparity between General and SC population as well as General and ST population show equal value while Rajasthan show no disparity between SC/ST populations. In case of General and SC population the lowest value 0.086 is experienced by Jhunjhununn while Banswara experiences the highest disparity value of 0.293. In case of General and ST population the highest disparity value 0.568 is seen in Jalor while Jhunjhununn experiences no disparity. In case of disparity in SC/ST population 18 districts experience negative values which clearly indicate situation of ST population is far better than the SC population. The highest disparity value 0.392 is seen in Jalor while least disparity value 0.008 is experienced by Ajmer. The disparity value ranges from zero in Jhunjhununn to 0.568 in Jalor between General and ST population.
CONCLUSION
The preceding analysis clearly reflects that (1) the variation in literacy rates is found to be higher in ST population followed by SC and General population in both rural and urban areas. (2) inequality in literacy is highest for the General/ST population while least values are seen in SC/ST population.(3) urban area experience the higher disparity than the rural area. (4) 12 districts; Churu, Nagaur, Ganganagar, Bharatpur, Karauli, Bikaner, Sawai Madhopur, Sikar, Hanumangarh, Dausa, Jhunjhununn, Dhaulpur experience negative disparity values when compared SC and ST population in all areas. Hence it can be said that inter and intra disparity in female literacy in Rajasthan do exist. The good thing that has come out from the analysis is that in certain districts the literacy rates for the backward sections are higher than the non backward class which clearly indicates the awareness among the backward classes regarding education but still a lot to be done as state is laggard in terms of female education.
REFERENCES
[1]. Census of India (2011), Directorate of Census, Government of India.
[2]. Dreze, Jean and Amartya Sen. (1995). India: Economic development and social opportunity. New Delhi: Oxford University Press.
[3]. Hirshman, A.O. (1961). The strategy of economic development. 1st ed. New Heaven: Yale University Press. [4]. Kamat,A.R. (1981). Education and social change amongst the scheduled castes and scheduled tribes. Economic
and Political Weekly. 16(31), 1279-1284.
[5]. Kundu, A & Rao, J.M. (1983). Inequality in education development: Issues in measurement changing structure and its socio-economic correlates with special reference to India. In: Moonis Raza (ed), Educational planning : A long term perspective. 1st ed. New Delhi: NIEPA. pp.(435-465).
[6]. Lockheed, M, A Verspooretal. (1991). Improving primary education in developing countries. London: Oxford University Press.
[7]. Mahmood, A. (1977). Statistical methods in geographical studies. 1st ed. New Delhi: Rajesh Publications. [8]. Ramotra, K.C. (2008). Development processes and scheduled castes. 1st ed. Jaipur: Rawat Publications. [9]. Sopher,D.K. (1974). Measurement of disparity . The Professional Geographer, 26 (4), 389-392.